Abstract
It is well known that adult cartilage lacks the ability to repair itself; this makes articular cartilage a very attractive target for tissue engineering. The majority of articular cartilage repair models attempt to deliver or recruit reparative cells to the site of injury. A number of efforts are directed to the characterization of progenitor cells and the understanding of the mechanisms involved in their chondrogenic differentiation. Our laboratory has focused on cartilage repair using mesenchymal stem cells and studied their differentiation into cartilage. Mesenchymal stem cells are attractive candidates for cartilage repair due to their osteogenic and chondrogenic potential, ease of harvest, and ease of expansion in culture. However, the need for chondrogenic differentiation is superposed on other technical issues associated with cartilage repair; this adds a level of complexity over using mature chondrocytes. This chapter will focus on the methods involved in the isolation and expansion of human mesenchymal stem cells, their differentiation along the chondrogenic lineage, and the qualitative and quantitative assessment of chondrogenic differentiation.
Keywords: Mesenchymal stem cell, Chondrogenesis, Tissue culture, Fibroblast growth factor-2, Transforming growth factor-beta, Aggregate culture, Cartilage
1. Introduction
Bone marrow is the most common source for the isolation of adult human mesenchymal stem cells (hMSCs) (1) as first described by Friedenstein and colleagues (2). In the mid-to-late 1980s, Owen proposed that marrow stromal cells give rise to cells of the mesenchymal lineages including fibroblasts, reticular cells, adipocytes, osteoblasts, and others (3, 4). This model was later termed mesengenesis (5). For some time, it has been known that rat and human bone marrow form bone and cartilage when loaded into ceramic carriers and implanted subcutaneously (6–8). Goshima et al. achieved similar results with cells cultured from rat bone marrow (9, 10). It was also shown by Haynesworth et al. (11) that cultured human bone marrow-derived cells assay could generate bone when placed in the same assay. These cultured cells were isolated from bone marrow, recovered from the top of a density gradient, and seeded into tissue culture dishes in medium containing selected lots of fetal bovine serum (FBS) (12). After subcultivation, these cultured cells referred to as hMSCs exhibit a strong, yet not unlimited, proliferative potential (13–15). As Human MSCs are primary cultures, the preparation-to-preparation variability in respect to proliferation, differentiation potential, and eventual senescence (14) poses a significant challenge.
A number of in vitro assays can be used to assess the multipo-tentiality of these cell preparations (16). Osteogenic differentiation of hMSCs can be triggered by exposure to specific culture supplements including dexamethasone, ascorbate-2-phosphate, and beta glycerolphosphate (13, 17). Adipogenic differentiation can also be induced through the use of induction medium containing dexamethasone, indomethacin, isobutylmethylxanthine, and insulin, but these cultures require a higher seeding density than that used for osteogenic differentiation (16). Finally, hMSCs placed in aggregate or pellet cultures in a defined medium containing dexamethasone, ascorbate-2-phosphate, insulin, selenious acid, transferrin, sodium pyruvate, and transforming growth factor-beta will undergo chondrogenic differentiation (16, 18–21). The ability of MSCs to differentiate along these lineages is strongly suggestive of their multipotency and stem cell nature. However, hMSCs do not maintain these characteristics indefinitely and hMSCs senescence with extensive subcultivation in vitro whereby they lose their proliferation and differentiation potential (1, 22, 23).
Tissue engineering combines the fields of cell biology, engineering, material sciences, and surgery to provide new functional tissues using living cells, biomatrices, and signaling molecules (24–26). In recent years, this discipline has greatly expanded, with numerous research groups focusing on the development of strategies for the repair and regeneration of a variety of tissues (27, 28). Many of these tissue-engineered approaches have targeted the musculoskeletal system in general, with special emphasis on articular cartilage (29–37). Articular cartilage is a especially attractive target for tissue engineering strategies because it has been well documented that injuries of articular cartilage, an avascular tissue without direct access to a significant source of reparative cells, do not spontaneously heal (38–44). The vast majority of approaches to repair or regenerate articular cartilage are cell-based, aiming to provide a population of reparative cells to the injured site. Cells used to develop these strategies can be either differentiated chondrocytes isolated from unaffected areas of the joint surface (35, 45–56) or progenitor cells capable of differentiating into chondrocytes and can be isolated from a variety of tissues (57–69). As harvesting a tissue biopsy from valuable healthy articular cartilage will result in an additional injury, which ultimately cannot repair itself, this cell source does not seem to be a good choice. Therefore, a number of research efforts are directed to the isolation of progenitor cells and the understanding of the mechanisms involved in their chondrogenic differentiation. Protocols for the isolation and mitotic expansion of adult human bone marrow-derived mesenchymal stem cells (2, 11, 70, 71) and the specific culture conditions developed for their chondrogenic differentiation (18, 19, 72, 73) will be further discussed in this chapter.
2. Materials
2.1. MSC Isolation and Culture
15 and 50-ml centrifuge tubes (BD Biosciences, Franklin Lakes, NJ).
50-ml polycarbonate capped centrifuge tubes (Thermo Fisher Scientific, Waltham, MA).
Pipettes and tissue culture dishes (BD Biosciences).
Tyrode’s salt solution (Sigma, St. Louis, MO).
Complete culture medium: Dulbecco’s Modified Eagle’s Medium, Low (1.5 g/l) Glucose (DMEM-LG) (Invitrogen, Carlsbad, CA) supplemented with 10% FBS (best available). Store at 4°C for up to 8 weeks.
Percoll gradient (see Note 1): Mix 22.05 ml Percoll (Sigma), 2.45 ml of 1.5 M NaCl (Fisher), and 10.5 ml Tyrode’s salt solution. Add 35 ml of Percoll solution into individual 50-ml polycarbonate capped sterile centrifuge tubes. Spin tubes at 13,000 rpm (21,200 × g) for 15 min in a SS 34 rotor in a Sorvall centrifuge (Thermo Fisher Scientific, Waltham, MA). The resulting density gradient is 1.03–1.12 g/l. Percoll should only be stored for up to 4 weeks at 4°C.
0.25% trypsin 53 mM EDTA (Gibco).
Bovine calf serum (BCS) (Thermo Fisher Scientific, Waltham, MA).
4% acetic acid (Fisher) in H2O.
70% ethanol in H2O.
15% sodium hypochlorite (bleach) in H2O.
Fibroblast Growth Factor-2 (FGF-2): Prepare a 10-μg/ml stock solution (1,000×) of FGF-2 (Peprotech) in complete culture medium. Store at −80°C.
DMSO (Sigma).
Recovery™ Freezing medium (Invitrogen).
Cryogenic vials (Thermo Fisher Scientific).
“Mr. Frosty™” isopropanol freezing container (Thermo Fisher Scientific).
Liquid nitrogen storage.
Liquid nitrogen.
2.2. MSC Chondrogenic Differentiation
Chondrogenic differentiation medium: Dulbecco’s Modified Eagle’s Medium, High (4.5 g/l) Glucose (DMEM-HG, Invitrogen) supplemented with 10% ITS+ Premix Tissue Culture Supplement (Becton Dickinson), 10−7 M dexamethasone (Sigma), 1 μM ascorbate-2-phosphate (Wako, Richmond, VA), 1% sodium pyruvate (Invitrogen), and 10 ng/ml transforming growth factor-beta 1 (TGF-β1, Peprotech, Rocky Hill, NJ).
Dexamethasone stock solution (100×): dexamethasone (Sigma) is dissolved at 10−3 M in absolute ethanol and diluted 1:100 with DMEM-HG to obtain the 10−5 M stock solution. Store at −20°C.
Ascorbate-2-phosphate stock solution (100×): Prepare 100 μM ascorbate-2-phosphate (Wako) in H2O. Store at −20°C.
Transforming Growth Factor-beta 1 (TGF-β1): Prepare a 1-μg/ml stock solution (100×) of TGF-β1 (Peprotech, Rocky Hill, NJ) in 4 mM hydrochloric acid (HCl) and 1% bovine serum albumin. Store at −80°C.
Polypropylene 96-well plates (Phenix, Candler, NC).
Electronic repeater pipette (Brand, Essex, CT).
Repeater pipette tips (Brand; Eppendorf, Westbury, NY).
Large orifice 200-μl pipette tip (Fisher).
2.3. Histologic and Immunohistochemical Analyses
10% neutral-buffered formalin (Fisher).
Toluidine Blue (Fisher).
Anticollagen type I antibody (clone col-1, Sigma) used diluted 1:500.
Anticollagen type II antibody (Developmental Studies Hybridoma bank, University of Iowa, Iowa City, IA). Used diluted 1:50.
Anticollagen type X antibody (Dr. Gary J. Gibson, Ph.D., Breech Research Laboratory, Bone & Joint Center, Henry ford Hospital & Medical Centers, Detroit, MI). Used diluted 1:100.
Mouse preimmune IgG (Vector Laboratories, Burlingame, CA).
Fluorescein isothiocyanate (FITC)-conjugated goat antimouse Immunoglobulin secondary antibody (Cappel 55499, detects IgG, IgA, and IgM isotypes. MP Biomedicals, Irvine, CA, USA), used diluted 1:500.
Ethanol (Aaper, Shelbyville, KY).
Xylene (Fisher).
Pronase E (Sigma) prepared as 1 mg/ml solution in PBS.
5% BSA (Sigma) in PBS for 30 min.
N-propyl gallate. Prepared as a 5% solution in glycerol (both Sigma). This can take up to a day to dissolve.
2.4. DNA and GAG Assays
Papain buffer: 25 μg/ml papain (Sigma); 2 mM cysteine (Sigma); 50 mM sodium phosphate (Fisher); 2 mM EDTA (Sigma) in 150 ml nuclease-free water. Adjust pH to 6.5 and filter sterilize with a 0.2-μm Nalgene filter.
Neutralizing solution: 4 M NaCl (Fisher), 100 mM Na2PO4 (pH 7.2) (Fisher); 0.1 N HCl.
Hoechst Dye: Prepare a 1-mg/ml Hoechst #33258 (bisBenzimide, Sigma B-2883) stock solution in H2O. Dilute stock solution 1:1,500 (0.7 μg/ml) in H2O to prepare a working solution.
Certified Calf Thymus DNA standard (Sigma). Prepare DNA standards according to Table 1.
Visible/UV spectrophotometer (Tecan, Maennedorf, CH).
Dot-blot apparatus (Bio-Rad, Hercules, CA).
0.45 μm pore size Nitrocellulose membrane (Bio-Rad).
Safranin O reagent: 0.02% safranin O in 50 mM (pH 4.8) sodium acetate (Fisher). Filter solution through a 0.45-μm filter. Store at room temperature for up to 6 months.
CPC: 10% cetylpyrinidium chloride (Sigma) in H2O. Warm solution to dissolve. Filter solution through a 0.45-μm filter. Store at room temperature for up to 6 months.
Chondroitin sulfate C (CS-C): Prepare 1 mg/ml chondroitin sulfate c (shark cartilage) (Seikagaku America, East Falmouth, MA) stock solution in water. Dilute stock solution 1:5 (0.2 mg/ml) to prepare a working solution. Prepare (CS-C) standards according to Table 2.
Table 1.
Matrix for the preparation of calf thymus standards for DNA assay
| DNA concentrationa (ng/ml) |
Papain buffer (μl) | Neutralizing solution (μl) |
0.1 N NaOH (μl) | 1 mg/ml calf thymus DNA (μl) |
|---|---|---|---|---|
| 0 | 200 | 400 | 400 | – |
| 500 | 200 | 400 | 400 | 1 |
| 1,000 | 200 | 400 | 400 | 2 |
| 1,500 | 200 | 400 | 400 | 3 |
| 2,000 | 200 | 400 | 400 | 4 |
This will be the final concentration in the well once the dye solution is added
Table 2.
Matrix for the preparation of chondroitin sulfate standards for GAG assay
| CS-Ca (μg) | H2O (μl) | 0.2 mg/ml CS-C in H2O (μl) |
1 mg/ml CS-C in H2O (μl) |
|---|---|---|---|
| 0 | 75 | – | – |
| 1 | 60 | 15 | – |
| 2 | 45 | 30 | – |
| 3 | 30 | 45 | – |
| 4 | 15 | 60 | – |
| 5 | 60 | – | 15 |
| 6 | 57 | – | 18 |
This is the total amount of Chondroitin sulfate-C (CS-C) that is loaded in the wells; it is not a concentration
2.5. RNA Extraction
TRIzol reagent (Invitrogen)
4-ml cryovial (Nunc)
Omni TH handheld homogenizer (OMNI international, Marietta, GA)
Hard tissue plastic tips (OMNI international)
Isopropanol (Fisher)
Ethanol (Fisher)
Nuclease-free water (Invitrogen)
3. Methods
3.1. Isolation and Seeding of Human Mesenchymal Stem Cells
MSCs are isolated by their ability to adhere to tissue culture plastic and proliferate under specific culture conditions (12). The original bone marrow cell suspension seeded on the culture vessels contains a heterogeneous mixture of cells that includes red blood cells, nucleated cells of the hematopoietic lineage, monocytes, macrophages, and fibroblast-like cells from the bone marrow stroma. For the most part, erythrocytes and leukocytes do not attach to the tissue culture surface and are eventually removed during the medium changes and subsequent subculturing (see Notes 2, 3, 4).
Prepare the biological safety cabinet for aseptic work.
Bring the syringe with the bone marrow into the biological safety cabinet (see Fig. 1).
Label and open a sterile 50-ml disposable centrifuge tube.
Add 25 ml of complete medium to the 50-ml tube.
Eject the contents of the syringe into the 50-ml disposable centrifuge tube.
Thoroughly mix the medium and bone marrow sample by pipetting up and down with a 25-ml pipette.
Transfer a small aliquot (0.2 ml) to a 1.5-ml microcentrifuge tube for a preliminary cell count.
Centrifuge the entire bone marrow sample at 500 × g for 5 min in a benchtop centrifuge.
- While the sample is being centrifuged, determine the number of cells in the preliminary sample as follows:
- Transfer 50 μl of the sample from step 2 to a 0.5 or 1.5-ml microcentrifuge tube.
- Add 50 μl of serum-containing medium.
- Add 100 μl 4% acetic acid and mix to lyse the erythrocytes.
- Count the nucleated cells with a hemacytometer and determine the total number of nucleated cells in the 50-ml tube.
Determine the number of tubes of preformed Percoll (density 1.03–1.12 g/ml) required to fractionate the nucleated cells based on the preliminary cell count (11). Load no more than 2.0 × 10⁸ cells per tube.
After the sample has been centrifuged, carefully remove the fat layer and aspirate the supernatant being careful not to disturb the pellet (see Fig. 2).
Adjust the volume of the pellet to allow 5 ml of cell suspension per tube of Percoll. If the volume of the pellet will exceed 5 ml, divide the volume between two tubes of Percoll.
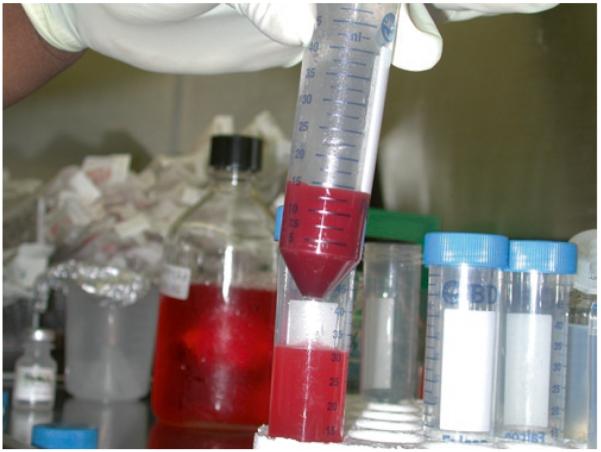
Load the proper volume of cell suspension carefully onto the top of a Percoll gradient. Transfer the cell suspension slowly so that cells will remain at the top of the gradient (see Fig. 3).
Carefully transfer the tubes to a centrifuge and spin in SS 34 rotor in a Sorvall centrifuge at 400 × g for 15 min with the brake off.
Return the sample (see Fig. 4) to the biological safety cabinet.
Carefully pipette off the top layer or layers of cells (about 10–14 ml) and transfer them to another labeled sterile 50-ml centrifuge tube.
Add serum-containing medium to the tube for a final volume of 50 ml.
Spin tubes in a benchtop centrifuge at 500 × g for 5 min.
Remove and discard supernatant.
Resuspend the cell pellet (see Fig. 5) in 10 ml of complete medium.
Use 1-ml pipette to take a small sample (about 100 μl) for determination of the final cell number as described in step 9.
Plate cells at 1.7 × 10⁶ per cm2 in tissue culture dishes or flasks in complete medium.
Fig. 1.
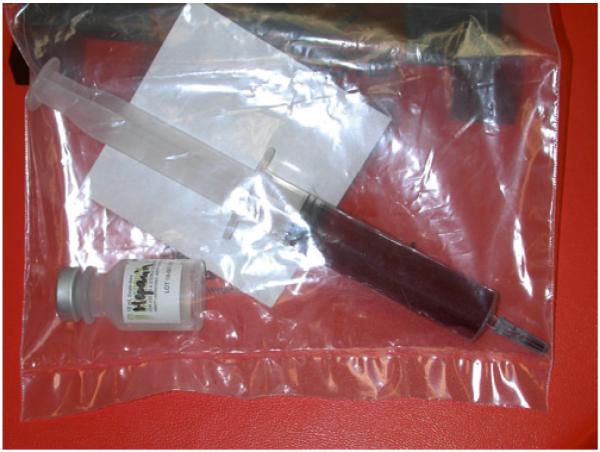
Bone marrow aspirate in the syringe immediately after aspiration from a healthy volunteer donor.
Fig. 2.
Loose bone marrow cell pellet after initial centrifugation.
Fig. 3.
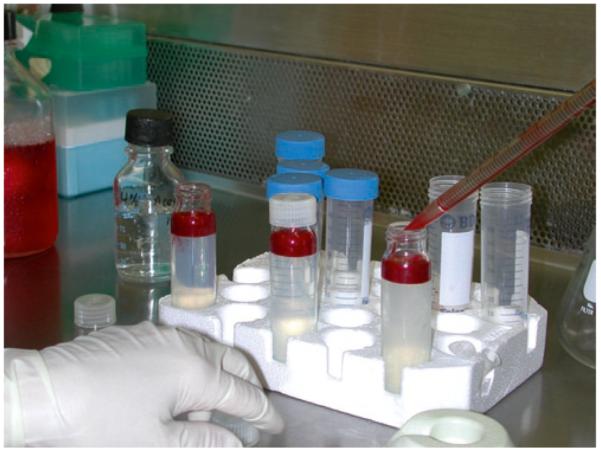
Bone marrow cells being layered over the preformed Percoll gradient.
Fig. 4.
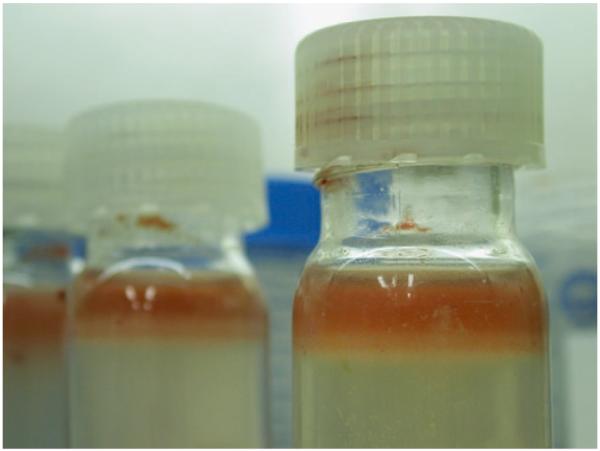
Sample after gradient fractionation; note the band of nucleated cells at the top of the gradient.
Fig. 5.
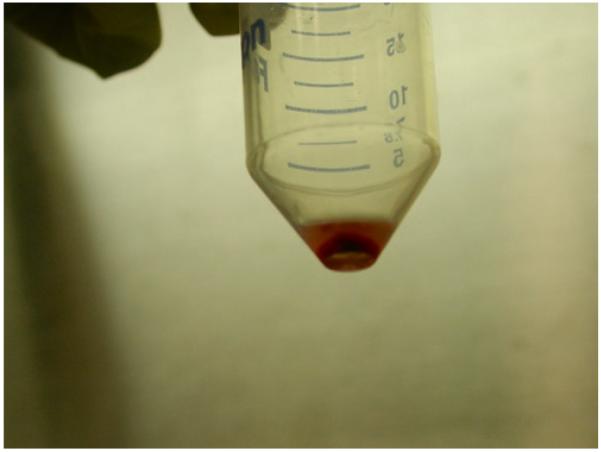
Pellet of mononuclear cells after the final wash and centrifugation.
3.2. Mesenchymal Stem Cell Culture
Mesenchymal Stem Cells are cultured at 37°C in a humidified atmosphere of 95% air and 5% CO2. Only a small percentage of the cells in the original cell suspension will attach to the tissue culture surface. These fibroblast-like cells proliferate and form loose colonies of spindle-shaped cells that are usually visible under the microscope between days 4 and 6 of culture. These colonies will increase in size and cell number over the next 7–10 days and should be subcultured before the cells become confluent (it is important to note that proliferation of these cells is not contact-inhibited). No specific efforts are made to remove nonadherent cells, medium is pipetted or aspirated from the dish without vigorous swirling or rinsing. It is hypothesized that these “contaminating” cells provide cytokines and other factors needed for the growth of the attached cells during the primary culture.
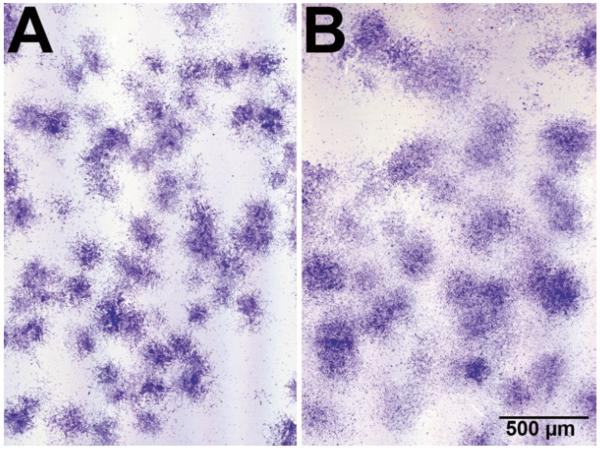
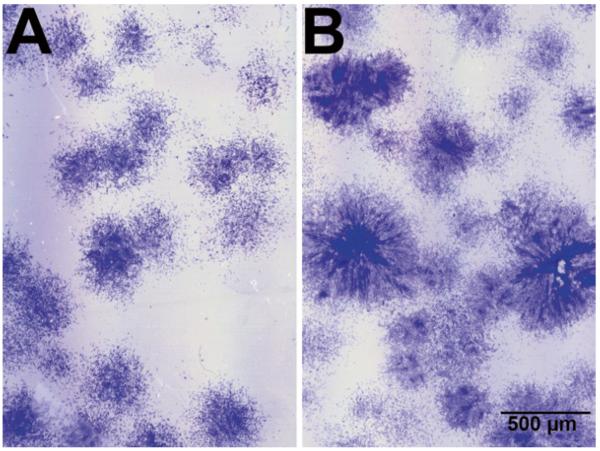
Ourselves and others have demonstrated that supplementation of the culture medium with additional FGF-2 enhances proliferation and, more importantly, the chondrogenic potential of hMSCs (74–77). In the first (and subsequent) medium changes, the cultures receive FGF-supplemented culture medium (see Note 5 and Fig. 6). Human MSCs must be subcultured before they reach confluence. Typically, they are passaged when they reach 80–90% confluence. In primary cultures, the density within the colonies rather than the level of confluence is the primary consideration to determine when the cells should be subcultured (see Fig. 7). Primary cultures are usually subcultured around day 14 of culture (±3 days).
Fig. 6.
Appearance of hMSC colonies in primary culture. (a) Control culture. (b) FGF-treated culture; note that the colonies are looser and there is a higher number of cells between the colonies in the FGF-treated cultures. Crystal black staining.
Fig. 7.
Appearance of hMSC colonies in primary culture. (a) Colonies are not yet ready to be subcultured. (b) Colonies must be subcultured; note the higher cell density in the center of the colonies. Crystal black staining.
During primary MSC culture, make complete medium changes twice per week. Aspirate spent medium from plates and add fresh FGF-2-supplemented complete medium. Repeat this step until cultures reach 80–90% confluence.
Rinse the cell layer with an appropriate volume (5 ml for a 56 cm2 tissue culture dish) of Tyrode’s salt solution to wash cells.
Repeat the rinse.
Add the appropriate volume of trypsin-EDTA (4 ml for a 56-cm2 tissue culture dish).
Return cultures to the incubator for 5–7 min. Keep the time of exposure as brief as possible (see Note 6).
When the majority of the cells have become well-rounded or have detached from the tissue culture surface, stop the reaction by adding BCS equal to half the volume of trypsin-EDTA.
Draw up the cell suspension with a pipette and, with the same pipette, use the suspension to gently wash the remaining cells from the dish.
Transfer the cell suspension from all of the cultures to an appropriate size centrifuge tube(s).
Spin tubes in a benchtop centrifuge at 500 × g for 5 min.
Resuspend the cell pellet in 5–10 ml of FGF-2-supplemented complete medium.
Determine cell number with a hemacytometer.
Plate cells at 3.5–4.0 × 10³ cells/cm2.
Further subculturing is conducted according to the above protocol (see Note 7). MSCs have a high proliferative capacity and may be subcultured multiple times. During the process of cell expansion, MSCs maintained in complete medium remain in an undifferentiated state (17). Subcultured MSCs remain spindle-shaped fibroblastic cells, distributed evenly over the culture dish.
3.3. Human MSC Cryopreservation and Recovery
At this point, expanded MSCs can either be subcultured or cryopreserved for later use. This decision depends on the investigation underway, and given donor-to-donor variability of these preparations, it may be advisable to bank an aliquot of the cells as a matter of course.
3.3.1. Cryopreservation
Follow steps 1–11 of Subheading 3.2.
Label a sufficient quantity of appropriately-sized freezing vials using a LN2 compatible pen.
Spin cells in a benchtop centrifuge at 500 × g for 5 min.
Resuspend the cells at 1.0 × 10⁶ cells/ml in freezing medium and immediately place on ice (see Note 8).
Aliquot cells into cryogenic vials.
Cap vials and place in an isopropanol freezing container.
Transfer the freezing container to −80°C freezer overnight.
Transfer frozen vials to a LN2 storage container for long-term storage.
3.3.2. Recovery of Cryopreserved Human MSCs
Remove vial from LN2 storage container.
Thaw vial rapidly in a 37°C water bath.
Transfer the cell suspension to a 15-ml conical tube containing approximately 10 ml of complete medium prewarmed at 37°C.
Centrifuge for 5 min at 500 × g.
Remove most of the freezing medium (so as not to aspirate any of the sedimented cells) and resuspend the cell pellet in prewarmed (37°C) complete medium.
Plate cells at 1.0 × 10⁶ cells per T175 flask. Do not handle the flask for at least 24 h.
3.4. Chondrogenic Induction
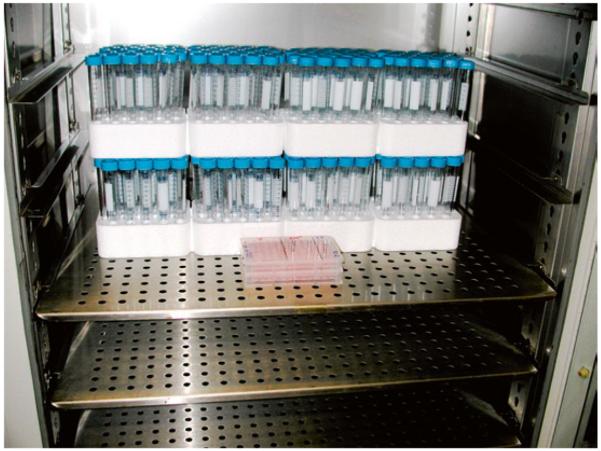
Bone marrow-derived mesenchymal stem cells can be induced to differentiate into chondrocytes under specific culture conditions. These conditions include three-dimensional conformation of the cells in aggregates where high cell density and cell–cell interaction play an important role in the mechanism of chondrogenesis. Together with these physical culture conditions, a defined culture medium containing TGF-β1 is required to achieve chondrogenic differentiation (18, 19, 78). The culture conditions described below were initially developed for a small-scale chondrogenic differentiation assay, although we have also found that they work well for larger-scale bioreactor-based tissue engineering. Traditionally, these assays were performed in 15-ml polypropylene centrifuge tubes, but we have developed an improved method for preparing cell aggregates for in vitro chondrogenesis studies (79). This method replaces the original 15-ml polypropylene tubes with 96-well plates (see Fig. 8). These modifications allow a high-throughput approach to chondrogenic cultures, which reduces both the cost and time with no detrimental effects on the histological and histochemical qualities of the aggregates.
Fig. 8.
Comparison of plasticware and incubator space needed for 200 aggregates in 15-ml centrifuge tubes or in 96-well polypropylene plates.
Centrifuge harvested cells (see Subheading 3.2 steps 1–11). in a benchtop centrifuge at 500 × g for 5 min.
Resuspend cells at a density of 1.25 × 10⁶ cells/ml in chondrogenic differentiation medium.
Using a repeater pipette, dispense 0.2-ml aliquots of the cell suspension (2.5 × 10⁵ cells/well) into polypropylene 96-well plates.
Spin aliquots in a benchtop centrifuge at 500 × g for 5 min.
Place the multiwell plates in the incubator at 37°C in a humidified atmosphere of 95% air and 5% CO2 for up to 3 weeks.
Twenty four hours after centrifugation, ensure that the aggregates can float freely by releasing them from the bottom of the wells by aspirating 100 μl of media and gently releasing it back into the wells using an eight-channel pipette.
Change chondrogenic medium every other day. Carefully aspirate expired medium using a sterile 200-μl pipette tip affixed to a vacuum system.
Aliquot 0.2 ml of fresh chondrogenic medium to each well.
3.5. Analysis of Chondrogenic Differentiation
Under the described culture conditions, human MSCs undergo chondrogenic differentiation within 2–3 weeks, producing abundant extracellular matrix composed primarily of cartilage-specific molecules such as type II collagen and aggrecan. The expression of these cartilage markers can be used as evidence of the chondrogenic differentiation of MSCs.
3.5.1. Qualitative Assessment of Chondrogenic Differentiation
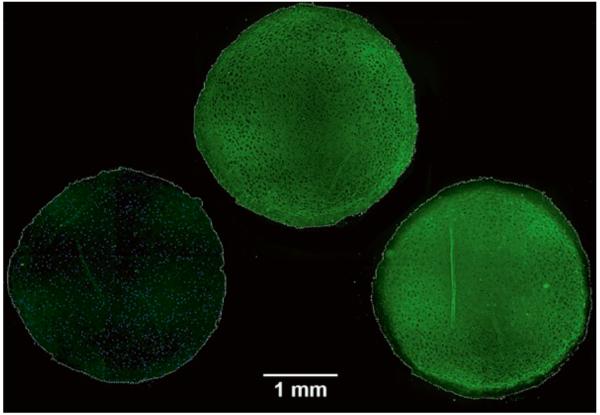
The initial cell aggregates contain type I collagen and no cartilage-specific molecules. Type II collagen is typically detected in the matrix by day 5. By day 14, type II and type X collagen are detected throughout the cell aggregates, except for an outer layer of flattened cells that remains rich in type I collagen. Aggrecan and link protein can also be detected in extracts of the aggregates (18, 19).
Chondrogenic differentiation can be assessed by toluidine blue staining of pellet sections, whereby cartilaginous extracellular matrix will stain purple (metachromasia) while undifferentiated or fibrous tissue will stain blue (see Fig. 9), or through the immunohistochemical staining for various types of Collagen (see Fig. 10). Typically, chondrogenic cultures are harvested at 1-week intervals and, in most cases, the experiments are terminated after 3 weeks. Frequency and timing of aggregate harvest are otherwise determined by the experimental objectives.
Fig. 9.
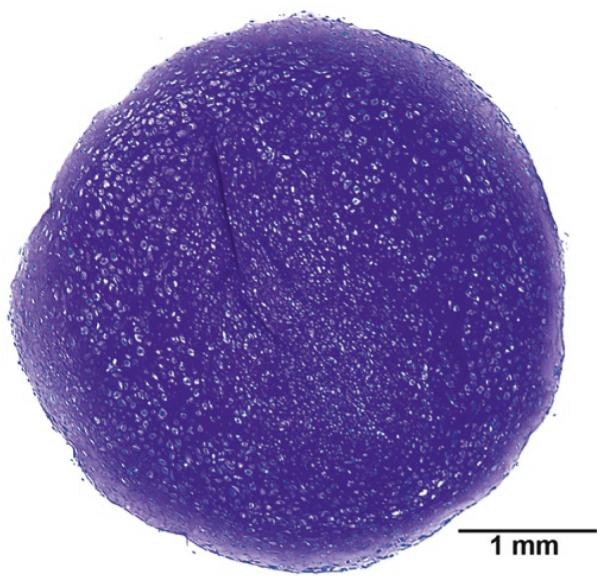
MSC aggregate after 3 weeks in chondrogenic conditions. Toluidine blue staining.
Fig. 10.
Immunohistochemical staining of serial sections of a 3-week aggregate. Type I collagen (left), type II collagen (middle), and type X collagen (right). Note the absence of type I collagen staining throughout the aggregate and the lack of type X staining in the periphery of the aggregate. The contours of the aggregates have been outlined to help identify areas of the aggregates devoid of specific types of collagen.
Harvest aggregates at predetermined time points.
Use a large orifice 200-μl pipette (Fisher) tip affixed to a micropipette to harvest the aggregates.
Transfer the aggregates to histology cassettes lined with biopsy sponges (three to four aggregates per cassette).
Fix the aggregates in 10% neutral-buffered formalin for 24 h (see Note 9).
Transfer the aggregates to 70% Ethanol in H2O.
Dehydrate in graded ethanol (Fisher) series (25, 50, 75, 90, 95 and 100%, 3 min each) followed by three clarification steps in xylene (Fisher) and paraffin-embed (Surgipath, Richmond, IL) following routine histological procedures.
Obtain adjacent 7 μm sections using a microtome, e.g., a Leica model 2250 (Deerfield, IL) or equivalent, and mount on StatLab HistoBond slides (McKinney, TX).
Deparaffinize the sections in three changes of xylene.
Rehydrate the sections using decreasing alcohol series (100, 100, 95, 95, 70, 50, and 25%, 3 min each), followed by a final rinse with deionized water for 5 min.
Stain with toluidine blue reagent for 1–2 min.
Rinse with tap water.
Dehydrate in graded ethanol series (25, 50, 75, 90, 95 and 100%, 3 min each) followed by three clarification steps in xylene and mount the slide in Permount® (Fisher).
Visualize using a microscope.
Additional chondrogenic differentiation sections can be further assessed by immunohistochemistry (see Fig. 10).
For many antibodies, epitope unmasking should be performed by digesting the rehydrated sections with pronase for 15 min.
Wash with PBS, 3 times for 5 min each.
Block with 10% normal serum (ideally from the species in which the secondary antibody was raised, usually goat) in PBS for 30 min.
Incubate with primary antibodies or control IgG in 1% normal serum in PBS for 1 h.
Wash with PBS, 3 times for 5 min each.
Incubate with secondary antibody diluted 1:50 (depending on brand, follow manufacturer’s instructions) in 1% normal serum in PBS for 45–60 min.
Wash with PBS, 3 times for 5 min each.
If desired, counterstain with 4′, 6-diamidino-2-phenylindole (DAPI, Sigma). Prepare fresh from 5 mg/ml stock by diluting 1:10,000 in water.
Wash with PBS, 3 times for 5 min each.
Apply a coverslip to the slide with a small drop of 5% N-propyl gallate (Sigma) in glycerol (Sigma).
Photograph the wet-mounts immediately (see Note 9).
3.5.2. Quantitative Assessment of Chondrogenic Differentiation
As described above, chondrogenic differentiation of hMSCs can be assessed by histology and immunohistochemistry. This type of assessment is, in most cases, very informative, but it is not quantitative. We have adapted previously published methodologies to quantitatively assess the success of the chondrogenic differentiation. To this end, we can determine cell numbers within the aggregates by measuring DNA content (80) and the extent of extracellular matrix accumulation by measuring the glycosaminoglycan (GAG) content (81) of the aggregates. Our modification (74) of these published assays allows us to measure both DNA and GAG content simultaneously in a single aggregate.
Harvest aggregates at predetermined time points.
Use a large orifice 200-μl pipette tip affixed to a micropipette to harvest the aggregates.
Transfer the aggregates to 1.5-ml microcentrifuge tubes (one aggregate per tube).
Carefully aspirate excess medium that may have been transferred with the aggregate.
Store harvested aggregates frozen at −80°C until ready for analysis.
Add 200-μl of papain buffer to each microcentrifuge tube.
Place the tubes in a 65°C water bath.
Check the aggregates every 30 min until the aggregates are no longer macroscopically visible.
Vortex briefly.
Add 400 μl of 0.1 N NaOH to each tube.
Incubate at room temperature for 20 min.
Neutralize with 400 μl of Neutralizing Solution.
Centrifuge for 5 min in a microcentrifuge.
Transfer supernatant to a clean tube. This lysate is used for both DNA and GAG measurements.
For DNA measurements, a fluorometric dye-binding assay such as that using Hoechst 33258, a bisbenzimide DNA intercalator, is convenient:
Transfer 100 μl of each standard to four replicate wells of a black, flat-bottom 96-well plate.
Transfer 100 μl of test lysate from each tube to four replicate wells of the 96-well plate.
Add 100 μl of Hoechst dye working solution (0.7 μg/ml Hoechst 33258 in water) to each well, mix gently.
Read the plate at an excitation wavelength of 340 nm and an emission wavelength of 465 nm.
For GAG measurements, we use a modified Safranin-O dye-binding assay:
Cut a piece of 0.45 μm nitrocellulose large enough to cover the necessary number of wells.
Moisten the nitrocellulose in distilled H2O.
Assemble the dot-blot apparatus following the manufacturer’s instructions and connect to a vacuum source (see Fig. 11).
Add 250 μl of Safranin O reagent to the wells of the dot-blot apparatus (see Note 11).
Add samples (25 μl) to Safranin O reagent already in the wells.
Let stand about 1 min to allow precipitation.
Cover unused wells.
Turn on vacuum to collect precipitates.
Rinse wells 2–3 times by filling with H2O and allowing it to filter through the membrane by applying vacuum.
Turn vacuum off.
Disassemble the dot-blot apparatus and remove the nitrocellulose membrane.
Air-dry the membrane briefly, do not over-dry as static charge makes the dots difficult to handle.
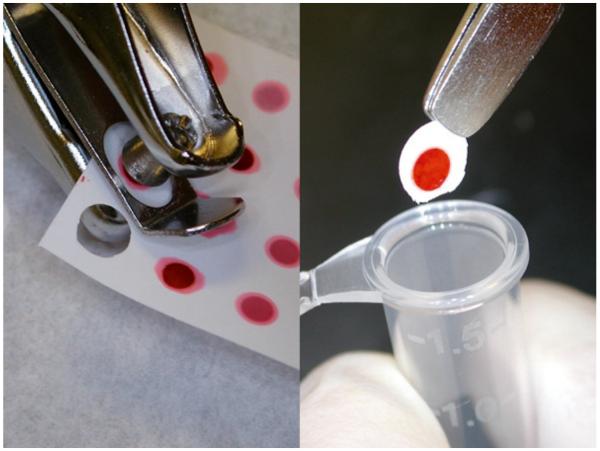
Punch out dots from nitrocellulose with a hole punch (see Fig. 12).
Transfer the dots to 1.5-ml microcentrifuge tubes.
Add 1 ml of 10% cetylpyridinium chloride (CPC) in H2O to elute the dye from the nitrocellulose dots.
Incubate at 37°C for 20 min; vortex after 10 min.
Read absorbance at 536 nm (see Note 13).
Fig. 11.
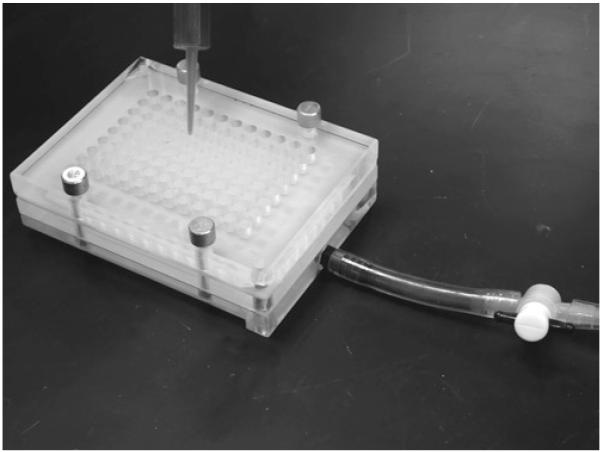
Assembled dot-blot apparatus.
Fig. 12.
Dots being punched from the membrane and transferred to the microcentrifuge tubes.
3.5.3. RNA Isolation
If desired, the chondrogenic process can be assessed at the gene expression level by harvesting total RNA from the aggregates. We found that the abundant negatively charged extracellular matrix in the pellets makes it almost impossible to obtain good RNA yields using affinity column-based kits and have obtained better results using TRIzol.
Harvest aggregates as described above.
Pool 12 aggregates into a 15-ml polypropylene conical tube.
Add 1.5 ml of TRIzol reagent.
Quick-freeze in liquid nitrogen or in a dry ice/ethanol bath.
Store at −80°C (at least overnight, can keep longer).
Thaw samples on ice.
Incubate for 5 min at room temperature.
Store at −80°C (at least overnight, can keep longer).
Thaw samples in ice.
Add 500 μl of chloroform.
Incubate for 3–5 min at room temperature.
Centrifuge for 15 min at 4°C (12,000 × g).
Aspirate the aqueous (top) layer and transfer it to a clean tube.
Add 1,250 μl of isopropanol.
Mix well and incubate at room temperature for 10 min.
Freeze at −80°C (at least overnight, can keep longer).
Thaw samples.
Centrifuge for 10 min at 4°C (12,000 × g).
Carefully discard supernatant.
Add 1.5 ml of 70% ethanol.
Vortex.
Centrifuge for 5 min at 4°C (7,500 × g).
Add 1.5 ml of 70% ethanol.
Vortex.
Centrifuge for 5 min at 4°C (7,500 × g).
Air-dry the pellet.
Resuspend in nuclease-free (or DEPC-treated) water.
Fig. 13.
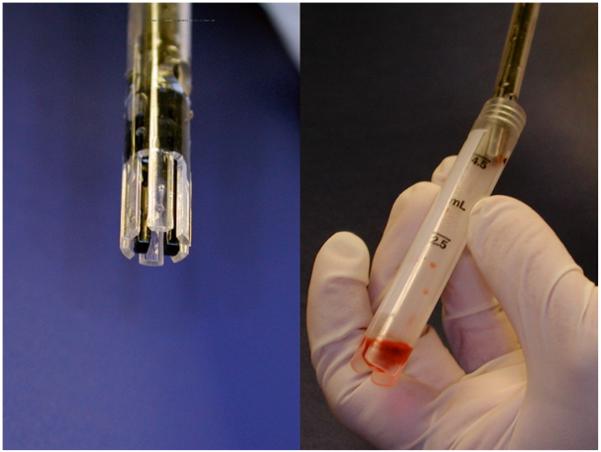
Homogenizer tip and 4-ml cryovial used for the RNA isolation.
Acknowledgments
This work was supported by grants from the Arthritis Foundation (PIs Jean F. Welter and Luis A. Solchaga), the Ohio Department of Development (PI Luis A. Solchaga), NIH; R01 AR050208 (PI Jean F. Welter) and P01 AR053622 (PIs Jean F. Welter and Luis A. Solchaga); and the Hematopoietic Stem Cell Core Facility of the Case Comprehensive Cancer Center (P30 CA43703; PI Stanton L. Gerson). The authors also want to thank Ms. Harris who processes the majority of the bone marrow specimens used in the laboratory.
4. Notes
The Percoll solution can be prepared in any convenient multiples of these volumes and should be mixed thoroughly.
All solutions and plasticware which will come in contact with cells should be sterile. Waste should be treated as biohazardous, and universal precautions should be applied.
The bone marrow sample, and all cells derived from it, is treated with universal biohazard precautions. Appropriate waste containers for all sharp and nonsharp disposable supplies that come into contact with human tissue, cells, or medium that has contacted these cells must be used.
The marrow sample is processed in a Class II biological safety cabinet. Personnel processing these samples must wear proper personal protective equipment, including a lab coat, goggles or a face shield, gloves, and a surgical mask.
FGF-2 acts as a scattering factor on hMSCs. Primary cultures exposed to FGF-2 present colonies less tightly packed that control cultures with many more cells dispersed in between the colonies (see Fig. 6).
When subculturing hMSCs, the following considerations must be taken into account: Subcultured hMSCs are evenly distributed on the tissue culture vessel surface and are not in colonies as for primary cultures. Therefore, the degree of confluence determines when the cells should be trypsinized. As a general rule, hMSCs should be trypsinized before they become confluent. Passaged hMSCs are more easily trypsinized than primary cultures, so exposure of these cells to trypsin is usually limited to 5 min. It is not necessary (nor desirable) to remove all of the adherent cells from the dish as most of the nonfibroblastoid cells (which are not likely to be MSCs) in these cultures are more trypsin-resistant than the spindle-shaped fibroblast-like cells. Thus, trypsinization represents, after attachment of fibroblastic cells to plastic, the second component of the process of selection of MSCs from the total marrow cell population. Passaged hMSCs are slightly larger than primary cells, a feature that becomes more pronounced with additional subcultivation.
Gibco freezing medium works well or 15% HPLC-grade DMSO with 85% FBS. DMSO dilution is exothermic, so if making your own freezing medium, take this into account and allow freshly made freezing medium to chill before adding it to the cells.
Complete fixation of the aggregates is important. Allow at least 24 h. Wet-mount immunofluorescent sections should be documented photographically as soon as possible, preferably the same day. Stained sections can be retained for a few days at 4°C. Stability can be improved by ringing the coverslips with collodion or nail polish.
Fluorescently labeled antibodies fade overtime and diffuse away, therefore it is important to document the sections as soon as possible (ideally within 24 h).
A new batch of calf thymus DNA should be checked against the old one prior to use as there appears to be lot-to-lot and vendor-to-vendor variations. The calculation of DNA content in the lysates of the aggregates can be easily performed in Excel (Microsoft). Absorbance data are converted to DNA concentration using the following spreadsheet formula: =((FORECAST(C1,$A$1:$A$4,$B$1:$B$4))*2)/1,000; where C1 is the relative reference to the cell containing the absorbance value for a given replicate of a given extract, $A$1:$A$4 is the absolute reference to the range containing the DNA concentration of the standards, and $B$1:$B$4 is the absolute reference to the range containing the mean absorbance for the replicates of each standards. The “2” multiplier is to account for the dilution of the extract with the Dye solution and the “1,000” denominator is to convert ng/ml to μg/ml. Because the final volume of the lysate is 1 ml, the concentrations can be directly converted to total DNA amounts.
Because the reagent slowly flows through the nitrocellulose, wells should be filled only five at a time to avoid having too much reagent flow out of the wells by the time the sample is added.
The calculations of GAG content in the lysates of the aggregates can be easily performed in excel (Microsoft). Absorbance data are converted to GAG amounts using the following spread-sheet formula: =FORECAST(C1,$A$1:$A$5,$B$1:$B$5)* 40; where C1 is the relative reference to the cell containing the absorbance value for a given replicate of a given extract, $A$1:$A$5 is the absolute reference to the range containing the GAG content of the standards, and $B$1:$B$5 is the absolute reference to the range containing the mean absorbance for the replicates of each standards. The “40” multiplier is to account for the total volume of the extract; remember that only 25 μl of the 1 ml of extract are loaded into the dot-blot apparatus.
If using a 96-well plate reader, transfer the eluates to replicate wells of a 96-well plate for analysis; otherwise use disposable plastic cuvettes.
Aggregates, particularly those at later time points, do not dissolve in TRIzol by themselves. We use a handheld Omni TH homogenizer (OMNI international, Marietta, GA) with hard tissue-homogenizer tips. The homogenization is performed in the 4-ml tubes to avoid splashing and loss of sample, and it is performed until remnants of the aggregates cannot be visually identified (see Fig. 11).
References
- 1.Minguell JJ, Erices A, Conget P. Mesenchymal stem cells. Exp Biol Med (Maywood) 2001;226(6):507–20. doi: 10.1177/153537020122600603. [DOI] [PubMed] [Google Scholar]
- 2.Friedenstein AJ. Precursor cells of mechanocytes. Int Rev Cytol. 1976;47:327–59. doi: 10.1016/s0074-7696(08)60092-3. [DOI] [PubMed] [Google Scholar]
- 3.Owen M. Marrow stromal stem cells. J Cell Sci Suppl. 1988;10:63–76. doi: 10.1242/jcs.1988.supplement_10.5. [DOI] [PubMed] [Google Scholar]
- 4.Owen M, Friedenstein AJ. Stromal stem cells: marrow-derived osteogenic precursors. Ciba Found Symp. 1988;136:42–60. doi: 10.1002/9780470513637.ch4. [DOI] [PubMed] [Google Scholar]
- 5.Caplan AI. The mesengenic process. Clin Plast Surg. 1994;21(3):429–35. [PubMed] [Google Scholar]
- 6.Ohgushi H, Goldberg VM, Caplan AI. Heterotopic osteogenesis in porous ceramics induced by marrow cells. J Orthop Res. 1989;7(4):568–78. doi: 10.1002/jor.1100070415. [DOI] [PubMed] [Google Scholar]
- 7.Ohgushi H, Okumura M. Osteogenic capacity of rat and human marrow cells in porous ceramics. Experiments in athymic (nude) mice. Acta Orthop Scand. 1990;61(5):431–4. doi: 10.3109/17453679008993556. [DOI] [PubMed] [Google Scholar]
- 8.Ohgushi H, Okumura M, Tamai S, Shors EC, Caplan AI. Marrow cell induced osteogenesis in porous hydroxyapatite and tricalcium phosphate: a comparative histomorphometric study of ectopic bone formation. J Biomed Mater Res. 1990;24(12):1563–70. doi: 10.1002/jbm.820241202. [DOI] [PubMed] [Google Scholar]
- 9.Goshima J, Goldberg VM, Caplan AI. The osteogenic potential of culture-expanded rat marrow mesenchymal cells assayed in vivo in calcium phosphate ceramic blocks. Clin Orthop Relat Res. 1991;(262):298–311. [PubMed] [Google Scholar]
- 10.Goshima J, Goldberg VM, Caplan AI. Osteogenic potential of culture-expanded rat marrow cells as assayed in vivo with porous calcium phosphate ceramic. Biomaterials. 1991;12(2):253–8. doi: 10.1016/0142-9612(91)90209-s. [DOI] [PubMed] [Google Scholar]
- 11.Haynesworth SE, Goshima J, Goldberg VM, Caplan AI. Characterization of cells with osteogenic potential from human bone marrow. Bone. 1992;13:81–8. doi: 10.1016/8756-3282(92)90364-3. [DOI] [PubMed] [Google Scholar]
- 12.Lennon DP, Haynesworth SE, Bruder SP, Jaiswal N, Caplan AI. Human and animal mesenchymal progenitor cells from bone marrow: Identification of serum for optimal selection and proliferation. In Vitro Cell Dev Biol. 1996;32(10):602–11. [Google Scholar]
- 13.Bruder SP, Jaiswal N, Haynesworth SE. Growth kinetics, self-renewal, and the osteogenic potential of purified human mesenchymal stem cells during extensive subcultivation and following cryopreservation. J Cell Biochem. 1997;64(2):278–94. doi: 10.1002/(sici)1097-4644(199702)64:2<278::aid-jcb11>3.0.co;2-f. [DOI] [PubMed] [Google Scholar]
- 14.Digirolamo CM, Stokes D, Colter D, Phinney DG, Class R, Prockop DJ. Propagation and senescence of human marrow stromal cells in culture: a simple colony-forming assay identifies samples with the greatest potential to propagate and differentiate. Br J Haematol. 1999;107(2):275–81. doi: 10.1046/j.1365-2141.1999.01715.x. [DOI] [PubMed] [Google Scholar]
- 15.Phinney DG, Kopen G, Righter W, Webster S, Tremain N, Prockop DJ. Donor variation in the growth properties and osteogenic potential of human marrow stromal cells. J Cell Biochem. 1999;75(3):424–36. [PubMed] [Google Scholar]
- 16.Pittenger MF, Mackay AM, Beck SC, Jaiswal RK, Douglas R, Mosca JD, et al. Multilineage potential of adult human mesenchymal stem cells. Science. 1999;284(5411):143–7. doi: 10.1126/science.284.5411.143. [DOI] [PubMed] [Google Scholar]
- 17.Jaiswal N, Haynesworth SE, Caplan AI, Bruder SP. Osteogenic differentiation of purified culture-expanded human mesenchymal stem cells in vitro. J Cell Biochem. 1997;64:295–312. [PubMed] [Google Scholar]
- 18.Johnstone B, Hering TM, Caplan AI, Goldberg VM, Yoo JU. In vitro chondrogenesis of bone marrow-derived mesenchymal progenitor cells. Exp Cell Res. 1998;238(1):265–72. doi: 10.1006/excr.1997.3858. [DOI] [PubMed] [Google Scholar]
- 19.Yoo JU, Barthel TS, Nishimura K, Solchaga L, Caplan AI, Goldberg VM, et al. The chondrogenic potential of human bone-marrow-derived mesenchymal progenitor cells. J Bone Joint Surg Am. 1998;80(12):1745–57. doi: 10.2106/00004623-199812000-00004. [DOI] [PubMed] [Google Scholar]
- 20.Lee SH, Lumelsky N, Studer L, Auerbach JM, McKay RD. Efficient generation of midbrain and hindbrain neurons from mouse embryonic stem cells. Nat Biotechnol. 2000;18(6):675–9. doi: 10.1038/76536. [DOI] [PubMed] [Google Scholar]
- 21.Mackay AM, Beck SC, Murphy JM, Barry FP, Chichester CO, Pittenger MF. Chondrogenic differentiation of cultured human mesenchymal stem cells from marrow. Tissue Eng. 1998;4(4):415–28. doi: 10.1089/ten.1998.4.415. [DOI] [PubMed] [Google Scholar]
- 22.Pittenger MF, Mbalaviele G, Black M, Mosca JD, Marshak DR. Mesenchymal stem cells. In: Koller MR, Palsson BO, Masters JRW, editors. Primary mesenchymal cells. Kluwer Academic Publishers; Dordrech: 2001. pp. 189–207. [Google Scholar]
- 23.Banfi A, Bianchi G, Notaro R, Luzzatto L, Cancedda R, Quarto R. Replicative aging and gene expression in long-term cultures of human bone marrow stromal cells. Tissue Eng. 2002;8(6):901–10. doi: 10.1089/107632702320934001. [DOI] [PubMed] [Google Scholar]
- 24.Langer R, Vacanti JP. Tissue engineering. Science. 1993;260(5110):920–6. doi: 10.1126/science.8493529. [DOI] [PubMed] [Google Scholar]
- 25.Vacanti CA, Vacanti JP. The science of tissue engineering. Orthop Clin North Am. 2000;31(3):351–6. doi: 10.1016/s0030-5898(05)70155-3. [DOI] [PubMed] [Google Scholar]
- 26.Vacanti J, Langer R. Tissue engineering: the design and fabrication of living replacement devices for surgical re-construction and transplantation. Lancet. 1999;354(Suppl. 1):SI32–SI4. doi: 10.1016/s0140-6736(99)90247-7. [DOI] [PubMed] [Google Scholar]
- 27.Bonassar LJ, Vacanti CA. Tissue engineering: the first decade and beyond. J Cell Biochem Suppl. 1998;30:31–297. [PubMed] [Google Scholar]
- 28.Pearson RG, Bhandari R, Quirk RA, Shakesheff KM. Recent advances in tissue engineering: an invited review. J Long Term Eff Med Implants. 2002;12(1):1–33. [PubMed] [Google Scholar]
- 29.Temenoff JS, Mikos AG. Review: tissue engineering for regeneration of articular cartilage. Biomaterials. 2000;21(5):431–40. doi: 10.1016/s0142-9612(99)00213-6. [DOI] [PubMed] [Google Scholar]
- 30.O’Driscoll SW. Preclinical cartilage repair: current status and future perspectives. Clin Orthop. 2001;(391 Suppl):S397–401. [PubMed] [Google Scholar]
- 31.Luyten FP, Dell’Accio F, De Bari C. Skeletal tissue engineering: opportunities and challenges. Best Pract Res Clin Rheumatol. 2001;15(5):759–69. doi: 10.1053/berh.2001.0192. [DOI] [PubMed] [Google Scholar]
- 32.Musgrave DS, Fu FH, Huard J. Gene therapy and tissue engineering in orthopaedic surgery. J Am Acad Orthop Surg. 2002;10(1):6–15. doi: 10.5435/00124635-200201000-00003. [DOI] [PubMed] [Google Scholar]
- 33.Risbud M. Tissue engineering: implications in the treatment of organ and tissue defects. Biogerontology. 2001;2(2):117–25. doi: 10.1023/a:1011585117310. [DOI] [PubMed] [Google Scholar]
- 34.Guilak F, Butler DL, Goldstein SA. Functional tissue engineering: the role of biomechanics in articular cartilage repair. Clin Orthop. 2001;(391 Suppl):S295–305. [PubMed] [Google Scholar]
- 35.Risbud MV, Sittinger M. Tissue engineering: advances in in vitro cartilage generation. Trends Biotechnol. 2002;20(8):351–6. doi: 10.1016/s0167-7799(02)02016-4. [DOI] [PubMed] [Google Scholar]
- 36.Caplan AI, Goldberg VM. Principles of tissue engineered regeneration of skeletal tissues. Clin Orthop Relat Res. 1999;(367 Suppl):S12–6. doi: 10.1097/00003086-199910001-00003. [DOI] [PubMed] [Google Scholar]
- 37.Caplan AI, Elyaderani M, Mochizuki Y, Wakitani S, Goldberg VM. Principles of cartilage repair and regeneration. Clin Orthop Relat Res. 1997;342:254–69. [PubMed] [Google Scholar]
- 38.Hunter W. Of the structure and diseases of articulating cartilages. Philos Trans. 1743;42:514–21. [PubMed] [Google Scholar]
- 39.Buckwalter J. Articular cartilage: injuries and potential for healing. J Orthop Sports Phys Ther. 1998;28:192–202. doi: 10.2519/jospt.1998.28.4.192. [DOI] [PubMed] [Google Scholar]
- 40.Buckwalter JA, Mankin HJ. Articular cartilage repair and transplantation. Arthritis Rheum. 1998;41(8):1331–42. doi: 10.1002/1529-0131(199808)41:8<1331::AID-ART2>3.0.CO;2-J. [DOI] [PubMed] [Google Scholar]
- 41.Buckwalter JA, Mankin HJ. Articular cartilage: degeneration and osteoarthritis, repair, regeneration, and transplantation. Instr Course Lect. 1998;47:487–504. [PubMed] [Google Scholar]
- 42.Mankin HJ. The reaction of articular cartilage to injury and osteoarthritis (first of two parts) N Engl J Med. 1974;291(24):1285–92. doi: 10.1056/NEJM197412122912406. [DOI] [PubMed] [Google Scholar]
- 43.Mankin HJ. The reaction of articular cartilage to injury and osteoarthritis (second of two parts) N Engl J Med. 1974;291(25):1335–40. doi: 10.1056/NEJM197412192912507. [DOI] [PubMed] [Google Scholar]
- 44.Mankin HJ, Buckwalter JA. Restoration of the osteoarthrotic joint [editorial] J Bone Joint Surg Am. 1996;78(1):1–2. doi: 10.2106/00004623-199601000-00001. [DOI] [PubMed] [Google Scholar]
- 45.Chesterman PJ, Smith AU. Homotrans-plantation of articular cartilage and isolated chondrocytes. An experimental study in rabbits. J Bone Joint Surg Br. 1968;50(1):184–97. [PubMed] [Google Scholar]
- 46.Bentley G, Greer RB., 3rd Homotransplantation of isolated epiphyseal and articular cartilage chondrocytes into joint surfaces of rabbits. Nature. 1971;230(5293):385–8. doi: 10.1038/230385a0. [DOI] [PubMed] [Google Scholar]
- 47.Wakitani S, Kimura T, Hirooka A, Ochi T, Yoneda M, Yasui N, et al. Repair of rabbit articular surfaces with allograft chondrocytes embedded in collagen gel. J Bone Joint Surg Br. 1989;71(1):74–80. doi: 10.1302/0301-620X.71B1.2915011. [DOI] [PubMed] [Google Scholar]
- 48.Vacanti CA, Kim W, Schloo B, Upton J, Vacanti JP. Joint resurfacing with cartilage grown in situ from cell-polymer structures. Am J Sports Med. 1994;22(4):485–8. doi: 10.1177/036354659402200408. [DOI] [PubMed] [Google Scholar]
- 49.Freed LE, Grande DA, Lingbin Z, Emmanual J, Marquis JC, Langer R. Joint resurfacing using allograft chondrocytes and synthetic biodegradable polymer scaffolds. J Biomed Mater Res. 1994;28(8):891–9. doi: 10.1002/jbm.820280808. [DOI] [PubMed] [Google Scholar]
- 50.Frenkel SR, Toolan B, Menche D, Pitman MI, Pachence JM. Chondrocyte transplantation using a collagen bilayer matrix for cartilage repair. J Bone Joint Surg Br. 1997;79(5):831–6. doi: 10.1302/0301-620x.79b5.7278. [DOI] [PubMed] [Google Scholar]
- 51.Nehrer S, Breinan HA, Ramappa A, Shortkroff S, Young G, Minas T, et al. Canine chondrocytes seeded in type I and type II collagen implants investigated in vitro. J Biomed Mater Res. 1997;38(2):95–104. doi: 10.1002/(sici)1097-4636(199722)38:2<95::aid-jbm3>3.0.co;2-b. [DOI] [PubMed] [Google Scholar]
- 52.Breinan HA, Minas T, Hsu HP, Nehrer S, Sledge CB, Spector M. Effect of cultured autologous chondrocytes on repair of chondral defects in a canine model. J Bone Joint Surg Am. 1997;79(10):1439–51. doi: 10.2106/00004623-199710000-00001. [DOI] [PubMed] [Google Scholar]
- 53.Minas T. Chondrocyte implantation in the repair of chondral lesions of the knee: economics and quality of life. Am J Orthop. 1998;27(11):739–44. [PubMed] [Google Scholar]
- 54.Giannini S, Buda R, Grigolo B, Vannini F. Autologous chondrocyte transplantation in osteochondral lesions of the ankle joint. Foot Ankle Int. 2001;22(6):513–7. doi: 10.1177/107110070102200612. [DOI] [PubMed] [Google Scholar]
- 55.Breinan HA, Minas T, Hsu HP, Nehrer S, Shortkroff S, Spector M. Autologous chondrocyte implantation in a canine model: change in composition of reparative tissue with time. J Orthop Res. 2001;19(3):482–92. doi: 10.1016/S0736-0266(00)90015-9. [DOI] [PubMed] [Google Scholar]
- 56.Brittberg M, Lindahl A, Nilsson A, Ohlsson C, Isaksson O, Peterson L. Treatment of deep cartilage defects in the knee with autologous chondrocyte transplantation. N Engl J Med. 1994;331(14):889–95. doi: 10.1056/NEJM199410063311401. [see comments] [DOI] [PubMed] [Google Scholar]
- 57.Amiel D, Coutts RD, Abel M, Stewart W, Harwood F, Akeson WH. Rib perichondrial grafts for the repair of full-thickness articular-cartilage defects. A morphological and biochemical study in rabbits. J Bone Joint Surg Am. 1985;67(6):911–20. [PubMed] [Google Scholar]
- 58.O’Driscoll SW, Keeley FW, Salter RB. The chondrogenic potential of free autogenous periosteal grafts for biological resurfacing of major full-thickness defects in joint surfaces under the influence of continuous passive motion. An experimental investigation in the rabbit. J Bone Joint Surg Am. 1986;68(7):1017–35. [PubMed] [Google Scholar]
- 59.Amiel D, Coutts RD, Harwood FL, Ishizue KK, Kleiner JB. The chondrogenesis of rib perichondrial grafts for repair of full thickness articular cartilage defects in a rabbit model: a one year postoperative assessment. Connect Tissue Res. 1988;18(1):27–39. doi: 10.3109/03008208809019070. [DOI] [PubMed] [Google Scholar]
- 60.Shahgaldi BF, Amis AA, Heatley FW, McDowell J, Bentley G. Repair of cartilage lesions using biological implants. A comparative histological and biomechanical study in goats. Journal of Bone & Joint Surgery - British Volume. 1991;73(1):57–64. doi: 10.1302/0301-620X.73B1.1991776. [DOI] [PubMed] [Google Scholar]
- 61.Wakitani S, Goto T, Pineda SJ, Young RG, Mansour JM, Caplan AI, et al. Mesenchymal cell-based repair of large, full-thickness defects of articular cartilage. J Bone Joint Surg Am. 1994;76(4):579–92. doi: 10.2106/00004623-199404000-00013. [DOI] [PubMed] [Google Scholar]
- 62.Chu CR, Coutts RD, Yoshioka M, Harwood FL, Monosov AZ, Amiel D. Articular cartilage repair using allogeneic perichondrocyte-seeded biodegradable porous polylactic acid (PLA): a tissue-engineering study. J Biomed Mater Res. 1995;29(9):1147–54. doi: 10.1002/jbm.820290915. [DOI] [PubMed] [Google Scholar]
- 63.Butnariu-Ephrat M, Robinson D, Mendes DG, Halperin N, Nevo Z. Resurfacing of goat articular cartilage by chondrocytes derived from bone marrow. Clin Orthop Relat Res. 1996;330:234–43. doi: 10.1097/00003086-199609000-00031. [DOI] [PubMed] [Google Scholar]
- 64.Hunziker EB, Rosenberg LC. Repair of partial-thickness defects in articular cartilage: cell recruitment from the synovial membrane. J Bone Joint Surg Am. 1996;78(5):721–33. doi: 10.2106/00004623-199605000-00012. [DOI] [PubMed] [Google Scholar]
- 65.Chu CR, Dounchis JS, Yoshioka M, Sah RL, Coutts RD, Amiel D. Osteochondral repair using perichondrial cells. A 1-year study in rabbits. Clin Orthop Relat Res. 1997;(340):220–9. doi: 10.1097/00003086-199707000-00029. [DOI] [PubMed] [Google Scholar]
- 66.Goldberg VM, Caplan AI. Biologic restoration of articular surfaces. Inst Course Lect. 1999;48:623–7. [PubMed] [Google Scholar]
- 67.Johnstone B, Yoo JU. Autologous mesenchymal progenitor cells in articular cartilage repair. Clin Orthop Relat Res. 1999;(367 Suppl):S156–62. doi: 10.1097/00003086-199910001-00017. [DOI] [PubMed] [Google Scholar]
- 68.Dounchis JS, Bae WC, Chen AC, Sah RL, Coutts RD, Amiel D. Cartilage repair with autogenic perichondrium cell and polylactic acid grafts. Clin Orthop Relat Res. 2000;(377):248–64. doi: 10.1097/00003086-200008000-00033. [DOI] [PubMed] [Google Scholar]
- 69.Solchaga LA, Gao J, Dennis JE, Awadallah A, Lundberg M, Caplan AI, et al. Treatment of osteochondral defects with autologous bone marrow in a hyaluronan-based delivery vehicle. Tissue Eng. 2002;8(2):333–47. doi: 10.1089/107632702753725085. [DOI] [PubMed] [Google Scholar]
- 70.Caplan AI. Mesenchymal stem cells. J Orthop Res. 1991;9(5):641–50. doi: 10.1002/jor.1100090504. [DOI] [PubMed] [Google Scholar]
- 71.Ashton BA, Allen TD, Howlett CR, Eaglesom CC, Hattori A, Owen M. Formation of bone and cartilage by marrow stromal cells in diffusion chambers in vivo. Clin Orthop. 1980;(151):294–307. [PubMed] [Google Scholar]
- 72.Angele P, Smith C, Mansour J, Jepsen K, Johnstone B, Yoo J. Effects of cyclic hydrostatic pressure on the chondrogenic differentiation of mesenchymal progenitor cells. Trans Orthop Res Soc. 2000;25(2):645. doi: 10.1016/S0736-0266(02)00230-9. [DOI] [PubMed] [Google Scholar]
- 73.Hanada K, Solchaga LA, Caplan AI, Hering TM, Goldberg VM, Yoo JU, et al. BMP-2 induction and TGF-beta 1 modulation of rat periosteal cell chondrogenesis. J Cell Biochem. 2001;81(2):284–94. doi: 10.1002/1097-4644(20010501)81:2<284::aid-jcb1043>3.0.co;2-d. [DOI] [PubMed] [Google Scholar]
- 74.Solchaga LA, Penick K, Porter JD, Goldberg VM, Caplan AI, Welter JF. FGF-2 enhances the mitotic and chondrogenic potentials of human adult bone marrow-derived mesenchymal stem cells. J Cell Physiol. 2005;203(2):398–409. doi: 10.1002/jcp.20238. [DOI] [PubMed] [Google Scholar]
- 75.Bianchi G, Banfi A, Mastrogiacomo M, Notaro R, Luzzatto L, Cancedda R, et al. Ex vivo enrichment of mesenchymal cell progenitors by fibroblast growth factor 2. Exp Cell Res. 2003;287(1):98–105. doi: 10.1016/s0014-4827(03)00138-1. [DOI] [PubMed] [Google Scholar]
- 76.Martin I, Muraglia A, Campanile G, Cancedda R, Quarto R. Fibroblast growth factor-2 supports ex vivo expansion and maintenance of osteogenic precursors from human bone marrow. Endocrinology. 1997;138(10):4456–62. doi: 10.1210/endo.138.10.5425. [DOI] [PubMed] [Google Scholar]
- 77.Tsutsumi S, Shimazu A, Miyazaki K, Pan H, Koike C, Yoshida E, et al. Retention of multilineage differentiation potential of mesenchymal cells during proliferation in response to FGF. Biochem Biophys Res Commun. 2001;288(2):413–9. doi: 10.1006/bbrc.2001.5777. [DOI] [PubMed] [Google Scholar]
- 78.Ballock RT, Reddi AH. Thyroxine is the serum factor that regulates morphogenesis of columnar cartilage from isolated chondrocytes in chemically defined medium. J Cell Biol. 1994;126(5):1311–8. doi: 10.1083/jcb.126.5.1311. [DOI] [PMC free article] [PubMed] [Google Scholar]
- 79.Penick KJ, Solchaga LA, Welter JF. High-throughput aggregate culture system to assess the chondrogenic potential of mesenchymal stem cells. Biotechniques. 2005;39(5):687–91. doi: 10.2144/000112009. [DOI] [PMC free article] [PubMed] [Google Scholar]
- 80.Ponticiello MS, Schinagl RM, Kadiyala S, Barry FP. Gelatin-based resorbable sponge as a carrier matrix for human mesenchymal stem cells in cartilage regeneration therapy. J Biomed Mater Res. 2000;52(2):246–55. doi: 10.1002/1097-4636(200011)52:2<246::aid-jbm2>3.0.co;2-w. [DOI] [PubMed] [Google Scholar]
- 81.Carrino DA, Arias JL, Caplan AI. A spectrophotometric modification of a sensitive densitometric Safranin O assay for glycosaminoglycans. Biochem Int. 1991;24(3):485–95. [PubMed] [Google Scholar]


