

Abstract
As DNA sequencing is performed more and more in a mass-production-like manner, efficient quality control measures become increasingly important for process control, but so also does the ability to compare different methods and projects. One of the fundamental quality measures in sequencing projects is the position-specific error probability at all bases in each individual sequence. Accurate prediction of base-specific error rates from “raw” sequence data would allow immediate quality control as well as benchmarking different methods and projects while avoiding the inefficiencies and time delays associated with resequencing and assessments after “finishing” a sequence. The program PHRED provides base-specific quality scores that are logarythmically related to error probabilities. This study assessed the accuracy of PHRED’s error-rate prediction by analyzing sequencing projects from six different large-scale sequencing laboratories. All projects used four-color fluorescent sequencing, but the sequencing methods used varied widely between the different projects. The results indicate that the error-rate predictions such as those given by PHRED can be highly accurate for a large variety of different sequencing methods as well as over a wide range of sequence quality.
In DNA sequencing, knowledge about the accuracy of sequences can be very valuable. For example, different large-scale sequencing projects may produce sequences at similar rates and costs but with significantly different error rates in the final sequence. One major determinant in the final error rate is the accuracy of the “raw” sequence. Knowledge about the frequency and location of errors in the raw sequence data can help to direct “polishing” efforts to the places where additional effort is needed; it also enables the comparison between different sequencing projects without requiring that the same region be sequenced in each project.
Another area where estimates about sequence error rates would be beneficial is technology development. Accurate error estimates at each base would enable “quality benchmarking” between different methods, thus enabling researchers to choose the method that fills their needs for accuracy and throughput best.
Several groups have developed mathematical models to predict the error probability at any given position in raw sequences. Lawrence and Solovyev used linear discriminant analysis to calculate separate probability estimates for insertions, deletions, and mismatches (Lawrence and Solovyev 1994). Ewing and Green (1998) developed the program PHRED, which calculates a quality score at each base. This quality score q is logarithmically linked to the error probability p: q = −10 × log10 (p) (for a discussion of how quality scores are calculated and what the limitations are, see Ewing et al. (1998). When used in combination with sequence assembly and finishing programs that utilize these error estimates, reliable error probabilities promise to increase the accuracy of consensus sequences and to reduce the efforts required in the finishing phase of sequencing projects (Churchill and Waterman 1992; Bonfield and Staden 1995).
To examine the accuracy of probability estimates made by the program PHRED, we compared the actual and predicted error rates for six different cosmid- or BAC-sized projects that were produced by six different large-scale sequencing centers in the United States. All of these six projects used four-color fluorescent sequencing machines; however, the DNA preparation methods, sequencing enzymes, fluorescent dyes and chemistries, and gel lengths varied significantly between the six groups. Table 1 gives an overview of the sequencing projects analyzed. Table 2 lists the different methods used.
Table 1.
Summary of Data Sets
| Project | Reads | Aligned bases | Average aligned read length |
|---|---|---|---|
| A | 455 | 416,214 | 915 |
| B | 1277 | 871,230 | 682 |
| C | 1065 | 603,655 | 567 |
| D | 834 | 414,595 | 497 |
| E | 1638 | 1,149,209 | 702 |
| F | 1885 | 907,796 | 482 |
| Total | 7154 | 4,362,699 | 610 |
Table 2.
Overview of Sequencing Methods Used in the Different Projects
| Template DNA | single-stranded M13, double-stranded plasmids |
| Sequencing enzymes | Sequenase, Taq, KlenTaqTR, AmpliTaq FS |
| Sequencing chemistries | Dyes primer (two different dyes chemistries), dye terminator |
| Sequencing machines | ABI 373, ABI 373 stretch, ABI 377 |
| Gel length | Only short gels, only long gels, mixes of short and long gels |
RESULTS
Error Rate Prediction Accuracy for Six Projects
A comparison of actual and predicted error rates for the six projects in this study is shown in Table 3. The results indicate that PHRED is very successful in identifying bases with low error probabilities. For example, the 1.28 million bases with quality scores of 4–12 (corresponding to error probabilities between 39.8% and 6.3%) contain a total of 187,926 errors. In contrast, the 1.44 million bases with quality scores between 33 and 42 (corresponding to error probabilities between 0.05% and 0.006%) contain only 237 errors, which translates into a 790-fold lower error rate. The trend toward lower error rates can also be observed for each individual project. In most cases, the actual number of errors is close to the predicted error rate. It is also apparent that the actual error rate is typically lower than the predicted error rate.
Table 3.
Comparison of Predicted and Actual Error Rates for Six Different Sequencing Projects
| Project | Quality score | 4–12 | 13–22 | 23–32 | 33–42 | 43–51 |
|---|---|---|---|---|---|---|
| A | aligned bases | 119,246 | 75,293 | 70,391 | 144,876 | 73,234 |
| expected errors | 20,256 | 2,064 | 172 | 37 | 1 | |
| actual errors | 16,784 | 1,758 | 127 | 17 | 1 | |
| B | aligned bases | 182,034 | 137,940 | 181,998 | 399,690 | 140,176 |
| expected errors | 29,953 | 3,704 | 410 | 102 | 3 | |
| actual errors | 26,038 | 2,536 | 287 | 35 | 0 | |
| C | aligned bases | 139,345 | 131,419 | 151,197 | 292,070 | 68,529 |
| expected errors | 22,277 | 3,411 | 357 | 74 | 2 | |
| actual errors | 16,670 | 1,513 | 194 | 26 | 3 | |
| D | aligned bases | 103,898 | 68,995 | 68,613 | 153,730 | 111,752 |
| expected errors | 16,880 | 1,919 | 168 | 38 | 3 | |
| actual errors | 14,495 | 1,924 | 146 | 59 | 2 | |
| E | aligned bases | 378,755 | 217,438 | 167,968 | 392,717 | 144,313 |
| expected errors | 63,947 | 6,336 | 418 | 95 | 4 | |
| actual errors | 55,968 | 6,516 | 355 | 67 | 5 | |
| F | aligned bases | 359,809 | 136,688 | 98,840 | 64,035 | 5,130 |
| expected errors | 66,938 | 4,079 | 256 | 23 | 0 | |
| actual errors | 57,971 | 3,856 | 332 | 33 | 1 | |
| All | aligned bases | 1,283,087 | 767,773 | 739,007 | 1,447,118 | 543,134 |
| expected errors | 220,252 | 21,513 | 1,781 | 370 | 13 | |
| actual errors | 187,926 | 18,103 | 1,441 | 237 | 12 |
Both the high overall accuracy and the tendency to slightly overpredict errors are confirmed by statistical analysis, as shown in Table 4. The correlation between predicted and actual error frequencies is excellent for all projects (Spearman correlation coefficient >0.89, P < 0.0001). Averaged over all projects, the actual error rate is 84.5% of the predicted error rate; the slope of the relation between predicted and actual error rates differs slightly between projects and ranges from 76.6% to 88.4%. To put these differences between projects in relation, it is worthwhile remembering that PHRED quality scores cover a wide dynamic range: The maximum quality score of 51 corresponds to a 50,000-fold lower predicted error rate than the minimum quality score of 4. Even the relative difference between successive quality is larger than the relative difference in the slopes; for example, a quality score of 10 corresponds to an error probability of 10%, whereas a score of 9 corresponds to an error probability of 12.6%.
Table 4.
Summary of Statistical Analysis Results
| Project | Spearman ρ | P > |ρ| | Slope | t ratio | P > |t| |
|---|---|---|---|---|---|
| A | 0.9646 | <0.0001 | 0.818 | 75.1 | <0.0001 |
| B | 0.9890 | <0.0001 | 0.874 | 98.2 | <0.0001 |
| C | 0.9846 | <0.0001 | 0.766 | 71.6 | <0.0001 |
| Da | 0.8692 | <0.0001 | 0.855 | 68.3 | <0.0001 |
| E | 0.9956 | <0.0001 | 0.884 | 144.3 | <0.0001 |
| F | 0.9968 | <0.0001 | 0.865 | 151.6 | <0.0001 |
| All | 0.9964 | <0.0001 | 0.845 | 174.5 | <0.0001 |
In project D, the Spearman correlation coefficient ρ was artificially low as only very few bases (10) bases had a quality score of 5, and none of these bases contained an actual error (expected: 3.16 errors). Exclusion of this quality score gave a Spearman correlation coefficient of 0.9786 (P < 0.0001). The frequencies in the slope calculations were weighed by the number of bases at any given quality score and, thus, were not sensitive to such small sample distortions (see Methods).
A different way of looking at the relation between the actual and predicted error rates is shown in Figure 1. Here, the error rates as a function of the position within all reads in each of the projects, averaged over 50-base windows, is depicted. For all six projects, the predicted error rates are very close to the actual error rates over the entire length of the sequences. Each project has a characteristic distribution of error rates, which differs from each of the other projects. The minimum error rate differs dramatically between projects. The best projects achieve raw error rates of 0.23%–0.36% in the best region of the sequence read, typically from base 150 to 200. The worst project in the data set had an ∼10-fold higher error rate of 2.58%.
Figure 1.
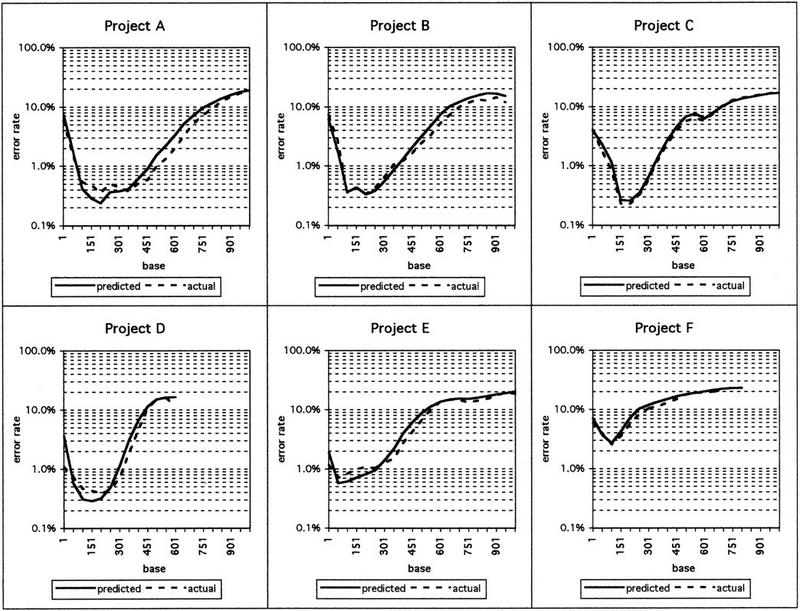
Actual and predicted error rates in six different sequencing projects. Actual error rates and predicted error rates in 50-base windows over the length of the sequence reads, averaged over all reads that could be aligned to the consensus sequence by CROSS_MATCH, are shown. The numbers on the x-axis show the first base in a given 50-base window.
Toward the end of sequence reads, the error rates increase and start to exceed 10% between bases 300 and 700. In projects that used mainly short gels (e.g., projects D and F), this increase begins sooner, whereas projects that use longer gels show a markedly longer stretch of low error rates (e.g., projects A and B).
Table 5 summarizes key results for the six projects. The first four projects have similar minimum and average error rates. However, the length of the region where the error rate is below 5% differs significantly, from 403 to 682 bases. The project with the shorter low error rate regions contained larger portions of reads generated on short gels, whereas projects A and B were run exclusively on long gels (ABI373 stretch or ABI377 sequencers). Other factors contributing to differences between the first four projects were differences in sequencing chemistries, production scale, and electrophoresis conditions and machines.
Table 5.
Comparison of Key Results for Six Different Sequencing Projects
| Project | Actual minimum error rate (%) | Actual average error rate (%) | Length of <1% error region | Length of <5% error region | Average bases with P(error) <0.1% |
|---|---|---|---|---|---|
| A | 0.36 | 3.6 | 422 | 682 | 468 |
| B | 0.34 | 2.8 | 274 | 567 | 395 |
| C | 0.23 | 2.4 | 291 | 479 | 348 |
| D | 0.39 | 3.1 | 300 | 403 | 294 |
| E | 0.71 | 4.7 | 129 | 464 | 317 |
| F | 2.58 | 9.2 | 0 | 162 | 79 |
Project E and, in particular, project F, had significantly higher error rates than the first four projects. In projects E and F, every sequence generated for the project had been included in the data set, whereas the other four projects had eliminated some “bad” sequences through manual or automatic inspection. After eliminating <10% of the worst sequences in project E, the error rates for the remaining sequences were comparable to those of the first four projects. In contrast, project F showed a much more uniform distribution of sequence quality.
The last column in Table 5 shows the average number of bases with an estimated error probability of at most 0.1%, which is equivalent to a quality score of at least 30. The count of such “very high-quality” bases is a good indicator of sequence quality, both for individual sequences and, when averaged over all sequences in a project, as an indicator for the entire project. Compared to the estimated error rates, the count of very high-quality bases is less prone to distortions from a small number of low-quality reads, as the data for project E demonstrate.
Prediction Accuracy for Data Subsets of Different Quality
The quality of sequences within any given project can vary substantially, and the use of predicted error rates has the potential to be a powerful tool for quality analysis and control in large-scale DNA sequencing projects. To analyze how accurate PHRED error estimates are for different quality sequences within the same sequencing project, we subdivided a data set into four quartiles, based on the number of very high-quality bases in each sequence (see Methods). The comparison of actual and predicted error rates is shown in Figure 2.
Figure 2.
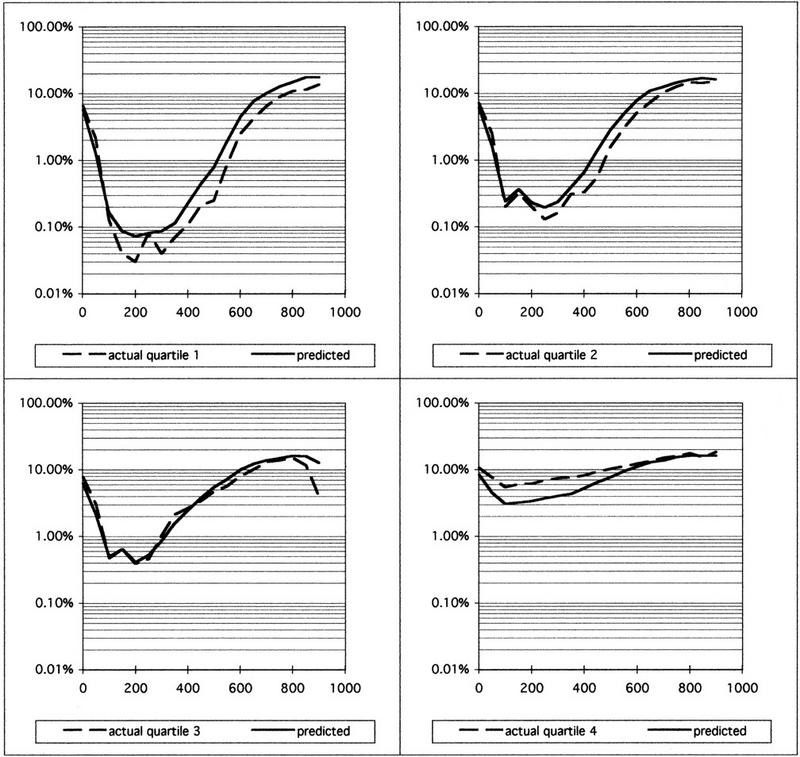
Actual and predicted error rates in different quality subsets of project B. Sequence reads were sorted by the number of bases with a predicted error rate of at most 0.1% (very high-quality bases), and assigned to quartiles, with quartile 1 corresponding to the highest numbers. Actual and predicted error rates for all sequences in each subset were calculated as in Fig. 1. Note that a number of sequence reads that had been rejected because of too low quality were added back to the data set for illustrative purposes, all of which are in quartile 4. These sequences were not included in the data sets used to generate Figs. 1 and 3 and Tables 1 and 3.
When measured by the error rate in the best region of a sequence, the data quality in the different quartiles varies >100-fold between the best and the worst 25% of the sequences. The best quartile showed ∼0.03% error for >100 bases, whereas the error rate in the worst quartile always exceeded 5%. In quartiles 2 and 3, the predicted error rates match the actual error rates very closely. In the best and worst quartiles, PHRED’s accuracy was somewhat lower from base 100 to 500. In the best sequences, PHRED’s error estimates were about twofold too high; in the worst sequences, the error estimates were too low, again by a factor of 2. This underprediction of errors can be partially explained by the fact that PHRED gives ambiguous base calls (N’s) a quality score of 4, corresponding to an error probability of 39.8%; however, N’s will always show up as an actual error. Even in the worst and best quartiles, however, the predicted error rate curves are very similar to the actual error rate curves.
The results shown in Figure 2 also demonstrate that the count of very high-quality bases, or bases with an estimated error probability of at most 0.1%, can be used effectively to characterize the overall quality of a sequence read. Sorting the sequence reads into quartiles based on the number of very high-quality bases worked well, as shown by the >100-fold difference in the minimum error rate between the first and the fourth quartile.
Other methods to characterize the overall quality of individual reads based on PHRED quality scores can give similar results. For example, counting bases above a minimum quality threshold anywhere in the range of 20–40 gave similar results for most data sets (not shown), and such counts are used by a number of different laboratories as quality measures. Alternatively, the quality values can be converted to error probabilities and averaged to give the predicted error rate for the trace, or summed to give the total predicted number of errors in a trace. However, such averages and totals can sometimes give a misleading picture, as the following example illustrates. Assume that two sequence reads have very similar quality in the alignable part of the read but that one of the two sequences was run much longer and therefore contains a longer unalignable “tail” of very low-quality bases. When calculating the average error rate for these two sequences, the second sequence will have a much higher average error and, therefore, appear to be of lower quality. In contrast, the counts of very high-quality bases for both sequences will be very similar, as the unalignable tails contain few, if any, high-quality bases. Therefore, counts of bases above a high enough quality threshold will give a more robust and clearer picture of trace quality.
Frameshift Error Rates for Different Sequencing Chemistries
Depending on how biologists use DNA sequences, knowledge about total error rates in raw sequences may or may not be sufficient. For example, frameshift errors in coding sequences will generally lead to incorrectly predicted open reading frame, whereas mismatch errors will do so only if the mismatch introduces a stop codon or a new splice site. At the time of this writing, PHRED did not differentiate between mismatch and frameshift errors, but only estimated total error rates. This might occasionally lead to questionable conclusions, as the results shown in Figure 3illustrate.
Figure 3.

Actual frameshift and total error rates for projects A and B. To calculate frameshift error rates, only insertions and deletions were counted. Mismatch errors, which account for the vast majority of errors after base 150, were included only in the total error count. Note that project B (▴,▵) has a slightly similar or slightly higher total error rate compared to project A (•,○) but only about one-third as many insertions and deletions up to base 500. For both projects, the frameshift error rate in the raw data is <1 in 1000 for >300 bases, and ≤1 in 10,000 for >100 bases in project B.
Figure 3 shows the total actual error rates and the frameshift error rates for two projects, A and B. The total error rates for both projects are similar for up to 350 bases; after 350 bases, project B has a somewhat higher total error rate. However, examining the frameshift error rate gives rise to a different picture: from base 1 to 500, project A has approximately four times as many insertions and deletions as project B. This difference in frameshift error rates can be explained by the sequencing chemistries that were used in the two projects. Project B, with the lower frameshift error rate, used only dye terminator chemistry, which is known to eliminate band spacing artifacts from hairpin structures (“compressions”). Project A, on the other hand, used dye primer chemistry, which is more prone to insertion and deletion errors from mobility artifacts, for most sequencing reactions.
DISCUSSION
As large-scale DNA sequencing has become a more routine and common process, the traditional methods for assessing sequence quality have become unsatisfactory. In projects like single-pass cDNA sequencing, it is not possible to calculate and compare error rates after finishing a sequence, as finishing never takes place. Even when a comparison between raw and finished sequence can be done, the time delay between raw data generation and quality assessment is often large. This delay makes it difficult to improve ongoing projects, and it sometimes makes it impossible to capture problems early on. Some immediate quality feedback can be reached by including known standard sequences for quality control. However, this approach can be costly, and it fails when error profiles differ between standard and unknown sequences.
In contrast to these traditional methods to assess sequence accuracy, direct estimation of error rates in raw sequence data would enable immediate quality control and feedback. Accurate, base-by-base estimates of error probabilities could also increase the utility of single-pass sequences significantly, allow efficient comparison and optimization of different sequence chemistries, and enable the development of better software tools for sequence assembly and analysis.
The critical question for any error rate prediction tool is how accurate are the error rate estimates, in particular if different sequencing methods and chemistries are used? The results presented herein provide an answer to this question for the program PHRED, as well as clues where further development would be useful. As shown in Tables 3 and 4 and in Figure 1, the agreement between predicted and actual error rates was very good in each of the six different projects analyzed. The observed high level of prediction accuracy in all of these projects is almost astonishing if one takes into account that actual errors are binary (a base is either correct or wrong), whereas predicted error rates are probabilities on a scale from 0.0 to 1.0. The observed tendency to overpredict error rates can be at least partially explained by the “small sample correction” that was used in the derivation of threshold parameters for quality scores (Ewing and Green 1998). For most practical applications, such a somewhat conservative estimation of quality scores is tolerable or even desirable. Overall, the results clearly show that error probabilities given by PHRED accurately describe raw sequence data quality.
In judging the usefulness of predicted error probabilities, it is important to know how differences in sequencing methods will influence the prediction accuracy. For example, the larger variation in peak heights tends to be larger in dye terminator sequencing than in dye primer sequencing, and different sequencing enzymes are known to produce different specific height variation patterns. Any estimation of error probabilities that takes the peculiarities of a specific sequencing chemistry into account would therefore be expected to be less accurate for different chemistries.
The projects included in this study were specifically chosen to provide an initial answer to the question of how generally useful PHRED quality scores are. These projects represent the vast majority of different multicolor fluorescent sequencing methods used in the last 3 years: different template DNAs and DNA preparation methods, different enzymes, gel lengths, run conditions, and different fluorescent dyes. The data also include a considerable spread in data quality, both between projects and within individual projects. None of the projects analyzed here were included in PHRED’s training set, and just one of the six laboratories that contributed data to this study also contributed data to the training data sets. One of the projects in this study consisted entirely of dye terminator sequences, which presented only a small fraction of the sequences in the test data set. Another project exclusively used a set of fluorescent dyes different from those used in the training sets. Each project differed from the other projects in this study in at least one, and typically many, experimental aspects like template preparation, sequencing enzymes, gel run conditions, and so forth. Despite these differences, the accuracy of error rate predictions was very similar for all projects.
Our results justify some optimism about the accuracy of PHRED quality scores for minor changes in sequencing technology, for example, sequences generated by new enzymes and fluorescent dyes. Initial studies showed that PHRED quality scores were also accurate for sequences produced by multiplex sequencing with radioactive detection (P. Richterich, unpubl.). However, we also observed two effects that can invalidate PHRED quality scores during these studies. First, sequences generated by chemical sequencing gave too low quality scores at mixed (A + G) reactions. Because secondary peak height is one of the parameters used in the error rate predictions, this is not surprising. Another potential source of error is high-frequency noise in the trace data. With such data, PHRED occasionally underestimated the band spacing by a factor of 2 or more, which resulted in incorrect base calls and quality scores. By applying simple smoothing algorithms to data with high-frequency noise, these problems could typically be resolved. Similar steps may be necessary to obtain accurate PHRED quality scores on data that have been generated by different sequencing instruments or preprocessed by different software.
Accurate quality scores can have a major impact on how sequences are used downstream from the sequence production process. In traditional sequencing projects where the goal is complete coverage at a final error rate below (e.g.) 1 in 10,000, the accuracy goals can be reached with single sequence reads as long as the quality scores are at least 40 (however, other potential problems like clone instability may make higher coverage advisable). Interesting questions arise as to how individual read quality contributes to project quality, or the error rate of the “final” sequence. Under the assumption that errors between different sequence reads are completely independent, one could argue that two reads with a quality score of 20 (error probability of 1 in 100) are just as valuable as one sequence with a quality score of 40 (error probability of 1 in 10,000). However, although a single sequence stretch with quality levels above 40 would give a final sequence with an error rate of <1 in 10,000, assembling a consensus from two sequences with quality scores of 20 (1% error rate) could lead to one of two results: If the errors were completely random, the consensus sequence would be ambiguous at 2% of all locations; if the errors were completely localized, for example, because of reproducible compressions, the consensus sequence would have one “hidden” error every 100 bases. Typically, consensus sequences derived from low-quality sequences will have both kinds of problematic regions. Increased coverage can rapidly eliminate the random errors; however, increased coverage does not resolve errors from systematic sources. Manual examination of such problem areas is generally required; such “contig editing,” however, tends to be time consuming, requires highly trained personnel, is an obstacle toward complete automation of DNA sequencing, and sometimes fails to eliminate all errors. This leads to the somewhat counterintuitive conclusion that the practical value of increasing sequence quality can be even higher than indicated by the quality scores: One sequence of average quality above 40 can be “worth” more than two sequences of average quality 20.
Another application of DNA sequencing where high quality can be of disproportionately high value is the search for mutations in genomic DNA. In low quality sequences, secondary peaks and low resolution often complicate the identification of heterozygous mutations. In regions of higher sequence quality, such secondary peaks are smaller or absent and peaks are better resolved. Therefore, both false-positive and false-negative errors can be significantly reduced in high-quality regions. Tools like PHRED, which can accurately measure sequence quality from trace data, can be of twofold value for mutation detection. First, base-specific quality scores can allow optimization of sequencing methods and strategies for mutation detection. Second, the quality scores can be used to evaluate the usefulness of individual sequence reads for mutation detection (e.g., by discarding reads below minimum thresholds), and they can guide software that automatically detects mutations.
The ability to predict error rates in a highly accurate fashion is likely to have a major impact in applications like those described above. PHRED is the first widely used program that accurately predicts base-specific error probabilities. However, the algorithm for determining quality values has been described (Ewing and Green 1998), and it should be straightforward to implement similar quality values in other base-calling programs. Furthermore, an extension of the approach developed by Ewing and Green should be possible. For example, differentiation between mismatch and frameshift errors would enable better comparisons of sequencing methods with similar total error rates but different frameshift error rates. Several groups have described efforts to calculate separate probabilities (or “confidence assessments”) for mismatch errors and frameshift errors (Lawrence and Solovyev 1994; Berno 1996). Their results demonstrated that different approaches to error type characterization are feasible and promising. Implementation of such error type predictions in other programs similar to the way PHRED uses quality scores would enable better method assessments, benchmarking, and production quality control, and could have a significant impact on downstream uses of DNA sequence information.
METHODS
Data Sets
For one project, sequence raw data in the form of ABI trace files were downloaded from a public FTP site. Sequence data for the five other projects were kindly provided by five different large-scale sequencing groups. Table 1 gives a summary of the six projects, and Table 2 gives an overview of the different sequencing methods used in the projects. The projects differed in the amount of prescreening of data that had been done, reflecting different approaches to quality control in different laboratories. In two projects (B and C), different software programs had been used to identify and eliminate low-quality sequences. One project (F) included all data files generated, whereas the other three projects had excluded “failed lanes.”
Comparison of Actual and Predicted Error Rates
The sequences for all traces in each project were recalled using the program PHRED (v. 961028). Next, sequences in each project were assembled with PHRAP (P. Green, unpubl.). Slightly different methods were chosen for the statistical and graphical evaluation of the error rate prediction accuracy. In the statistical evaluation, only the longest contig produced by PHRAP was considered. The tables of aligned bases and observed discrepancy counts for each quality score were taken from the PHRAP output and analyzed as follows. The expected number of discrepancies (E) at each quality score (q) was calculated by multiplying the number of aligned bases (N) with the error probability corresponding to the quality score: E = N 10−0.1q. The Spearman ranking coefficients were calculated by comparing the expected and observed error frequencies. To obtain the quantitative relation between the expected and observed error rates over the entire range, a least-squares fit between the observed and expected rates was performed, with the intercept set to zero and the number of aligned bases at each quality score used as weights.
For a graphical comparison of estimated and actual error rates in 50-bp windows, the following steps were taken. For two of the projects, the consensus sequence was retrieved from public databases. For the four other projects, the DNA sequence and quality information were used by the program PHRAP to assemble consensus sequences for each of the projects. The individual reads were aligned to the consensus sequences of the longest contig, using the program CROSS_MATCH (P. Green, unpubl.), after removing single-coverage regions from the ends of the consensus sequence. CROSS_MATCH uses an implementation of the Smith–Waterman algorithm to generate alignments that typically do not include the ends of sequences, where disagreements are commonly due to vector sequence or low quality sequence.
The quality files generated by PHRED and the alignment summaries generated by CROSS_MATCH were then analyzed as follows. First, the region of each query sequence that had been aligned by CROSS_MATCH was determined. Next, the actual and predicted error rates for the entire aligned part of each individual sequence was calculated. In addition, the average actual and predicted error rates for all alignable sequences together were calculated for windows of 50 bases in length. To calculate the predicted error rate, the quality scores q determined by PHRED at each base were converted to error probabilities as described above (Ewing and Green 1998).
Subdividing Data into Subsets Based on Data Quality
To examine the accuracy of PHRED quality scores for data subsets of different quality within a project, the following approach was taken. For all sequence reads in project B, the number of bases with a quality score of at least 30 in each sequence was determined (bases with quality scores of at least 30 were called very high-quality bases, or VHQ bases). Sequences were sorted in descending order based on the number of very high-quality bases, and divided into four quartiles. Accordingly, quartile 1 contained 25% of sequences with the highest number of very high-quality bases, and quartile 4 contained the “worst” sequences. To illustrate the prediction accuracy in data with relatively high error rates, sequences from project B that had been “discarded” because they had not met the minimum quality criteria were added back to the data set. The sequences in each quartile were compared to the consensus sequences that had been generated using the entire data set, as described above for the graphical comparison.
Determining Actual Frameshift Error Rates
The calculation of actual frameshift error rates in the raw sequence data was performed using CROSS_MATCH, similar to the procedure described above for total error rates, except that only insertion and deletion errors were counted. Because PHRED does not give separate frameshift error estimates, a comparison of predicted and actual frameshift errors is not possible.
Acknowledgments
I thank the participating laboratories for contributing their data, Dr. Josée Dupuis for help with the statistical analysis, and Dr. Phil Green for helpful discussions.
The publication costs of this article were defrayed in part by payment of page charges. This article must therefore be hereby marked “advertisement” in accordance with 18 USC section 1734 solely to indicate this fact.
REFERENCES
- Berno AJ. A graph theoretic approach to the analysis of DNA sequencing data. Genome Res. 1996;6:80–91. doi: 10.1101/gr.6.2.80. [DOI] [PubMed] [Google Scholar]
- Bonfield JK, Staden R. The application of numerical estimates of base calling accuracy to DNA sequencing projects. Nucleic Acids Res. 1995;23:1406–1410. doi: 10.1093/nar/23.8.1406. [DOI] [PMC free article] [PubMed] [Google Scholar]
- Churchill G, Waterman MS. The accuracy of DNA sequences: estimating sequence quality. Genomics. 1992;14:89–98. doi: 10.1016/s0888-7543(05)80288-5. [DOI] [PubMed] [Google Scholar]
- Ewing, B. and P. Green. 1998. Base-calling of automated sequencer traces using phred. II. Error probabilities. Genome Res. (this issue). [PubMed]
- Ewing, B., L. Hillier, M.C. Wendl, and P. Green. 1998. Base-calling of automated sequencer traces using phred. I. Accuracy assessment. Genome Res. (this issue). [DOI] [PubMed]
- Lawrence CB, Solovyev VV. Assignment of position-specific error probability to primary sequence data. Nucleic Acids Res. 1994;22:1272–1280. doi: 10.1093/nar/22.7.1272. [DOI] [PMC free article] [PubMed] [Google Scholar]