

Abstract
The goal of this research was to disentangle effects of phonotactic probability, the likelihood of occurrence of a sound sequence, and neighborhood density, the number of phonologically similar words, in lexical acquisition. Two word learning experiments were conducted with 4-year-old children. Experiment 1 manipulated phonotactic probability while holding neighborhood density and referent characteristics constant. Experiment 2 manipulated neighborhood density while holding phonotactic probability and referent characteristics constant. Learning was tested at two time points (immediate vs. retention) in both a naming and referent identification task, although only data from the referent identification task were analyzed due to poor performance in the naming task. Results showed that children were more accurate learning rare sound sequences than common sound sequences and this was consistent across time points. In contrast, the effect of neighborhood density varied by time. Children were more accurate learning sparse sound sequences than dense sound sequences at the immediate test point but accuracy for dense sound sequences significantly improved by the retention test without further training. It was hypothesized that phonotactic probability and neighborhood density influenced different cognitive processes that underlie lexical acquisition.
Keywords: phonotactic probability, neighborhood density, lexical acquisition, vocabulary
Models of spoken word recognition and production typically incorporate three types of representations: phonological, lexical, and semantic (e.g., Dell, 1988; Gupta & MacWhinney, 1997; Levelt, 1989; Luce, Goldinger, Auer, & Vitevitch, 2000; Magnuson, Tanenhaus, Aslin, & Dahan, 2003; McClelland & Elman, 1986; Norris, 1994). The phonological representation corresponds to information about individual sounds, with models varying in the specific sound unit chosen (e.g., phonetic features, context specific allophones, phonemes). Assuming a phoneme unit of representation, the phonological representation of a word such as “seal” would consist of three separate sound units, namely /s/, /i/, and /l/. The lexical representation corresponds to the whole-word form as a single unit. Thus, the lexical representation of “seal” would be a single lexical unit, specifically /sil/. Finally, the semantic representation corresponds to the meaning of the word, which for “seal” would include information such as “ocean mammal with webbed flippers.”
Recent studies of adult and child spoken word recognition and production suggest that form-related variables influence retrieval of phonological and lexical representations. Specifically, phonotactic probability, the likelihood of occurrence of a sound sequence, facilitates spoken word recognition and production with common sound sequences being recognized and produced more accurately and/or faster than rare sound sequences (Edwards, Beckman, & Munson, 2004; Munson, Swenson, & Manthei, 2005; Newman & German, 2005; Vitevitch, 2003; Vitevitch, Armbruster, & Chu, 2004; Vitevitch & Luce, 1998, 1999; Zamuner, Gerken, & Hammond, 2004). Neighborhood density, the number of words in the lexicon that are phonologically similar to a given word, influences word recognition in a different manner than word production. In particular, words from sparse neighborhoods are recognized more accurately and/or faster than words from dense neighborhoods (Garlock, Walley, & Metsala, 2001; Metsala, 1997; Vitevitch, 2002b, 2003; Vitevitch & Luce, 1998, 1999); whereas, words from dense neighborhoods are produced more accurately and/or faster than words from sparse neighborhoods (Vitevitch, 1997, 2002a, b ut see Munson et al., 2005; Newman & German, 2005).
While there is ample evidence that phonotactic probability and neighborhood density influence retrieval of phonological and lexical representations by adults and children, their role in acquisition of representations is less clear. Emerging evidence suggests that phonotactic probability and neighborhood density may influence lexical acquisition by children and adults. However, few studies have attempted to differentiate effects of phonotactic probability from those of neighborhood density (but see Storkel, 2009; Storkel, Armbruster, & Hogan, 2006) due to the inherent correlation between these two variables (Storkel, 2004b; Vitevitch, Luce, Pisoni, & Auer, 1999). That is, rare sound sequences tend to reside in sparse neighborhoods and common sound sequences tend to reside in dense neighborhoods. Studies of correlated phonotactic probability and neighborhood density show that 3- to 5-year-old children learn common sound sequences in dense neighborhoods more readily than rare sound sequences in sparse neighborhoods (Storkel, 2001, 2003, 2004a; Storkel & Maekawa, 2005). However, the independent effect of each variable can not be determined from only examining the correlated condition, limiting the ability to fully understand how these two variables influence lexical acquisition. The goal of these studies is to examine how children learn words varying in phonotactic probability but matched in neighborhood density (Experiment 1) and words varying in neighborhood density but matched in phonotactic probability (Experiment 2).
To fully understand the role of phonotactic probability and neighborhood density in lexical acquisition, the cognitive processes that underlie acquisition must be considered. At least three processes may be relevant: triggering (allocating a new representation in long-term memory), configuration (storing lexical and semantic information in long-term memory), and engagement (integrating the new representation with existing representations). In terms of triggering, when a sound sequence and referent are encountered, existing phonological, lexical, and semantic representations will be activated. Triggering mechanisms, which are incorporated into many computational models that both acquire new information and recognize old information (cf. Adaptive Resonance Theory for an example of this type of mechanism, e.g., Carpenter & Grossberg, 1987), determine whether the input sufficiently matches existing representations by setting a threshold defining what constitutes a sufficient match (i.e., the vigilance parameter). In the case of a previously encountered sound sequence and referent (i.e., known word), the input will likely sufficiently match existing representations (i.e., threshold not exceeded) and an existing representation will be retrieved (i.e., recognition of a known word). In the case of a novel sound sequence and referent (i.e., new word), the input likely will not exactly match existing representations (i.e., threshold exceeded) and a new representation will be allocated (i.e., node recruitment, Li, Farkas, & MacWhinney, 2004). To summarize, the outcome of triggering is a determination of which representations to use: already existing representations or completely new representations.
Presumably, there is some degree of error associated with triggering. That is, novel words that are highly similar to existing representations, such as those that are high probability or high density, may fail to exceed threshold. In this case, an existing representation will be erroneously retrieved, interfering with learning of the novel word. In contrast, novel words that are similar to few existing representations, such as those that are low probability or low density, will likely far exceed the threshold. Here, a new representation will be allocated, facilitating learning of the novel word. Based on these hypotheses, if phonotactic probability or neighborhood density influences triggering, differences should be apparent early in learning with better performance for low than high probability or density.
Turning to configuration, once a new representation is allocated during triggering, information from the input (e.g., the sound sequence and referent of the word) must be stored within this new representation (Leach & Samuel, 2007). It is likely that configuration is incomplete following minimal exposure, resulting in a potentially incorrect or gradient representation (Capone & McGregor, 2005; Gershkoff-Stowe, 2002; Metsala & Walley, 1998). However, upon subsequent exposure to the word, triggering likely results in activation and selection of the previously created new representation so that it can be updated via configuration (e.g., updating of connection weights as in Li et al., 2004). Thus, while triggering selects a representation (old or new), configuration stores or updates information within the selected representation.
There is ample evidence that working memory influences storage of information, namely configuration, during word learning (e.g., Gathercole & Baddeley, 1989, 1990; Gathercole, Willis, Emslie, & Baddeley, 1992). Although certainly not the only factor that influences configuration, the role of working memory in configuration has particular relevance for the study of phonotactic probability and neighborhood density in word learning. Specifically, past studies of working memory show better performance for high probability or high density nonwords compared to low probability or low density nonwords (Edwards et al., 2004; Gathercole, Frankish, Pickering, & Peaker, 1999; Roodenrys & Hinton, 2002; Thomson, Richardson, & Goswami, 2005; Thorn & Frankish, 2005). This leads to the hypothesis that high probability or high density sound sequences will be maintained more accurately and/or for a longer time in working memory, leading to a more accurate and detailed representation in long-term memory. If this is the case, the influence of phonotactic probability or neighborhood density should be apparent during training when the input is being held in working memory to create or update the representation in long-term memory and performance should be better for high than low probability or density.
Turning to engagement, once a new representation is created it must be integrated with similar existing representations, allowing the new representation to influence processing of existing representations and vice-versa (Leach & Samuel, 2007). Unlike triggering and configuration, engagement does not appear to be dependent on input. That is, recent evidence suggests that engagement may not occur during training when input is available, but rather occurs over a no training delay when input is not available but memory consolidation is occurring (Dumay & Gaskell, 2007; Gaskell & Dumay, 2003; Tamminen & Gaskell, 2008). Memory consolidation presumably involves the off-line transfer of a fragile episodic memory trace to a more stable memory trace that can resist interference and be retained over a long period (Davis & Gaskell, 2009). Moreover, this process may be critically linked to sleep (Dumay & Gaskell, 2007). Previous studies of engagement have not manipulated the characteristics of the words to be learned so it is unclear how phonotactic probability or neighborhood density might influence this process. However, an influence of phonotactic probability or neighborhood density on engagement could be inferred if differences arise after a no training delay.
There are multiple potential points of influence for phonotactic probability and neighborhood density during lexical acquisition. To begin to address these issues, learning of nonwords varying in phonotactic probability (Experiment 1) or neighborhood density (Experiment 2) was examined immediately following training to examine triggering and configuration and 1-week after training to examine engagement.
Experiment 1
The goal of this experiment was to examine the influence of phonotactic probability on lexical acquisition by typically developing 4-year-old children. The to-be-learned nonwords varied in phonotactic probability (rare vs. common) while holding neighborhood density constant. Likewise, characteristics of the novel objects paired with the nonwords were held constant. Learning was measured in two tasks: (1) picture naming, where a novel object was presented and the child produced the trained nonword; (2) referent identification, where the child heard a nonword and selected the trained novel object from an array of choices. These two measures were administered at three time points, prior to training to establish baseline performance, immediately following exposure to tap the creation of new lexical and semantic representations, and one-week post-exposure to tap retention of these newly created representations. Unfortunately, floor effects were apparent on the naming task as characterized by relatively low proportion correct and a large standard deviation extending close to 0 (M = 0.20, SD = 0.14). Therefore, only the referent identification task is reported.
Method
Participants
Participant characteristics are shown in Table 1. Thirty-one 4-year-old children were recruited through local preschools or a database of families interested in participating in research. Based on parent questionnaire, children had no previously identified cognitive, social, emotional, motor, visual, hearing, or major medical impairments. Participating children passed a hearing screening (ASHA, 1997) and scored within normal limits (i.e., obtained a score above the 16th percentile or standard score of 85) on standardized tests of phonological development (Goldman & Fristoe, 2000), receptive vocabulary (Dunn & Dunn, 1997), and expressive vocabulary (Williams, 1997).
Table 1.
Participant characteristics.
| Experiment 1 | Experiment 2 | ||
|---|---|---|---|
| Age | M | 4;6 | 4;5 |
| (SD) | (0;3) | (0;4) | |
| range | 4;0–4;11 | 4;0–4;11 | |
| GFTA percentile | 77 | 69 | |
| (19) | (24) | ||
| 23–98 | 19–98 | ||
| PPVT standard score* | 105 | 112 | |
| (11) | (11) | ||
| 88–136 | 94–132 | ||
| EVT standard score* | 108 | 115 | |
| (12) | (11) | ||
| 90–133 | 86–130 |
GFTA = Goldman-Fristoe Test of Articulation – 2, PPVT = Peabody Picture Vocabulary Test – 3, EVT = Expressive Vocabulary Test.
Significant difference between experiments, p < 0.05.
Nonword Stimuli
Phonotactic probability and neighborhood density were computed for a pool of legal American English consonant-vowel-consonant (CVC) nonwords with early acquired phonemes (Smit, Hand, Freilinger, Bernthal, & Bird, 1990). Original computations and stimuli selection were based on an approximately 20,000 word adult corpus (Nusbaum, Pisoni, & Davis, 1984). Later, values were re-computed using an approximately 5,000 word child corpus that recently became available on-line (Storkel & Hoover, 2009, http://www.bncdnet.ku.edu/cml/info_ccc.vi). Values for the selected CVCs are shown in Table 2.
Table 2.
Phonotactic probability and neighborhood density of the stimuli.
| Experiment 1 | Experiment 2 | ||||
|---|---|---|---|---|---|
| Rare1 | Common2 | Sparse3 | Dense4 | ||
| Characteristics Based on Adult Corpus | |||||
| Positional segment sum | M | 0.08 | 0.15 | 0.13 | 0.13 |
| (SD) | (0.01) | (0.01) | (0.02) | (0.02) | |
| range | 0.07–0.09 | 0.14–0.16 | 0.11–0.14 | 0.11–0.15 | |
| Biphone sum | M | 0.0015 | 0.0049 | 0.0038 | 0.0035 |
| (SD) | (0.0001) | (0.0009) | (0.0024) | (0.0008) | |
| range | 0.0014–0.0016 | 0.0039–0.0061 | 0.0001–0.0063 | 0.0027–0.0046 | |
| Neighborhood density | M | 10 | 10 | 5 | 14 |
| (SD) | (1) | (1) | (1) | (2) | |
| range | 9–12 | 9–12 | 5–6 | 12–17 | |
| Characteristics Based on Child Corpus | |||||
| Positional segment sum | M | 0.11 | 0.15 | 0.13 | 0.16 |
| (SD) | (0.01) | (0.01) | (0.01) | (0.02) | |
| range | 0.10–0.13 | 0.14–0.17 | 0.12–0.15 | 0.14–0.17 | |
| Biphone sum | M | 0.0019 | 0.0058 | 0.0030 | 0.0054 |
| (SD) | (0.0007) | (0.0016) | (0.0019) | (0.0007) | |
| range | 0.0012–0.0026 | 0.0038–0.0078 | 0.0000–0.0044 | 0.0045–0.0062 | |
| Neighborhood density | M | 8 | 7 | 5 | 12 |
| (SD) | (3) | (3) | (1) | (2) | |
| range | 5–12 | 3–11 | 4–7 | 10–15 | |
/geɪg geɪf tɔf haʊd bug/
/jaɪn nɪb bεb poʊg poʊb/
/dɔɪk gɪf paɪb jɑm nεp/
/jΛt boʊg tɑb faʊn wӕd/
Two measures of phonotactic probability were computed: positional segment sum and biphone sum (Storkel, 2004b). Positional segment sum is computed by adding the positional segment frequency of each sound in the word. Positional segment frequency is the sum of the log frequency of each word in the corpus that contains the target sound in the target word position divided by the sum of the log frequency of every word in the corpus that contains any sound in the target word position. Biphone sum is computed by adding the biphone frequency of each adjacent pair of sounds in the word. Biphone frequency is the sum of the log frequency of each word in the corpus that contains the target pair of sounds in the target word position divided by the sum of the log frequency of every word in the corpus that contains any sound in the target word position.
Neighborhood density was computed by counting the number of words in the corpus that differed from the target CVC by a one sound substitution, deletion, or addition in any word position.
Percentiles for phonotactic probability and neighborhood density were computed for the CVC pool and used to define rare (i.e., 10th – 25th percentile for both positional segment sum and biphone sum) versus common phonotactic probability (i.e., 50th – 75th percentile for both positional segment sum and biphone sum) and mid neighborhood density (i.e., 50th percentile +/− ½ standard deviation). Five nonwords with rare phonotactic probability were selected followed by five nonwords with common phonotactic probability that were matched in neighborhood density to the rare nonwords. Computations based on the child corpus resulted in similar classification of the stimuli (see Table 2). Stimuli were recorded by a female native speaker of American English and intelligibility was verified by two transcribers blind to the intended target.
Nonobject Stimuli
Nonobjects were selected from a pool of 88 black and white line drawings developed by Kroll and Potter (1984). Five pairs of nonobjects were selected. Nonobjects within a pair were matched for objectlikeness ratings (Kroll & Potter, 1984) and number of semantic neighbors (Storkel & Adlof, 2009a). Storkel and Adlof determined semantic neighbors for both adults and children using a discrete association task (Nelson & Schreiber, 1992), whereby participants were presented with a nonobject and asked to provide the first real word that came to mind that was meaningfully related to the nonobject. Responses provided by two or more participants within a group (i.e., adult or child) were counted as semantic neighbors of the nonobject, and the total number of semantic neighbors was tallied per group (i.e., adult or child). In selecting nonobjects for this task, the number of semantic neighbors was held at a mid level (i.e., 50th percentile +/− ½ standard deviation for adult generated semantic neighbors). One nonobject from each pair was pseudorandomly assigned to one of two sets (i.e., nonobjects 23, 27, 53, 63, and 67 in set 1; nonobjects 26, 31, 59, 78, and 82 in set 2). The two sets were matched in objectlikeness ratings (M = 4.2, SD = 0.7, range 3.4–5.2 for set 1, M = 4.2, SD = 0.7, range 3.4–5.2 for set 2), adult generated semantic neighbors (M = 10.2, SD = 0.4, range 10–11 for set 1, M = 10.0, SD = 0.7, range 9–11 for set 2), and child generated semantic neighbors (M = 9.8, SD = 3.4, range 7–14 for set 1, M = 11.0, SD = 3.4, range 9–17 for set 2). Pairing of nonobject sets to rare versus common nonwords was counterbalanced across participants.
Procedures
Procedures were the same as those reported by Storkel and Adlof (2009b), although recall that the naming task is dropped from this report due to floor effects. Briefly, each child was seated at a laptop computer connected to desktop speakers. Direct RT software controlled the presentation of auditory and visual stimuli, including randomizing the order of presentation on all tasks. The session began with baseline testing of referent identification. In this task, all ten nonobjects were presented on the computer screen and a nonword was presented via the speakers. The child was asked to point to the picture that went with the word. During baseline testing, children were encouraged to guess. The goal of baseline testing was to familiarize children with the procedures and establish chance responding as a reference point for determining when significant learning has occurred during training. Responses were scored as correct (i.e., target nonobject selected) or incorrect (i.e., target nonobject not selected or no response).
Following baseline testing, training was initiated. Each nonobject was shown on the computer with an accompanying exposure script that provided eight presentations of the nonword, including two prompts to repeat the nonword and one prompt to identify a hard copy picture of the nonobject in a card game format. The exact exposure script and card games are described more fully in Storkel and Adlof (2009b). Following completion of training for all ten stimuli, the referent identification task was re-administered, completing the first training-testing cycle.
Training and testing continued until either (1) an overall accuracy criterion was met or (2) the maximum training had been provided. The criterion for the referent identification task was correct identification of 5 of the 10 stimuli. The goal of this criterion was to ensure that all children achieved performance above the floor (i.e., 0% correct) but below the ceiling (i.e., 100% correct) when training was discontinued. If a child did not meet the overall criterion, training was discontinued after six training-testing cycles had been administered, with a maximum of 3 cycles being administered in one day in a 45- to 60-minute session. Fifty-five percent of children met criterion with an average criterion cycle of 4 (SD = 1.8, range 1–6).
Note that for the majority of children (87%), training extended over a period of two days. This method differs from that reported for adults where training typically occurs on one day (Leach & Samuel, 2007), providing a clearer delineation of configuration, which reportedly occurs immediately following training, and engagement, which reportedly occurs after a delay perhaps crucially involving sleep (Dumay & Gaskell, 2007). However, children do not appear to learn words as rapidly as adults (as evidenced by these criteria data), requiring training across multiple days. This sets up the possibility that configuration may be more protracted in children than in adults and that there could be an interaction between configuration and engagement in children that has not been observed in adults. These hypotheses warrant direct testing.
The referent identification task was re-administered approximately one-week (M = 7 days, SD = 3, range 4–17) after completion of training to examine retention of the nonwords.
Results
The first analysis examined whether significant learning occurred in the referent identification task. Proportion correct was compared following training (i.e., criterion/last cycle; retention test) to proportion correct prior to training (i.e., baseline). Proportion correct at criterion/last cycle (M = 0.38, SD = 0.18) was significantly higher than proportion correct at baseline (M = 0.11, SD = 0.10), F (1, 30) = 63.44, p < 0.001, ηp2 = 0.68. Note that the interpretation of the effect size partial eta squared is similar to r squared with ηp2 = 0.01 representing a small effect, ηp2 = 0.10 representing a medium effect, and ηp2 = 0.25 representing a large effect (Cohen, 1988). Proportion correct at retention test (M = 0.36, SD = 0.24) also was significantly higher than proportion correct at baseline (M = 0.11, SD = 0.10), F (1, 30) = 31.33, p < 0.001, ηp2 = 0.51. Thus, significant learning over baseline was apparent at both test points.
The second analysis addressed the primary research questions. Proportion of correct responses on the referent identification task was submitted to a 2 (phonotactic probability: rare vs. common) × 2 (time: criterion/last cycle vs. retention test) repeated measures analysis of variance. Results are shown in Figure 1, which also includes the baseline test point as a reference for chance performance. There was no significant difference between performance at the criterion/last cycle (M = 0.38, SD = 0.18) and performance at the retention test (M = 0.36, SD = 0.24), F (1, 30) = 0.44, p > 0.50, ηp2 = 0.02, suggesting no loss in performance over the 1-week delay without further training. In terms of phonotactic probability, proportion correct for rare sound sequences (M = 0.41, SD = 0.20) was significantly higher than proportion correct for common sound sequences (M = 0.33, SD = 0.23), F (1, 30) = 5.09, p < 0.05, ηp2 = 0.15. As shown in Figure 1, this main effect of phonotactic probability was consistent at each test point following training (i.e., criterion/last cycle; retention test), as indicated by the lack of a significant interaction between phonotactic probability and time, F (1, 30) = 0.01, p > 0.90, ηp2 < 0.01.
Figure 1.
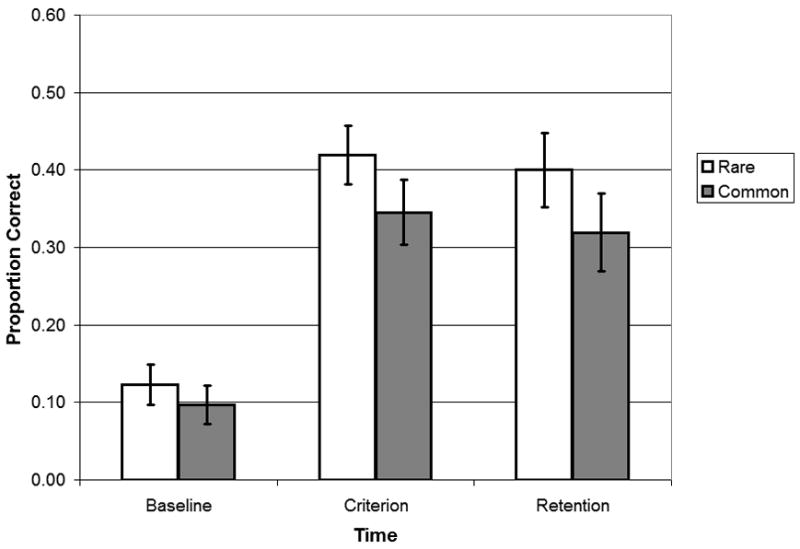
Mean proportion correct for rare (open bar) versus common sound sequences (filled bar) on the referent identification task at baseline, criterion, and retention test points. Error bars depict the standard error of the mean.
Discussion
The primary finding from Experiment 1 is that responses to rare sound sequences were significantly more accurate than responses to common sound sequences and that this difference between rare and common sound sequences was robust over time. One possible explanation of this finding is that phonotactic probability influenced triggering. Upon hearing a novel sound sequence, existing phonological representations will be activated which will in turn spread activation to existing lexical representations. In this scenario, phonotactic probability will determine the extent to which phonological representations are activated, influencing the amount of activation that is spread to lexical representations. Phonological representations will be activated less when the sound sequence is rare than when the sound sequence is common. As a result, less activation will be spread to existing lexical representations when a rare sound sequence is being learned than when a common sound sequence is being learned. Note that the number of lexical representations that are activated is the same across the rare and common sound sequences because the neighborhood density is held constant in this study. Thus, the distinction lies in the amount of activation that is spread to the (same number of) existing lexical representations. The mismatch between the input and existing lexical representations likely is maximized when lexical representations are less activated, as for a rare sound sequence, compared to when lexical representations are more activated, as for a common sound sequence. Consequently, a new representation is correctly allocated for the rare sound sequence but perhaps not for the common sound sequence.
Although the hypothesized influence of phonotactic probability on triggering seems defensible, it is important to consider other alternatives. In terms of configuration, the direction of the effect of phonotactic probability appears inconsistent with an influence on configuration. Recall that working memory was hypothesized to provide support for configuration and the past studies of working memory document poorer performance for rare sound sequences relative to common sound sequences in working memory (Gathercole et al., 1999; Thorn & Frankish, 2005). Thus, the direction of the effect with more accurate referent identification for rare than common sound sequences runs counter to this hypothesis. In terms of engagement, the timing of the effect of phonotactic probability appears inconsistent with an influence on engagement. That is, the effect of phonotactic probability on lexical acquisition was detected immediately upon completion of training, whereas engagement is hypothesized to occur only after a delay potentially involving sleep (Dumay & Gaskell, 2007; Gaskell & Dumay, 2003). Taken together, the most viable account of the data in terms of triggering, configuration, and engagement is that phonotactic probability influenced triggering and that this initial advantage in initiating learning was robust over time.
Experiment 2
The goal of this experiment was to examine the influence of neighborhood density on lexical acquisition by typically developing 4-year-old children. The to-be-learned nonwords varied in neighborhood density (sparse vs. dense) while holding phonotactic probability constant. Likewise, characteristics of the novel objects paired with the nonwords were held constant. Learning was measured using two tasks, picture naming and referent identification, that were administered at three time points, prior to exposure to establish baseline, immediately following exposure (i.e., creation of new representations), and one-week post-exposure (i.e., retention of newly created representations). As in Experiment 1, floor effects were apparent on the naming task (M = 0.20, SD = 0.11). Consequently, only the referent identification task is reported in Experiment 2.
Method
Participants
Participant characteristics are shown in Table 1. Twenty-five 4-year-old children were recruited in the same manner as Experiment 1 and met the same criteria for typical development as Experiment 1. Participant characteristics were compared across experiments using a univariate analysis of variance. As shown in Table 1, the children from each experiment were similar in age, F (1, 54) = 0.04, p = 0.84, ηp2 < 0.01, and phonological development, F (1, 54) = 2.01, p = 0.16, ηp2 = 0.04. However, children in Experiment 2 had higher vocabulary scores than children in Experiment 1, F (1, 54) = 6.27, p < 0.05, ηp2 = 0.10 for receptive vocabulary and F (1, 54) = 4.34, p < 0.05, ηp2 = 0.07 for expressive vocabulary. This difference in vocabulary scores did not appear to translate into differences in performance on the experimental tasks. Specifically, 60% of children in Experiment 2 met criterion with an average criterion cycle of 4 (SD = 1.9, range 1–6), which was similar to Experiment 1 where 55% of children met criterion with an average criterion cycle of 4 (SD = 1.8, range 1–6).
Stimuli
Phonotactic probability and neighborhood density were computed following the methods of Experiment 1. Percentiles for the full pool of CVCs were used to define sparse (i.e., 10th – 25th percentile) versus dense neighborhoods (i.e., 50th – 75th percentile for both positional segment sum and biphone sum) and mid phonotactic probability (i.e., 50th percentile +/− ½ standard deviation). Characteristics of the selected nonwords are shown in Table 2. Five nonwords from sparse neighborhoods were selected followed by five nonwords from dense neighborhoods that were matched in phonotactic probability to the sparse nonwords. Computations based on the child corpus resulted in similar classification of the stimuli as sparse and dense but poorer matching of phonotactic probability (see Table 2). Stimuli were recorded by a female native speaker of American English and intelligibility was verified by two transcribers blind to the intended target. The nonobjects from Experiment 1 and the procedures for pairing nonwords with nonobjects were used in this experiment.
Procedures
Procedures were identical to Experiment 1. Criterion cycles and proportion of children meeting criterion are shown in Table 3. As in Experiment 1, training extended over a period of two days for the majority of children (88%). Like Experiment 1, the retention referent identification task was administered approximately one-week (M = 8 days, SD = 3, range 7–18) after completion of training.
Results
As in Experiment 1, proportion correct in the referent identification task was compared following training (i.e., criterion/last cycle; retention test) to proportion correct prior to training (i.e., baseline) to determine whether significant learning had occurred on this task. Proportion correct at criterion/last cycle (M = 0.41, SD = 0.24) was significantly higher than proportion correct at baseline (M = 0.14, SD = 0.10), F (1, 24) = 24.92, p < 0.001, ηp2 = 0.51, indicating significant learning. Likewise, proportion correct at the retention test (M = 0.43, SD = 0.23) was significantly higher than proportion correct at baseline (M = 0.14, SD = 0.10), F (1, 24) = 36.74, p < 0.001, ηp2 = 0.61.
To address the primary research question, proportion of correct responses in the referent identification task was submitted to a 2 (neighborhood density: sparse vs. dense) × 2 (time: criterion/last cycle vs. retention test) repeated measures analysis of variance. Results are shown in Figure 2, which also includes the baseline test point as a reference for chance performance. There was no significant difference between performance at the criterion/last cycle (M = 0.41, SD = 0.25) and performance at the retention test (M = 0.43, SD = 0.26), F (1, 24) = 0.11, p > 0.70, ηp2 = 0.01, suggesting no loss in performance over the 1-week delay without further training. In terms of neighborhood density, proportion correct for sparse sound sequences (M = 0.44, SD = 0.26) was similar to proportion correct for dense sound sequences (M = 0.41, SD = 0.24), F (1, 24) = 0.39, p > 0.30, ηp2 = 0.02. However, these non-significant main effects were qualified by a significant interaction between neighborhood density and time, F (1, 24) = 8.05, p < 0.01, ηp2 = 0.25 (see Figure 2).
Figure 2.
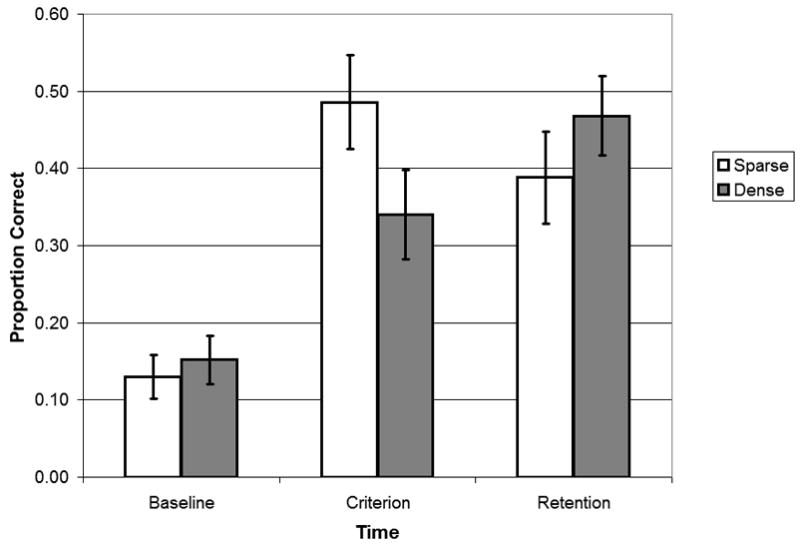
Mean proportion correct for sparse (open bar) versus dense sound sequences (filled bar) on the referent identification task at baseline, criterion, and retention test points. Error bars depict the standard error of the mean.
There are two potential approaches for exploring this interaction. One is to examine the effect of neighborhood density at each time: criterion/last cycle and retention. The other is to examine the effect of time for each level of density: sparse and dense. Both approaches have the potential to be informative. The first examines when in acquisition differences arise between sparse and dense nonwords, whereas the second addresses how acquisition of sparse verses dense nonwords changes over time. Pursuing both approaches may yield a fuller understanding of the interaction between neighborhood density and time. In terms of the first approach, proportion correct for sparse nonwords (M = 0.49, SD = 0.31) was significantly higher than proportion correct for dense nonwords (M = 0.34, SD = 0.29) at the criterion/last cycle, F (1, 24) = 4.64, p < 0.05, ηp2 = 0.16. In contrast, proportion correct for sparse nonwords (M = 0.39, SD = 0.30) was similar to proportion correct for dense nonwords (M = 0.47, SD = 0.26) at the retention test, F (1, 24) = 1.53, p > 0.20, ηp2 = 0.06. To summarize, sparse nonwords appear to be learned more accurately than dense nonwords immediately following training but this initial difference is not apparent 1-week later.
In terms of the second approach, sparse nonwords showed minimal change over time. Specifically, proportion correct at the criterion/last cycle (M = 0.49, SD = 0.31) was similar to proportion correct at the retention test (M = 0.39, SD = 0.30) for sparse nonwords, with the trend being for a decrease rather than an increase in performance, F (1, 24) = 2.34, p > 0.10, ηp2 = 0.09. In contrast, dense nonwords improved over time. Specifically, proportion correct at the retention test (M = 0.47, SD = 0.26) was significantly higher than proportion correct at the criterion/last cycle test (M = 0.34, SD = 0.29) for dense nonwords, F (1, 24) = 5.33, p< 0.05, ηp2 = 0.18. In summary, performance for dense nonwords appeared to improve over a 1-week interval with no additional training, whereas performance for sparse nonwords did not improve during this same interval.
Discussion
The effect of neighborhood density on word learning depended on the time of test. Specifically, sparse nonwords were responded to with greater accuracy than dense nonwords immediately upon completion of training. Sparse nonwords appeared to be retained over the 1-week period without training, although there was a non-significant trend for decrements in performance. In contrast, dense nonwords showed clear improvements in performance over the 1-week period without additional training. This pattern suggest that neighborhood density influences multiple cognitive processes underlying lexical acquisition and that the optimal density condition (i.e., sparse vs. dense) depends on the specific cognitive process.
The early effect of sparse neighborhoods on lexical acquisition may be consistent with an influence on triggering. Specifically, upon hearing a novel word in a sparse neighborhood, few existing lexical representations will be activated. In contrast, hearing a novel word in a dense neighborhood will activate many more existing lexical representations. Consequently, the mismatch between the input and existing representations likely is maximized for sparse neighborhoods compared to dense neighborhoods. This likely leads to allocation of a new representation for a sparse neighborhood but perhaps not for a dense neighborhood, which allows the learner to capitalize on the earliest exposures to a novel word in a sparse neighborhood but not in a dense neighborhood.
The early effect of sparse neighborhoods on lexical acquisition could be consistent with an influence on configuration because of the timing of the effect, but the direction of the effect makes this hypothesis less likely. Previously, working memory was argued to be critical during configuration because the sound sequence input needed to be accurately held in working memory so that an accurate and detailed representation could be created in long-term memory. Past research suggests that sound sequences from sparse neighborhoods are not maintained in working memory as accurately as sound sequences from dense neighborhoods (Roodenrys & Hinton, 2002; Thomson et al., 2005; Thorn & Frankish, 2005). Thus, the direction of the effect of neighborhood density is inconsistent with an account that appeals to configuration.
Turning to the later effect of dense neighborhoods, the timing of this effect is inconsistent with an account that would appeal to triggering or configuration. These two processes are hypothesized to occur during training when the input is present, but the performance improvements associated with dense neighborhoods were observed after a delay without training. Consequently, the later effect of dense neighborhoods suggests an influence on engagement, a process that is proposed to occur in the absence of input during memory consolidation. Recall that memory consolidation yields a stable representation that can be retained over time and resist interference. The results suggest that engagement occurs for the new lexical representations of both sparse and dense nonwords but that the number of existing representations, namely the density, determines the benefit. In terms of the sparse nonwords, the new lexical representation will be integrated with few similar existing representations. This may provide enough stabilization of the new representation to support retention over a delay. This hypothesis is consistent with the non-significant change in accuracy for sparse nonwords from the immediate test to the retention test. Turning to the dense nonwords, the new lexical representation will be integrated with many similar existing representations. This likely provides greater stabilization and strengthening of the new representation, which is consistent with the significant improvement in accuracy for dense nonwords over the delay. Across these two scenarios, it is proposed that the time course of engagement was similar for sparse and dense nonwords but the outcome of engagement in terms of stabilizing the new representation was dependent on the number of existing representations. This hypothesis warrants direct testing. Previous studies of engagement have examined when in learning the new lexical representation influences processing of existing representations (Dumay & Gaskell, 2007; Gaskell & Dumay, 2003; Leach & Samuel, 2007). A study examining whether the new representation of both the sparse and dense nonwords influence processing of existing representations at a similar time point would substantiate the claim that the time course of engagement is similar for sparse and dense nonwords.
General Discussion
Results across experiments indicated that both phonotactic probability and neighborhood density influenced lexical acquisition by children. However, the cognitive processes by which each variable influenced lexical acquisition were hypothesized to differ. Specifically, it was argued that phonotactic probability influenced triggering of lexical acquisition with rare sound sequences facilitating the detection of a mismatch between the input and existing representations. It was further argued that this initial advantage was maintained over time. Interestingly, neighborhood density appeared to have a more varied role in lexical acquisition, influencing multiple processes. In terms of the first process, neighborhood density appeared to influence triggering of lexical acquisition with sparse neighborhoods facilitating the detection of a mismatch between the input and existing representations. In terms of the second process, neighborhood density influenced engagement. In particular, integration with many existing representations, as in a dense neighborhood, improved retention. These hypotheses warrant direct empirical testing using methods that are differentially sensitive to triggering versus configuration versus engagement (e.g., Gaskell & Dumay, 2003; Leach & Samuel, 2007; Merriman & Marazita, 1995).
Findings from the current experiments may appear to be at odds with those from past studies of correlated phonotactic probability and neighborhood density (Storkel, 2001, 2003, 2004a; Storkel & Maekawa, 2005), although they generally converge with those of studies differentiating phonotactic probability and neighborhood density (Storkel, 2009; Storkel et al., 2006). Past studies of correlated phonotactic probability and neighborhood density have tended to show greater accuracy for learning of common sound sequences in dense neighborhoods than rare sound sequences in sparse neighborhoods. It is difficult to account for this discrepancy in the absence of further empirical evidence; however, there are several issues that need to be addressed in future investigations. In particular, the current experiments investigated each variable while the other was held constant. This removes the interactive effects of the two variables. It is quite possible that when both variables are manipulated in tandem, interactive effects arise, leading to a different pattern than would be expected from a simple combination of independent effects. Further complicating this issue is that different combinations of phonotactic probability and neighborhood density could facilitate different cognitive processes that underlie lexical acquisition. For example, rare sound sequences and sparse neighborhoods could converge to facilitate triggering of lexical acquisition because this combination would result in the lowest activation of the fewest existing representations, speeding detection of mismatch between the input and existing representations. In contrast, common sound sequences and dense neighborhoods might converge to facilitate configuration because this combination would result in the most accurate maintenance of the sound sequence in working memory (Gathercole et al., 1999; Roodenrys & Hinton, 2002; Thomson et al., 2005; Thorn & Frankish, 2005), leading to the creation of a more accurate and detailed lexical representation. There likely are other alternative hypotheses. The point is that future research needs to systematically vary phonotactic probability and neighborhood density in paradigms that are differentially sensitive to the cognitive processes that underlie acquisition (i.e., triggering, configuration, and engagement).
Conclusion
The present results support the idea that lexical acquisition is a dynamic process involving several cognitive processes (i.e., triggering, configuration, engagement). Moreover, the findings suggest that characteristics of novel words, such as phonotactic probability and neighborhood density, dictate how existing representations affect this dynamic process, influencing which words are acquired more readily. Additional research is needed to unpack the complex relationship between word characteristics and lexical acquisition.
Acknowledgments
This research was supported by NIH Grants DC08095, DC 05803, and HD02528. We would like to thank the staff of the Word and Sound Learning Lab for their contributions to stimulus creation, data collection, data processing, and reliability calculations; and the parents and children who participated.
References
- ASHA. Guidelines for screening for hearing impairment-preschool children, 3–5 years. Asha. 1997;4:IV-74cc–IV-74ee. [Google Scholar]
- Capone NC, McGregor KK. The effect of semantic representation on toddlers’ word retrieval. Journal of Speech, Language, and Hearing Research. 2005;48:1468–1480. doi: 10.1044/1092-4388(2005/102). [DOI] [PubMed] [Google Scholar]
- Carpenter GA, Grossberg S. A massively parallel architecture for a self-organizing neural pattern recognition machine. Computer, Vision, Graphics, and Image Processing. 1987;37:54–115. [Google Scholar]
- Cohen J. Statistical power analysis for the behavioral sciences. 2. Hillsdale, NJ: Lawrence Erlbaum Associates; 1988. [Google Scholar]
- Davis MH, Gaskell MG. A complementary systems account of word learning: Neural and behavioural evidence. Philosophical Transactions of the Royal Society B. 2009;364:3773–3800. doi: 10.1098/rstb.2009.0111. [DOI] [PMC free article] [PubMed] [Google Scholar]
- Dell GS. The retrieval of phonological forms in production: Tests of predictions from a connectionist model. Journal of Memory and Language. 1988;27:124–142. [Google Scholar]
- Dumay N, Gaskell MG. Sleep-associated changes in the mental representation of spoken words. Psychological Science. 2007;18:35–39. doi: 10.1111/j.1467-9280.2007.01845.x. [DOI] [PubMed] [Google Scholar]
- Dunn LM, Dunn LM. Peabody picture vocabulary test. 3. Circle Pines, MN: American Guidance Service; 1997. [Google Scholar]
- Edwards J, Beckman M, Munson B. The interaction between vocabulary size and phonotactic probability effects on children’s production accuracy and fluency in nonword repetition. Journal of Speech, Language and Hearing Research. 2004;47:421–436. doi: 10.1044/1092-4388(2004/034). [DOI] [PubMed] [Google Scholar]
- Garlock VM, Walley AC, Metsala JL. Age-of-acquisition, word frequency, and neighborhood density effects on spoken word recognition by children and adults. Journal of Memory and Language. 2001;45:468–492. [Google Scholar]
- Gaskell MG, Dumay N. Lexical competition and the acquisition of novel words. Cognition. 2003;89:105–132. doi: 10.1016/s0010-0277(03)00070-2. [DOI] [PubMed] [Google Scholar]
- Gathercole SE, Baddeley AD. Evaluation of the role of phonological STM in the development of vocabulary in children: A longitudinal study. Journal of Memory and Language. 1989;28:200–213. [Google Scholar]
- Gathercole SE, Baddeley AD. The role of phonological memory in vocabulary acquisition: A study of young children learning new names. British Journal of Psychology. 1990;81:439–454. [Google Scholar]
- Gathercole SE, Frankish CR, Pickering SJ, Peaker S. Phonotactic influences on short-term memory. Journal of Experimental Psychology: Learning, Memory, and Cognition. 1999;25:84–95. doi: 10.1037//0278-7393.25.1.84. [DOI] [PubMed] [Google Scholar]
- Gathercole SE, Willis CS, Emslie H, Baddeley AD. Phonological memory and vocabulary development during the early school years: A longitudinal study. Developmental Psychology. 1992;28:887–898. [Google Scholar]
- Gershkoff-Stowe L. Object naming, vocabulary growth, and the development of word retrieval abilities. Journal of Memory and Language. 2002;46:665–687. [Google Scholar]
- Goldman R, Fristoe M. Goldman-Fristoe Test of Articulation-2. Circles Pines, MN: American Guidance Service; 2000. [Google Scholar]
- Gupta P, MacWhinney B. Vocabulary acquisition and verbal short-term memory: Computational and neural bases. Brain and Language. Special Issue: Computer models of impaired language. 1997;59:267–333. doi: 10.1006/brln.1997.1819. [DOI] [PubMed] [Google Scholar]
- Kroll JF, Potter MC. Recognizing words, pictures, and concepts: A comparison of lexical, object, and reality decisions. Journal of Verbal Learning & Verbal Behavior. 1984;23:39–66. [Google Scholar]
- Leach L, Samuel AG. Lexical configuration and lexical engagement: When adults learn new words. Cognitive Psychology. 2007;55:306–353. doi: 10.1016/j.cogpsych.2007.01.001. [DOI] [PMC free article] [PubMed] [Google Scholar]
- Levelt WJM. ACL-MIT Press series in natural-language processing. xiv. Cambridge, MA, US: The MIT Press; 1989. Speaking: From intention to articulation; p. 566. [Google Scholar]
- Li P, Farkas I, MacWhinney B. Early lexical development in a self-organizing neural network. Neural Networks. 2004:1345–1362. doi: 10.1016/j.neunet.2004.07.004. [DOI] [PubMed] [Google Scholar]
- Luce PA, Goldinger SD, Auer ET, Jr, Vitevitch MS. Phonetic priming, neighborhood activation, and PARSYN. Perception & Psychophysics. 2000;62:615–625. doi: 10.3758/bf03212113. [DOI] [PubMed] [Google Scholar]
- Magnuson JS, Tanenhaus MK, Aslin RN, Dahan D. The time course of spoken word learning and recognition: Studies with artificial lexicons. Journal of Experimental Psychology: General. 2003;132:202–227. doi: 10.1037/0096-3445.132.2.202. [DOI] [PubMed] [Google Scholar]
- McClelland JL, Elman JL. The TRACE model of speech perception. Cognitive Psychology. 1986;18:1–86. doi: 10.1016/0010-0285(86)90015-0. [DOI] [PubMed] [Google Scholar]
- Merriman WE, Marazita JM. The effect of hearing similar-sounding words on young 2-year-olds’ disambiguation of novel noun reference. Developmental Psychology. 1995;31:973–984. [Google Scholar]
- Metsala JL. An examination of word frequency and neighborhood density in the development of spoken-word recognition. Memory and Cognition. 1997;25:47–56. doi: 10.3758/bf03197284. [DOI] [PubMed] [Google Scholar]
- Metsala JL, Walley AC. Spoken vocabulary growth and the segmental restructuring of lexical representations: Precursors to phonemic awareness and early reading ability. In: Metsala JL, Ehri LC, editors. Word recognition in beginning literacy. Hillsdale, NJ: Erlbaum; 1998. pp. 89–120. [Google Scholar]
- Munson B, Swenson CL, Manthei SC. Lexical and phonological organization in children: Evidence from repetition tasks. Journal of Speech, Language and Hearing Research. 2005;48:108–124. doi: 10.1044/1092-4388(2005/009). [DOI] [PubMed] [Google Scholar]
- Nelson DL, Schreiber TA. Word concreteness and word structure as independent determinants of recall. Journal of Memory and Language. 1992;31:237–260. [Google Scholar]
- Newman RS, German DJ. Life span effects of lexical factors on oral naming. Language and Speech. 2005;48:123–156. doi: 10.1177/00238309050480020101. [DOI] [PubMed] [Google Scholar]
- Norris D. Shortlist: A connectionist model of continuous speech recognition. Cognition. 1994;52:189–234. [Google Scholar]
- Nusbaum HC, Pisoni DB, Davis CK. Research on Spoken Language Processing Report No. 10. Bloomington, IN: Speech Research Laboratory, Indiana University; 1984. Sizing up the Hoosier mental lexicon; pp. 357–376. [Google Scholar]
- Roodenrys S, Hinton M. Sublexical or lexical effects on serial recall of nonwords? Journal of Experimental Psychology: Learning, Memory, and Cognition. 2002;28:29–33. doi: 10.1037//0278-7393.28.1.29. [DOI] [PubMed] [Google Scholar]
- Smit AB, Hand L, Freilinger JJ, Bernthal JE, Bird A. The Iowa articulation norms project and its Nebraska replication. Journal of Speech and Hearing Disorders. 1990;55:779–798. doi: 10.1044/jshd.5504.779. [DOI] [PubMed] [Google Scholar]
- Storkel HL. Learning new words: Phonotactic probability in language development. Journal of Speech, Language, and Hearing Research. 2001;44:1321–1337. doi: 10.1044/1092-4388(2001/103). [DOI] [PubMed] [Google Scholar]
- Storkel HL. Learning new words II: Phonotactic probability in verb learning. Journal of Speech, Language, and Hearing Research. 2003;46:1312–1323. doi: 10.1044/1092-4388(2003/102). [DOI] [PubMed] [Google Scholar]
- Storkel HL. Do children acquire dense neighborhoods? An investigation of similarity neighborhoods in lexical acquisition. Applied Psycholinguistics. 2004a;25:201–221. [Google Scholar]
- Storkel HL. Methods for minimizing the confounding effects of word length in the analysis of phonotactic probability and neighborhood density. Journal of Speech, Language, and Hearing Research. 2004b;47:1454–1468. doi: 10.1044/1092-4388(2004/108). [DOI] [PubMed] [Google Scholar]
- Storkel HL. Developmental differences in the effects of phonological, lexical and semantic variables on word learning by infants. Journal of Child Language. 2009;36:291–321. doi: 10.1017/S030500090800891X. [DOI] [PMC free article] [PubMed] [Google Scholar]
- Storkel HL, Adlof SM. Adult and child semantic neighbors of the Kroll and Potter (1984) nonobjects. Journal of Speech, Language and Hearing Research. 2009a;52:289–305. doi: 10.1044/1092-4388(2009/07-0174). [DOI] [PMC free article] [PubMed] [Google Scholar]
- Storkel HL, Adlof SM. The effect of semantic set size on word learning by preschool children. Journal of Speech, Language and Hearing Research. 2009b;52:306–320. doi: 10.1044/1092-4388(2009/07-0175). [DOI] [PMC free article] [PubMed] [Google Scholar]
- Storkel HL, Armbruster J, Hogan TP. Differentiating phonotactic probability and neighborhood density in adult word learning. Journal of Speech, Language, and Hearing Research. 2006;49:1175–1192. doi: 10.1044/1092-4388(2006/085). [DOI] [PMC free article] [PubMed] [Google Scholar]
- Storkel HL, Hoover JR. An on-line calculator to compute phonotactic probability and neighborhood density based on child corpora of spoken American English. 2009 doi: 10.3758/BRM.42.2.497. Manuscript submitted for publication. [DOI] [PMC free article] [PubMed] [Google Scholar]
- Storkel HL, Maekawa J. A comparison of homonym and novel word learning: The role of phonotactic probability and word frequency. Journal of Child Language. 2005;32:827–853. doi: 10.1017/s0305000905007099. [DOI] [PMC free article] [PubMed] [Google Scholar]
- Tamminen J, Gaskell MG. Newly learned spoken words show long-term lexical competition effects. Q J Exp Psychol (Colchester) 2008;61:361–371. doi: 10.1080/17470210701634545. [DOI] [PubMed] [Google Scholar]
- Thomson JM, Richardson U, Goswami U. Phonological similarity neighborhoods and children’s short-term memory: typical development and dyslexia. Memory & Cognition. 2005;33:1210–1219. doi: 10.3758/bf03193223. [DOI] [PubMed] [Google Scholar]
- Thorn AS, Frankish CR. Long-term knowledge effects on serial recall of nonwords are not exclusively lexical. Journal of Experimental Psychology: Learning, Memory, and Cognition. 2005;31:729–735. doi: 10.1037/0278-7393.31.4.729. [DOI] [PubMed] [Google Scholar]
- Vitevitch MS. The neighborhood characteristics of malapropisms. Language and Speech. 1997;40:211–228. doi: 10.1177/002383099704000301. [DOI] [PubMed] [Google Scholar]
- Vitevitch MS. The influence of phonological similarity neighborhoods on speech production. Journal of Experimental Psychology: Learning, Memory, and Cognition. 2002a;28:735–747. doi: 10.1037//0278-7393.28.4.735. [DOI] [PMC free article] [PubMed] [Google Scholar]
- Vitevitch MS. Naturalistic and experimental analyses of word frequency and neighborhood density effects in slips of the ear. Language and Speech. 2002b;45:407–434. doi: 10.1177/00238309020450040501. [DOI] [PMC free article] [PubMed] [Google Scholar]
- Vitevitch MS. The influence of sublexical and lexical representations on the processing of spoken words in English. Clinical Linguistics & Phonetics. 2003;17:487–499. doi: 10.1080/0269920031000107541. [DOI] [PMC free article] [PubMed] [Google Scholar]
- Vitevitch MS, Armbruster J, Chu S. Sublexical and lexical representations in speech production: Effects of phonotactic probability and onset density. Journal of Experimental Psychology: Learning, Memory, and Cognition. 2004;30:1–16. doi: 10.1037/0278-7393.30.2.514. [DOI] [PubMed] [Google Scholar]
- Vitevitch MS, Luce PA. When words compete: Levels of processing in perception of spoken words. Psychological Science. 1998;9:325–329. [Google Scholar]
- Vitevitch MS, Luce PA. Probabilistic phonotactics and neighborhood activation in spoken word recognition. Journal of Memory of Language. 1999;40:374–408. [Google Scholar]
- Vitevitch MS, Luce PA, Pisoni DB, Auer ET. Phonotactics, neighborhood activation, and lexical access for spoken words. Brain and Language. Special Issue: Mental lexicon. 1999;68:306–311. doi: 10.1006/brln.1999.2116. [DOI] [PMC free article] [PubMed] [Google Scholar]
- Williams KT. Expressive vocabulary test. Circle Pines, MN: American Guidance Services, Inc; 1997. [Google Scholar]
- Zamuner TS, Gerken L, Hammond M. Phonotactic probabilities in young children’s speech production. Journal of Child Language. 2004;31:515–536. doi: 10.1017/s0305000904006233. [DOI] [PubMed] [Google Scholar]