

Abstract
Tracking data flow in high throughput sequencing is important in maintaining a consistent number of successfully sequenced samples, making decisions on scheduling the flow of sequencing steps, resolving problems at various steps and tracking the status of different projects. This is especially critical when the laboratory is handling a multitude of projects. We have built a Web-based data flow tracking package, called Kaleidaseq, which allows us to monitor the flow and quality of sequencing samples through the steps of preparation of library plates, plaque-picking, preparation of templates, conducting sequencing reactions, loading of samples on gels, base-calling the traces, and calculating the quality of the sequenced samples. Kaleidaseq’s suite of displays allows for outstanding monitoring of the production sequencing process. The online display of current information that Kaleidaseq provides on both project status and process queues sorted by project enables accurate real-time assessment of the necessary samples that must be processed to complete the project. This information allows the process manager to allocate future resources optimally and schedule tasks according to scientific priorities. Quality of the sequenced samples can be tracked on a daily basis, which allows the sequencing laboratory to maintain a steady performance level and quickly resolve dips in quality. Kaleidaseq has a simple easy-to-use interface that allows access to all major functions and process queues from one Web page. This software package is modular and designed to allow additional processing steps and new monitoring variables to be added and tracked with ease. Access to the underlying relational database is through the Perl DBI interface, which allows for the use of different relational databases. Kaleidaseq is available for free use by the academic community from http://www.cshl.org/kaleidaseq.
With the scale-up of sequencing efforts to unprecedented levels in genome centers around the world (Boguski et al. 1996; Marshall and Pennisi 1996), the need for scalable information systems to keep track of the flow of samples through the production pipeline of sequencing becomes more and more critical. Our laboratory is a member of a consortium whose mission is to sequence >6 Mb of chromosomes IV and V of Arabidopsis thaliana. Currently, our laboratory is processing 1000–2000 samples per week. This may increase in the future. Typically in the production pipeline of a large-scale sequencing facility, the samples go through the steps of making subclone libraries, making agar plates of bacteria infected with insert-carrying phage, picking of plaques, preparing template DNA for sequencing, conducting sequencing reactions, gel loading, calling of bases, and monitoring the quality of the sequenced samples. Several large insert clones, such as bacterial artificial chromosomes (BACs), as well as libraries of sequence-tagged site (STSs), expressed sequence tags (ESTs), and cDNAs, are sequenced concurrently. Typically, there are lag times of days between the preparing of plaques and final processing of the sequenced samples. During this time decisions need to be made about scheduling of the various steps and allocation of resources among these multiple projects depending on the samples that are already waiting in the queue at various steps. For example, by monitoring the number of samples incorporated in the assembly, the average coverage (number of bases sequenced per base of the assembled consensus sequence) and the number of samples waiting in the queue for a particular project, decisions can be made on how many additional plates of phage-infected bacteria need to be prepared. The quality of the sequenced samples needs to be monitored on a daily basis to allow rapid identification and resolution of problems. The sequencing success rate of the sequenced samples depends on a large number of variables present in each previous procesing step. When failure in sequencing occurs, the correlation of the failures with respect to the different variables that affect the quality needs to be determined as part of the trouble-shooting process. The large number of samples flowing through the pipeline demands an ability to pinpoint the causes of failures quickly and accurately, thereby returning large savings in money and effort.
An information system that tracked the process queues and quality of samples through the production pipeline would be very useful to large and medium scale sequencing laboratories. At present, a few commercial data flow management software systems are available such as BIOLIMS from Applied Biosystems and Gene Mill from Pangea Systems. T.M. Smith et al. (1997) recently described a software package called Hopper for automating data tracking and flow in DNA sequencing (available from the Web site: http://bozeman.mbt.washington.edu/docs/hopper/index.html). Hopper can be used for storage and organization of sequence chromatogram files on UNIX workstations, and generation of quality reports. We were interested in building a more comprehensive system that would be able to track in detail the steps before the processing of chromatograms. Several design considerations were important in the overall design of the system.
It was crucial that the system be modular. The system should be extensible and allow new processing steps to be added and new data to be tracked.
The user interface should be simple because those using the system will not necessarily be software proficient, and it was necessary to shield the users from complications of the underlying operating system.
The system should be platform independent because we had multiple desktop personal computers and workstations running different operating systems that we wanted to use for data entry and output.
We wanted to have a database structure that was efficient in performance and allowed for fast, complex queries so that we could track the queue of samples waiting in each step, extract reports that summarized the flow of each sample through the various steps, extract summary reports on a per project basis, and monitor quality on a daily basis.
To address these issues we elected to create a Web application that is based on a three-tier structure: a front-end Web-based user interface, a back-end relational database, and a mid-layer application that interacts with the user interface and the database. The flexibility of graphic and textual expressiveness of the World Wide Web Interface, the simplicity of use, the standardization of the presentation markup language, the widespread deployment of standard browser clients on virtually every desktop, and the ability of the browser to communicate with an application running on the server through the CGI interface, made a Web-based interface a natural choice for our application. A relational database offers fast performance and the ability to create complex queries that can easily extract data from the database. We called the resulting modular, easy-to-use, and extensible Web-based application that tracks and monitors the sequencing flow process Kaleidaseq.
Conceptual Design Framework
The problem at hand, tracking the flow of samples through a sequence of processing steps, lends itself very naturally to an object-oriented data model. Each distinct processing step can be isolated as a self-contained and independent operation, which is called as an unit operation. The concept of breaking up a sequence of processing steps as distinct unit operations is pervasive in chemical and process engineering (McCabe et al. 1993). Large chemical plants are modeled with a set of few basic unit operations. The interconnections between different unit operations are handled by simple input–output–accumulation models. The entity or entities of interest (chemicals, samples, reactants, etc.) enter, accumulate within, and exit the unit operation. An entity may be consumed within one unit operation and a new entity can be created. Each unit operation is designed independently of the other, and can be linked with other unit operations in an arbitrary order. Using this design philosophy, we chose to divide the series of steps involved in sequencing into individual unit operations. Each unit operation revolves around the processing of one central entity that enters the unit operation, accumulates in a queue, and finally exits the unit operation when it is processed by the subsequent unit operation.
Functionality of Kaleidaseq
Kaleidaseq divides the flow of sequencing steps in the production pipeline into a seven unit operations: Project Registry, Library, Library Plates, Plaque Boxes, Templated Plates, Reacted Plates, and Gels. These unit operations track our samples through the steps of registering a new project, preparing libraries, picking plaques, preparing template DNA, reacting the DNA, and loading the sequenced samples on gels. Kaleidaseq consists of a single application called kaleidaseq.cgi, which “glues” together the different unit operations, coded in separate software modules, into one integrated flow system. When the URL for kaleidaseq.cgi is accessed from the Web Browser, the starting screen is displayed (Fig. 1). This screen shows the sample input rate for each operation, the total number of samples in the queue waiting to be processed by the next step, the name of samples in the queue, and a link to add new samples to each operation. The input rate and the queue can represent the combined state of all BACs currently being sequenced or a particular project or a particular team. When the Add link of a particular operation is clicked, Kaleidaseq dynamically generates a spreadsheet-like HTML form. Typically, each operation, at the very least, tracks the date a task is performed, the team performing that task, the BAC project, and the name of the operator. Other tracked information is specific to the operation. In the Gels unit operation, Kaleidaseq takes the name of the first and last samples loaded from particular plates, and automatically calculates the names of all samples to be loaded on the gel. Then, Kaleidaseq saves the sample sheet on any Macintosh on the network as well as prints out a hard copy of the sample sheet. Once the sample sheet is stored on a Macintosh, we can import it directly into the ABI Sequencing software. Kaleidaseq provides automatic expansion of sample ranges in the spreadsheet fields, which significantly shortens data entry time. Wherever applicable, popup menus are provided so that data entry time is shortened, as well as errors in data entry are reduced. Once the data are entered and submitted, Kaleidaseq filters the data automatically and stores them in the correct table in the relational database. As soon as new data are entered in the system, the information about the queues and input rates become available to the entire laboratory.
Figure 1.
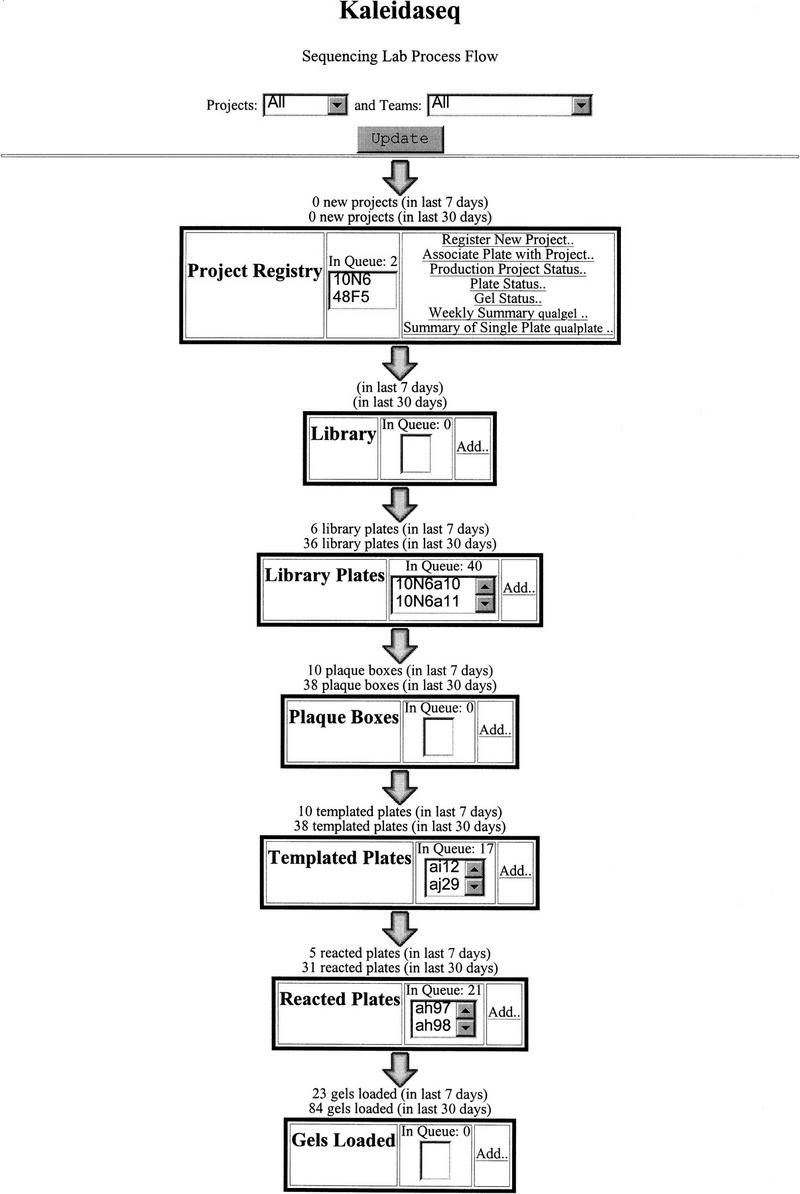
The home page of Kaleidaseq from where all functions can be accessed and process queues monitored.
The Project Registry has links to create several summary reports that are important in monitoring the quality of the sequenced samples and the progress of projects. Running as a command-line script nightly, Kaleidaseq extracts important project parameters, such as coverage, and total reads in assembly from the database created by the assembly program XGAP and stores that information in the Kaleidaseq database. A separate script called APP, which currently runs on the UNIX command line, uses PHRED (B. Ewing and P. Green, unpubl.) to do base-calling on folders of trace files, extracts the read length of each base from a file generated by PHRED and stores these data in the database, which is used later for quality monitoring. The project status report shown in Figure 2 lists for each project the total number of plates waiting in the queue, the total number of plates that have been processed, and the project statistics. By monitoring the total number of reads already sequenced, the coverage that has been achieved, and the total number of plates waiting in the queue, we can schedule the allocation of resources among the different projects in the coming week. We decide how many library plates should be made for each BAC at the beginning of the week and when to shift a BAC project from production to finishing.
Figure 2.

The format of the project status report. The process queues and the total number of samples processed are recalculated each time the page is loaded. The column marked Reads sequenced per 100 kb of consensus is the total number of samples that were sequenced to generate 100 kb of consensus sequence. It is a measure of efficiency of sequencing. The column marked Coverage parameter is the average number of gel characters per base of the consensus sequence.
Ninety-six-well plates are used in the steps of plaque picking, preparing templates, and reacting the DNA. The report on the status of plates displays the flow of plates from the template preparation step to the gel loading step. (Fig. 3) This report allows the technicians to track the status of any plate or set of plates. Plates can be grouped by name, time period, project, team, operator, or the queue status. The quality of any plate, as measured by the success rate and mean read length, is also shown in the report. Therefore, technicians can track the quality of a plate and correlate it to the observations that they have recorded at each step. The report on gel status displays the success rate and mean read length along with other parameters that can affect the quality of a gel such as number of hours of the gel run, source of the gels, length of the gels, and the number of lanes. Gels can be grouped by machine, time period, project, team, or success rate. By observing the difference in patterns of variables between gels that have a high success rate and gels that have a low success rate, we can determine whether any particular variable is affecting the gel run.
Figure 3.

The format of the plate status report. The plates displayed can be filtered according to name (by entering the name that can contain a * wildcard in the name text box), duration (infinity can be entered in the duration text box if no restriction on duration is desired), team, person, and queue status (which takes the value “in queue” and “out of queue”). The columns marked ?, SR, and MRL refer to comments, success rate, and mean read length, respectively.
The success rate of the sequenced samples is tracked on a daily basis with the help of the report on the weekly gel summary. This report displays for the last week and the last month, the total number of samples that were sequenced, the average success rate, the mean read length, and the total number of bases that were sequenced. Tracking this report daily has proved crucial to us in maintaining a steady performance level and quickly resolving dips in quality. To further enhance quality monitoring, the system sends an e-mail message to key personnel when the production sequencing success rate falls below a preset level.
Kaleidaseq is simple to use for persons who are not proficient in computer technology. Kaleidaseq’s suite of displays allows for outstanding monitoring of the production sequencing process. In addition to allowing a rapid identification of production sequence quality problems, the system assists in efficient project management. Kaleidaseq’s ready display of up-to-date information on both project status and process queues sorted by project enables accurate real-time assessment of the necessary samples that must be processed to complete the project. This information allows the process manager to optimally allocate future resources and schedule tasks according to scientific priorities.
System Requirements and Customization of Kaleidaseq
Just as Kaleidaseq is easy to use for the user, it is also designed to be easily modified and extended by software developers. We selected mysql on the World Wide Web running on a Sun Ultra 1 workstation, as our relational database. mysql runs on several UNIX platforms and is available free of charge to the academic community (http://www.tcx.se). In the future, our laboratory plans to move to a Microsoft SQL Server running on a Windows NT platform. Kaleidaseq, itself, is a CGI program (kaleidaseq.cgi) written in Perl that runs in conjunction with a Web server. It can run on any computer that has a Web server supporting the CGI interface that runs Perl. We run Kaleidaseq on a Sun SPARCstation using Netscape’s Enterprise server. Any relational database that supports the Perl DBI interface and has Perl DBD drivers can be used as the back-end database. Most major relational databases, including Oracle, Sybase, Informix, Microsoft SQL server, Microsoft Access, and any ODBC-compliant database, have publicly available Perl database drivers (available from the (http://www.hermetica.com/).
Kaleidaseq uses one core library that was designed to model work-flow processes based on a simple input–output–accumulation model. The Kaleidaseq library automatically generates HTML forms that provide a spreadsheet-like environment to enter data, automatically enters the information in the correct table in the back-end relational database, and updates the queues of the current and the previous operation. Each unit operation of Kaleidaseq is described by a Perl module that uses the core Kaleidaseq library. We have implemented seven Perl modules corresponding to the seven-unit operations. Each HTML link within an unit operation on the front page of Kaleidaseq is handled by one routine within the module. The host application, kaleidaseq.cgi, links together the unit operations in a particular order. New unit operations can be added, old ones can be deleted and the linking order changed simply by altering this code. New parameters can be added to any unit operation. Kaleidaseq is available for free use by the academic community from http://www.cshl.org/kaleidaseq. This site also has a demonstration version of Kaleidaseq and detailed documentation on its installation and use. Software developers can also find documentation on customizing and extending Kaleidaseq.
Conclusions
Kaleidaseq provides a complete, concise, and easily accessible summary of the data flow in a large-scale sequencing setup. Its greatest benefit has been to allow the production coordinators to determine the process queues sorted by project and team, and to monitor the quality in a simple and timely manner. Data are available online as soon as they are entered. The quality monitoring tools that it provides have proved extremely useful to decision makers in resolving slumps in quality and maintaining a stable daily performance level. Kaleidaseq provides a simple interface that can be used by technicians who are not proficient in computers.
Kaleidaseq is based on a clean modular design that allows it to be extended and modified easily. It allows the addition of new processing steps, the deletion of old steps, and the addition of new monitoring variables. Its underlying architecture allows development of new flow monitoring processes with little effort. We intend to use its underlying architecture to implement quality monitoring of finishing and assembly of the final sequence. Kaleidaseq has proved to be a valuable tool in our effort to deliver high-quality genomic sequence at a lower price.
Acknowledgments
We thank the users of Kaleidaseq in our laboratory, Aliyah Hameed, Amy Hasegawa, Arthur Johnson, Emily Ning Huang, Kendall Jensen, Kristin Schutz, Kristina Habermann, Larry Parnell, Lidia Gnoj, Melissa de la Bastide, Muhammad Lodhi, Nadim Shohdy, Nancy Kaplan, Susan Granat, and Tina Gottesman, who helped us to test the software and made numerous helpful suggestions in improving the software. We thank Larry Parnell for his helpful comments on this manuscript. We thank LaDeanna Hillier (Genome Sequencing Center, Washington University, St. Louis) for kindly providing us with versions of her unpublished programs. This material is based on work supported by the joint activity of the National Science Foundation (NSF), the U.S. Department of Agriculture, and the U.S. Department of Energy (DOE) funded under Cooperative Agreement DBI-9632082. Any opinions, findings, and conclusions or recommendations expressed in this material are those of the authors and do not necessarily reflect the views of the NSF, the USDA, and/or the USDOE.
The publication costs of this article were defrayed in part by payment of page charges. This article must therefore be hereby marked “advertisement” in accordance with 18 USC section 1734 solely to indicate this fact.
Footnotes
E-MAIL mccombie@cshl.org; FAX (516) 367-8874.
REFERENCES
- Boguski M, Chakravarti A, Gibbs R, Green E, Myers RM. The end of the beginning: The race to begin human genome sequencing. Genome Res. 1996;6:771–772. doi: 10.1101/gr.6.9.771. [DOI] [PubMed] [Google Scholar]
- Marshall E, Pennisi E. NIH launches the final push to sequence the genome. Science. 1996;272:188–189. doi: 10.1126/science.272.5259.188. [DOI] [PubMed] [Google Scholar]
- McCabe W, Smith J, Hariott P. Unit operations of chemical engineering. 5th ed. New York, NY: McGraw Hill; 1993. [Google Scholar]
- Smith T, Abajian C, Hood L. Hopper: Software for automating data tracking and flow in DNA sequencing. Comput Appl Biosci. 1997;13:175–182. doi: 10.1093/bioinformatics/13.2.175. [DOI] [PubMed] [Google Scholar]