

Abstract
Quantitation of dissolved gases in blood or in other biological media is essential for understanding the dynamics of metabolic processes. Current detection techniques, while enabling rapid and convenient assessment of dissolved gases, provide only direct information on the partial pressure of gases dissolved in the aqueous fraction of the fluid. The more relevant quantity known as gas content, which refers to the total amount of the gas in all fractions of the sample, can be inferred from those partial pressures, but only indirectly through mathematical modeling. Here we describe a simple mass spectrometric technique for rapid and direct quantitation of gas content for a wide range of gases. The technique is based on a mass spectrometer detector that continuously monitors gases that are rapidly extracted from samples injected into a purge vessel. The accuracy and sample processing speed of the system is demonstrated with experiments that reproduce within minutes literature values for the solubility of various gases in water. The capability of the technique is further demonstrated through accurate determination of O2 content in a lipid emulsion and in whole blood, using as little as 20 μL of sample. The approach to gas content quantitation described here should greatly expand the range of animals and conditions that may be used in studies of metabolic gas exchange, and facilitate the development of artificial oxygen carriers and resuscitation fluids.
Keywords: dissolved gases, gas content, mass spectrometry, blood, artificial oxygen carriers, resuscitation fluids
1. INTRODUCTION
The need to monitor dissolved gases in liquids is frequently encountered in many areas of biology and medicine. For instance, electrode and optical techniques have long been used for assessing cellular respiration by probing pO2 and pCO2 in cell cultures [1]. The same technologies are now employed routinely in a clinical setting for determining the partial pressure of the same gases in the circulation using only a few hundred microliters of blood [2]. Mass spectrometry has also emerged as an alternate platform for probing dissolved gases in a technique known as Membrane Inlet Mass Spectrometry or MIMS [3]. A major advantage of MIMS is the ability to sample the partial pressure of a wide range of gases simultaneously. Applications of this technology are exemplified by the works of Seylaz et al [4] to sample the partial pressure of gases in the circulation in real-time, and of Tu et al [5] to monitor the real-time production of NO and N2O3 from nitrite in a hemoglobin containing solution.
One limitation of the techniques described above is their inability to measure directly the gas content of complex fluids, e.g. blood or an emulsion, which contain particles that can also carry gas. In blood, for instance, the overwhelming fraction of oxygen is actually carried in the red blood cells, yet blood gas analyzers can only measure plasma pO2 and pCO2. To determine O2 and CO2 content in whole blood, these techniques rely on mathematical assumptions about the partitioning of those gases in plasma versus hemoglobin. This approach for determining gas content is widely accepted although it is known to fail in cases when hemoglobin’s affinity for gases is altered by e.g. dyshemoglobins [6], by temperature [7], or in cases of blood transfusions, by biochemical degradation of hemoglobin following long term storage of red blood cells [8]. Another need for determining gas content directly relates to our work with resuscitation fluids where lipid emulsions [9] are being developed for the transport of lipophilic gases in the circulation. These emulsions contain two partitions, lipid miscelles dispersed in aqueous media, both of which dissolve lipophilic gases to different extents. Similar difficulties may be encountered when assessing the performance of artificial oxygen carriers, e.g. with perfluorocarbon [10] or hemoglobin based products [11], since their ability to contribute to the oxygen carrying capacity of blood is not reflected in plasma partial pressure readings.
A few mass spectrometric approaches to blood gas analysis have been advanced that circumvent some of these limitations, but at the expense of sample size and convenience. For instance, one method based on the classic Van Slyke gas extraction design was able to quantify absolute gas content from 0.5 mL of blood [12]. The method required elaborate steps to produce a reading, including diluting blood with de-aerated water, freeing the extraction chamber from the previous sample by flushing, and several evacuation operations. The time required to analyze one single sample was 20 minutes. A somewhat different approach to gas extraction from olive oil was advanced by Snedden et al [13], and later used by Ledez et al [14] for the absolute quantitation of blood gases. A single reading could be obtained in 3–5 minutes following this approach, but it required 1–2 mL of blood and cleaning of the apparatus before additional samples can be analyzed.
Here we describe a new mass spectrometric approach that can rapidly and conveniently quantify the gas content in a variety of fluids, including emulsions and blood. The paper is organized as follows. The performance of our system is first validated with experiments that reproduce established values of water solubility coefficients for a variety of gases, including some that cannot be detected electrochemically or spectrophotometrically. The utility of the technique is then demonstrated with experiments that accurately determine oxygen content in an olive oil emulsion and in mouse blood, within 10 minutes and with as little as 20 μl of sample. Finally we discuss how our technique should enable the use of small animals in metabolic gas research, and how it should aid in the development of artificial oxygen carriers and resuscitation fluids.
2. MATERIALS AND METHODS
2.1 Apparatus
The design of our apparatus may be characterized as a non-trapping variation of purge based mass spectrometric approaches, such as the purge-and-membrane approach advanced by Ojala et al [15] for detection of volatile organic compounds, but optimized for rapid and repeated quantitation of gas content in fluids. The system is built around two purge vessels commercially available for the detection of NO-products in liquids [16]. The general approach behind our technique can be summarized as follows. A typical sample of interest contains gases that are equilibrated between a continuous aqueous phase and mixed particles in suspension (Fig. 1-A). This equilibrium can be disrupted as depicted in Fig. 1-B if the sample is suddenly subjected to the purging action of an inert gas, which captures and carries away dissolved gases from the continuous phase. The capture of dissolved gases by inert gas bubbles is particularly effective since most dissolved gases including O2, N2, CO2, NO, N2O, and Ar, have low water-gas partition coefficients, i.e., favor gas over water partitions. Once dissolved gases are removed from the continuous aqueous phase, they are no longer available to diffuse back into cells or particles. Meanwhile, gases still trapped inside cells or particles diffuse out into the continuous phase where they are rapidly captured by inert gas bubbles and driven out into the headspace (Fig. 1C). In this manner all dissolved gases within the original sample are removed and transported away by the purge gas to a mass spectrometer detector (MSD) for differentiation and quantitation.
Figure 1.
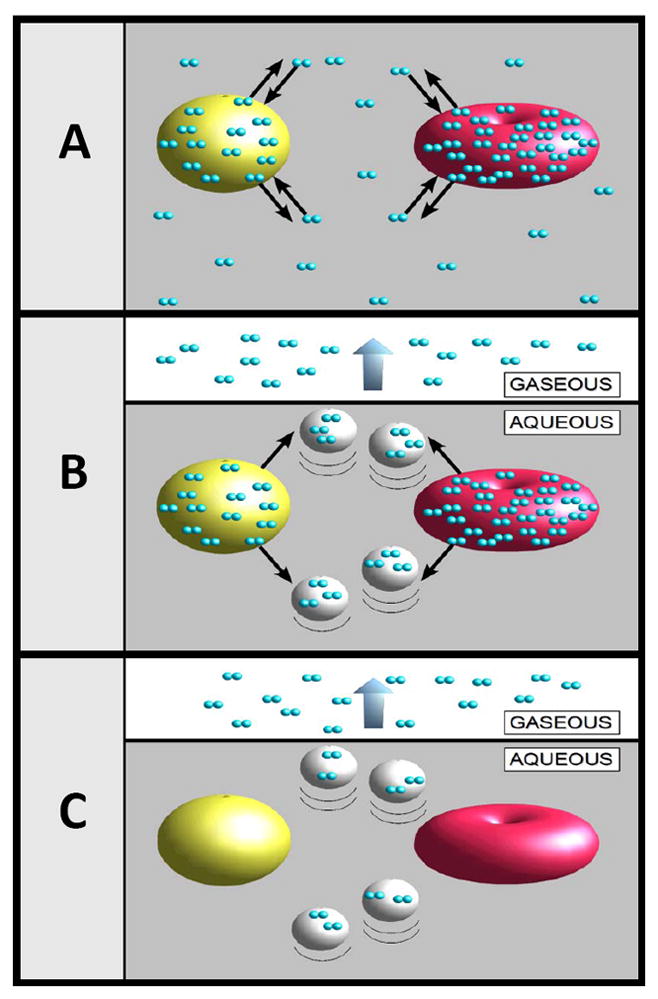
General approach to the measurement of gas content from complex fluids. A) A complex fluid may consist of an aqueous liquid containing different types of particles such as miscelles or cells, all with varying gas affinities. When in equilibrium, gas molecules enter and leave each type of particle at an identical rate. B) When a sample of the fluid is injected into an aqueous solution purged with an inert gas, the bubbling action captures and removes the dissolved gas from the water partition. Unable to uptake new gas molecules, the particles begin to discharge their gas content. C) Eventually all gas content from the particles and the water partition is completely dissipated into the headspace.
The hardware that implements the gas extraction steps described above is a 50 ml Sievers purge vessel (GE Analytical Instruments, Boulder, USA), depicted in Fig. 2 as Purge Vessel 1. This type of vessel is designed to operate at purge gas pressures similar to those encountered at MSD inlets. The vessel is water jacketed and usually operated in our lab at 37°C, although this temperature can be adjusted from room temperature to near 100°C. It is filled here with 40 mL of deionized water that is continuously purged with ultrahigh purity (UHP) helium. The purge gas that extracts dissolved gases also transports them through subsequent conditioning steps discussed below before reaching the MSD. For olive oil emulsions and blood samples, where repeated injections of these fluids can cause foaming, approximately 2 mL of 1/10 dilution of antifoaming agent was added to the purge vessel (Antifoam B Emulsion, Sigma, St. Louis). As much as a couple of milliliters of lipid emulsions or a few hundredths of milliliter of blood can be injected before significant foaming warrants replacement of the purge vessel fluid.
Figure 2.

Schematic of the apparatus developed for rapid extraction of dissolved gases and for their quantitation using mass spectrometry.
The exit side of the Sievers purge vessel contains a built-in condenser that is maintained at near 0°C to recapture moisture released from this vessel. The condenser is mounted vertically so that condensation trickles back into the purge vessel. A second smaller purge vessel (10 ml Sievers purge vessel, GE Analytical Instruments, Boulder, CO, USA) is used optionally for scrubbing the gas stream of potential interfering gases, e.g. CO2 which can interfere with N2O detection since both species have the same molecular mass. CO2 can be scrubbed effectively with the addition of 5 ml of 1 M NaOH solution to the second purge vessel. This vessel is also outfitted with a condenser maintained at near 0°C. Both condensers are chilled by a closed cycle refrigerated recirculator (Neslab CTF-25, Thermo Scientific). Under normal operating conditions the supply pressure to Vessel 1 and the outlet pressure of Vessel 2 are maintained at gauge values of 1.5 and 1 atm, respectively. This combination of pressures maintains a flow rate through the purge vessels of about 100 mL/min and a flow rate into the MSD of 4mL/min. Experience shows that this combination of flow rates provides an optimal signal to noise ratio in our system. Gas flow stability is maintained through the purge vessels with the aid of a mass flow controller (Sierra Instruments, Model 810). Flow regulation helps to maintain background contamination signals at a constant level, which is essential for baseline subtraction.
The MSD used here (5975B XL; Agilent Technologies, CA, USA) employs electron impact ionization and a vacuum system based on a high-volume turbopump (~ 260 L/min). The flow to the MSD is restricted by a 0.25mm ID fused silica gas chromatography (GC) column measuring 7.5 m in length that is maintained at all times at a temperature of 100°C inside an oven (1321F; VWR, West Chester, PA, USA) to prevent accumulation of adsorbed substances. A hole two inches in diameter was bored through the side of the oven to accommodate the MSD inlet. In this report, the MSD is operated in selected ion monitoring (SIM) mode, scanning for masses m/z = 28, 30, 32, 40, and 44, corresponding to the molecular masses associated with N2, NO, O2, Ar, and CO2, respectively. The integration time for each data point was set to 400 ms. Under the pressure and flow conditions specified above, dissolved gas signals are detected at the MSD in 1.5 minutes after injection into Purge Vessel 1 and with a width of about 0.6 minutes (see Figure 3). A shorter transit time of 0.75 minutes and narrower signal of 0.3 minutes can be obtained with a supply pressure to Vessel 1 of 3 atm, although this operating pressure results in diminished peak areas. Overall, the entire system affords a limit of detection of 3 picomoles (abundance ~100) determined by the detection of NO generated from the reduction of nitrite in an ascorbic acid solution [16], and a linear response for abundances up to 107.
Figure 3.
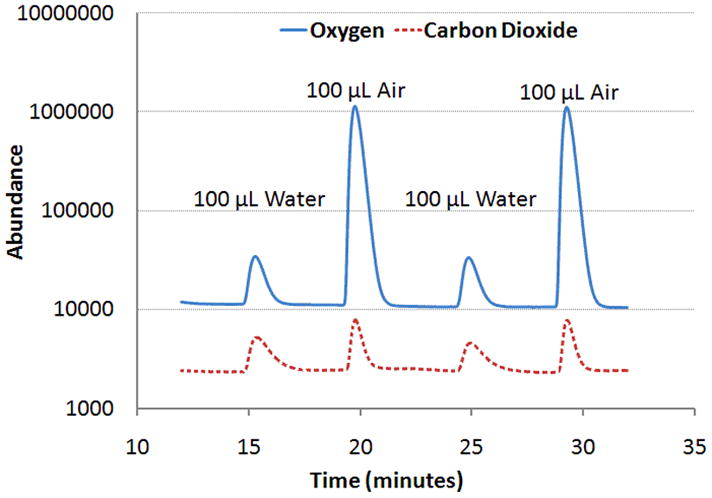
Representative mass chromatogram for m/z = 32 and 44, corresponding to the molecular masses of oxygen and carbon dioxide, respectively. The signals were obtained from 100 μL of water exposed to atmospheric gas at STP.
2.2 Preparation and handling of samples
Deionized H2O (18 MΩ.cm) was used for filling purge vessel 1 and for preparing all of our samples. Lipid emulsions were made from olive oil since the oxygen solubility of this oil is well characterized in published literature [17]. A 20% by-weight emulsion was prepared with 2 g of olive oil, 0.12 g L-a-Phosphatidylcholine Soy-95% (Avanti Polar Lipids, Inc, AL), and 0.25 g glycerol ultra pure grade (MP Biomedical, Inc, OH), with water added to a total volume of 10 mL. The ingredients were mixed inside a 15 mL vial and emulsified in an ice bath using an ultrasound cell disruptor (Misonix XL-2000, Farmingdale, NY) equipped with a 1/8 inch microprobe. Homogeneous emulsification was achieved following continuous sonication at 20 watts for 3–5 minutes. All of the above samples were injected into the purge vessel in volumes of 100 μL using a 100 μL Hamilton syringe. Whole blood was collected from a male C57BL/6 mouse in a heparinized container and kept refrigerated until needed. Injection volumes of blood were limited to 20 μL to demonstrate the utility of the methodology in determining gas content from small blood volumes. All sample injections were followed immediately by injection of a standard, e.g. atmospheric air, and the ratio of the two calculated. This ratioing procedure minimizes the impact of MSD sensitivity drifts that are sometimes observed in our system.
2.3 Gas incubation
All gas incubation steps were conducted at 1 atm and at 25°C except where noted. A consistent protocol was followed for dissolving gases into fluids except for nitric oxide as detailed below. A 200 μL volume of a given fluid was placed inside a 15 mL vial. The container was tilted to increase the surface area of the fluid and the headspace purged for 2 minutes, taking care to not bubble the fluid. The sample was sealed then allowed to reach gas-liquid equilibrium over the course of 60 minutes. To ensure optimal diffusion of gases during this time, the vials were left lying horizontally that the fluid might maintain the greatest possible surface exposure to the gas. The water solubilities of N2, O2, CO2, and Ar, were determined through incubation with atmospheric air, which contains all of these gases. All samples, including water references used for the determination of O2 solubility in an olive oil emulsion and in blood, were incubated with pure oxygen. The levels of O2 after the 60 minute incubation period were observed to diminish due to slow leakage of atmospheric gases back into the vials. The drop was characterized via mass spectrometric analysis of O2 incubated water samples and compared to air incubated samples. The results showed that the O2 content in the headspaces of O2-incubated samples consistently dropped to 80% after 60 minutes.
The solubility of nitric oxide in water was determined using a different procedure due to its reactivity with oxygen. For this gas, a volume of 500 μL of water was placed inside a 15 mL vial, bubbled directly with nitric oxide at a concentration of 100 ppm in helium for a period of 2 minutes, and analyzed immediately thereafter. To assess the extent to which direct bubbling over-saturates aqueous samples we compared the solubility of O2 bubbled samples with those obtained with air incubated ones. Results revealed that direct bubbling lead to a slight (~10%) over-saturation of the gas compared to what is found when the fluid is allowed to equilibrate for 60 minutes with headspace gas.
Finally, we should point out that all of our samples in this work were pre-incubated only for the purpose of comparing our results with previously published work. The absolute gas content of a biological fluid can be determined by direct sampling and injection into the purge vessel, followed immediately by injection of a pre -equilibrated standard (e.g aerated water).
2.4 Mass spectrometric data analysis and statistics
Quantitation of gas content was achieved through integration of the areas under the peaks obtained by mass spectrometry. The integration was derived from curve fits to exponentially modified gaussian shapes using Peakfit (Systat Software, San Jose, USA). The solubility of a particular molecular species in pure water was determined from the ratio of the species content in water to that in the gas that the samples were exposed to (e.g. air, NO/He mixture). This dimensionless ratio was then converted to M/atm using the conversion factor 0.04088 M/atm, a number determined from the ideal gas law at 298.15 K and 1 atmosphere, to obtain Henry’s law constant in a more familiar form. The solubility of O2 in the olive oil emulsion relative to water was determined from the ratio of the O2 content in the emulsion to the content in water incubated under the same conditions (80% O2). For blood, which saturates fully when exposed to such elevated O2 partial pressures, the solubility of the gas was calculated relative to its content in water adjusted by the factor 100/80 so that its magnitude is equivalent to that of water saturated with O2. Values reported here for water, emulsions, and blood solubilities, are reported as means and standard deviations of the mean (standard errors). Our values of Henry’s law constants for gases in water were then compared with those previously reported by others [18–21]. Since direct literature comparisons are not available for the oxygen solubility of 20% olive oil emulsions or blood, those values were estimated by other means described below.
2.5 Calculated values of O2 solubility in olive oil emulsion and in blood
The expected values of O2 solubility in a 20% olive oil emulsion and in mouse blood were estimated through known physical properties of those systems as follows. For the olive oil emulsion, a simple calculation was carried out based on the known partition coefficient of O2 in the oil phase relative to water, which was determined by Battino et al. [17] to have a value of 4.41. Assuming that lecithin and glycerol contribute insignificantly, the emulsion can be modeled as a fluid with two partitions, 21.8% olive oil and 78.2% water by volume. From these two partitions, one can estimate that the O2 carrying capacity of the emulsion relative to water should be 4.41 × (21.8/100) + (78.2/100) = 1.74. For blood, the expected solubility of O2 was determined spectrophotometrically as follows. A 20 μL aliquot of blood taken after O2 incubation was diluted 100 fold in water and its absorption characterized using a Hitachi UV-3000 UV-VIS spectrophotometer. A spectrum spanning 400 to 700 nm was obtained to insure that the dominant species was oxy-hemoglobin. The optical density was obtained at the HbO2 peak 576 nm and this value was divided by the extinction coefficient for HbO2 reported previously for a rodent [22]. The concentration was multiplied by 100 to determine the total concentration of HbO2 in the original blood sample. Finally the oxygen content of the aqueous partition in blood was estimated with the assumption that blood comprises 83% water [23] and that this fraction is saturated with O2, i.e. to a O2 concentration of 1.236 mM [18,20].
3. RESULTS
3.1 Performance with pure water samples
A typical mass spectrometric chromatogram obtained for a pure water sample is shown in Fig 3. The tracings display oxygen and carbon dioxide signals from 100 μL injections of water exposed to atmospheric air and alternated with 100 μL injections of atmospheric air. The data demonstrate that excellent signal to noise ratios, exceeding 1000:1 even for the low-abundance analyte CO2, can be obtained with the small injection volumes used here. Similar traces for N2 and Ar were obtained concomitantly with those for O2 and CO2 (data not shown). Separate measurements for NO also yielded similar data.
The solubilities of the gases in water were determined from the peak areas and the results are summarized in table 1. The results are contrasted with those obtained in previously published studies of gas solubility in water. In general our results were in good agreement with published values, except for the solubility of NO which appeared to be 9 % higher than previously reported. This however was not unexpected in view of our experience that bubbling samples directly with a gas tends to over-saturate them with that gas by about 10 %. Also of notice are the relatively small standard deviation of the means, typically in the range of 2–3% of the mean value for an N=10. Another measure of performance is the detectability of small signals such as those obtained with water exposed to 100 ppm NO. From the solubility measured here, one estimates that the injection volume of water contained only about 20 picomoles of NO. Our apparatus can detect as little as 3 picomoles of NO with a signal to noise ratio of 1 [16]. Since the electron impact ionization cross-section for NO is similar to that of the other gas molecules studied here one expects similar limits of detectability for those as well.
Table 1.
Performance of our methodology with gases dissolved in pure water.
3.2 Performance with an oil emulsion and blood
Figure 4 displays typical signals obtained from injections of emulsions and blood incubated with 80% O2. In general these peaks possess the same shape and width as those observe with water injections. The slight decline in the amplitude of the blood data of Fig. 4B is accompanied by an equal increase in signal duration so the peak areas actually remain constant. Such fluctuations in amplitude/width can arise when slight foaming is formed on the surface of the liquid. Table 2 summarizes the ratios of sample to water signals. The standard deviations of the means are again relatively small compared to the mean values (~1–3%).
Figure 4.
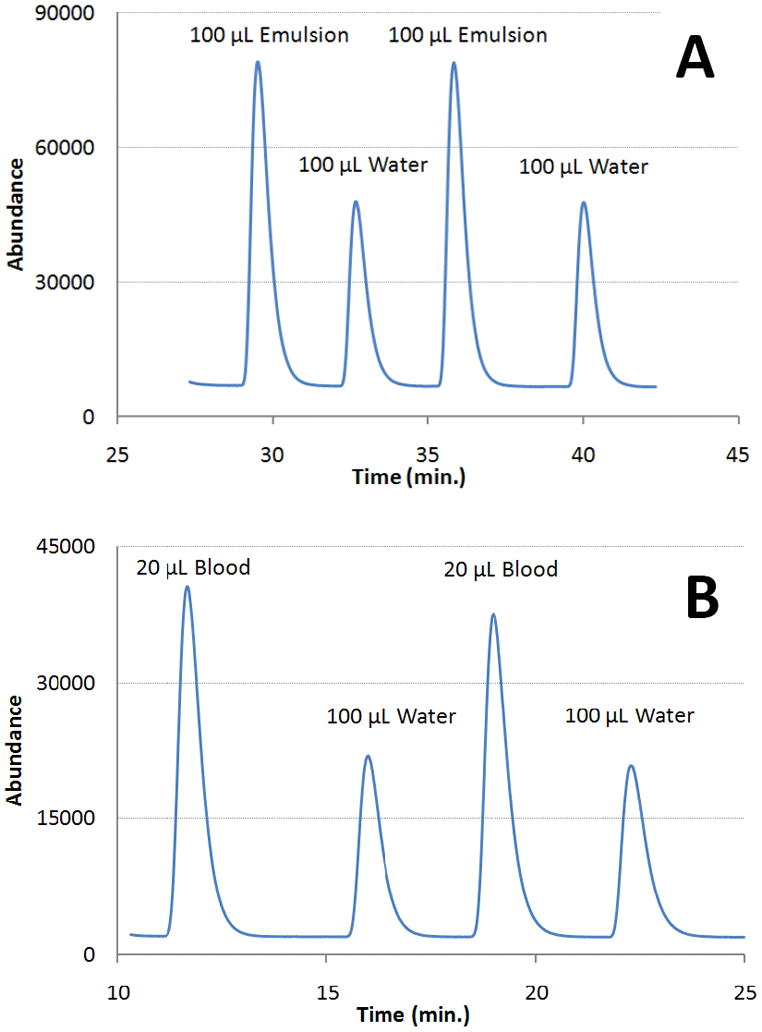
Representative chromatograms that quantify oxygen (m/z=32) content from (A) a 20% olive oil emulsion and (B) from mouse blood. For consistency, all samples including water were incubated for an hour with 100% oxygen prior to injection.
Table 2.
Performance of our methodology with mixed fluids.
| Ratio of fluid O2 to water O2 | ||
|---|---|---|
| Fluid | Measured ratio | Estimated ratio |
| Olive Oil Emulsion | 1.76 ± 0.02 | 1.74 |
| Blood | 8.0 ± 0.2 | 7.6 ± 0.1 |
All values listed under our work represent the mean ± SD of the mean (N=10 for emulsion, N=3 for blood).
The measured solubilities of O2 in an olive oil emulsion and in blood are contrasted with estimated values calculated by independent means as described in Materials and Methods. The agreement between the measured and expected values is particularly remarkable for the olive oil emulsion. One limitation in our blood study is in the use of hemoglobin extinction coefficients for a rat rather than a mouse for the calculation of oxygen content. Hemoglobins from different mammalian species are known to possess somewhat different extinction coefficients [22]. This could account in part for why the oxygen solubility for blood determined mass spectrometrically is somewhat higher than the estimated value derived from spectrophometric measurements.
4. DISCUSSION
The present work demonstrates that gas content can be measured rapidly and accurately with a relatively simple gas purge system connected to a MSD. Unlike previous mass spectrometric approaches, our method requires no cleaning and re-purging of the apparatus before additional specimens can be analyzed. This provides the ability to design experiments that explore the time course of a physiological or pathophysiological response with sampling intervals of a few minutes.
Our mass spectrometric technique offers significant advantages over blood gas analyzers. One advantage is the independence of the technique to sample conditions such as temperature or pH, which affect the response of electrochemical or spectrophotometric approaches. Additionally, our mass spectrometric approach allows one to monitor a wider spectrum of dissolved gases, including N2, Ar, and N2O, which are not detected by blood gas analyzers. Mass spectrometric detection also enables isotope tracing experiments that can potentially interrogate the origin and fate of dissolved gases in emulsions and biological fluids.
Our method for detecting the absolute content of a broad range of gases from blood should also facilitate probing circulatory gases under the widest physiological or pathophysiological conditions. Unlike approaches used by blood gas analyzers, ours makes no assumptions or needs no mathematical modeling to determine the content of a given gas, thus allowing it to remain accurate even when the composition of blood is not known a priori. This should be of special interest to the design of artificial oxygen carriers for which their ability to carry the gas is to be quantified in the presence of other circulatory components, such as plasma proteins, ions, and blood cells. Furthermore our method can achieve this level of performance using samples volumes of tens of microliters. The ability to perform gas quantitation with such small volumes allows this method to probe gas exchange in the circulation of small animals without impacting their cardiovascular system.
Acknowledgments
This work was supported through grants from the National Science Foundation (0641516) and from the National Institutes of Health (P20 RR16456 from the Louisiana BRIN/INBRE Program of the NCRR).
Footnotes
Publisher's Disclaimer: This is a PDF file of an unedited manuscript that has been accepted for publication. As a service to our customers we are providing this early version of the manuscript. The manuscript will undergo copyediting, typesetting, and review of the resulting proof before it is published in its final citable form. Please note that during the production process errors may be discovered which could affect the content, and all legal disclaimers that apply to the journal pertain.
References
- 1.Kilburn DG, Webb FC. Biotechnology and Bioengineering. 1968;10:801. [PubMed] [Google Scholar]
- 2.Severinghaus JW, Astrup P, Murray JF. Am J Respir Crit Care Med. 1998;157:S114. doi: 10.1164/ajrccm.157.4.nhlb1-9. [DOI] [PubMed] [Google Scholar]
- 3.Hoch G, Kok B. Arch Biochem Biophys. 1963;101:160. doi: 10.1016/0003-9861(63)90546-0. [DOI] [PubMed] [Google Scholar]
- 4.Seylaz J, Pinard E, Meric P, Correze JL. Am J Physiol. 1983;245:H513. doi: 10.1152/ajpheart.1983.245.3.H513. [DOI] [PubMed] [Google Scholar]
- 5.Tu C, Swenson ER, Silverman DN. Free Radic Biol Med. 2007;43:1453. doi: 10.1016/j.freeradbiomed.2007.07.026. [DOI] [PubMed] [Google Scholar]
- 6.Haymond S, Cariappa R, Eby CS, Scott MG. Clin Chem. 2005;51:434. doi: 10.1373/clinchem.2004.035154. [DOI] [PubMed] [Google Scholar]
- 7.Bisson J, Younker J. Nurs Crit Care. 2006;11:232. doi: 10.1111/j.1478-5153.2006.00177.x. [DOI] [PubMed] [Google Scholar]
- 8.D’Alessandro A, Liumbruno G, Grazzini G, Zolla L. Blood Transfus. 2010;8:82. doi: 10.2450/2009.0122-09. [DOI] [PMC free article] [PubMed] [Google Scholar]
- 9.Calder PC, Jensen GL, Koletzko BV, Singer P, Wanten GJ. Intensive Care Med. 2010;36:735. doi: 10.1007/s00134-009-1744-5. [DOI] [PMC free article] [PubMed] [Google Scholar]
- 10.Spiess BD. J Appl Physiol. 2009;106:1444. doi: 10.1152/japplphysiol.90995.2008. [DOI] [PubMed] [Google Scholar]
- 11.Mozzarelli A, Ronda L, Faggiano S, Bettati S, Bruno S. Blood Transfus. 2010;8(Suppl 3):s59. doi: 10.2450/2010.010S. [DOI] [PMC free article] [PubMed] [Google Scholar]
- 12.Levshankov AI, Pushkina MA, Slutskii ME, Uvarov BS. Med Tekh. 1987:13. [PubMed] [Google Scholar]
- 13.Snedden W, LeDez K, Manson HJ. J Appl Physiol. 1996;80:1371. doi: 10.1152/jappl.1996.80.4.1371. [DOI] [PubMed] [Google Scholar]
- 14.Ledez KM, Snedden W, Manson HJ. Undersea Hyperb Med. 1996;23:235. [PubMed] [Google Scholar]
- 15.Ojala M, Mattila I, Tarkiainen V, Sarme T, Ketola RA, Maattanen A, Kostiainen R, Kotiaho T. Anal Chem. 2001;73:3624. doi: 10.1021/ac001504i. [DOI] [PubMed] [Google Scholar]
- 16.Cornelius J, Tran T, Turner N, Piazza A, Mills L, Slack R, Hauser S, Alexander JS, Grisham MB, Feelisch M, Rodriguez J. Biol Chem. 2009;390:181. doi: 10.1515/BC.2009.017. [DOI] [PubMed] [Google Scholar]
- 17.Battino R, Evans FD, Danforth WF. J Am Oil Chem Soc. 1968;45:830. doi: 10.1007/BF02540163. [DOI] [PubMed] [Google Scholar]
- 18.Wilhelm E, BR, WRJ Chem Rev. 1977;77:219. [Google Scholar]
- 19.Komiyama H, Inoue H. J Chem Eng Jpn. 1978;11:25. [Google Scholar]
- 20.Kavanaugh MC, Rhodes R. Trussell J Am Water Works Assoc Res and Tech. 1980:684. [Google Scholar]
- 21.Murray CN, Riley JP. Deep-Sea Res. 1970;17:203. [Google Scholar]
- 22.Zijlstra WG, Buursma A, Falke HE, Catsburg JF. Comp Biochem Physiol. 1994;107B:161. [Google Scholar]
- 23.Miller TA. Modern surgical care: physiologic foundations and clinical applications. CRC Press; 2006. [Google Scholar]