

Abstract
KARIBIN (http://sgiweb.ncbi.nlm.nih.gov:80/Zjing/yac.html) is a karyotypic region-based integrated information resource that provides a comprehensive view of the integrated mapping and sequencing data for the human genome. A cytogenetic band is linked to a genetic or physical location using fluorescence in situ hybridization (FISH) mapping data. The genetic, physical mapping data and the sequencing data are integrated using STS markers positioned on multiple maps. For each cytogenetic band, the user can obtain the most up-to-date information that includes genetic and physical maps, human transcript gene map, YAC and PAC/BAC clone coverage, disease gene phenotype, and high throughput genomic sequences from the major human genome sequencing centers. This information provides a framework for future experiments and may accelerate the process of disease gene hunting. It is envisioned that other cytogenetic-based information such as chromosome aberrations can be linked to this framework.
Disease gene hunting, an up-to-now expensive and time consuming effort, requires extensive genetic and physical mapping and sequencing of the target region. For positional cloning of disease genes and cancer genetics, clinical observations of recurring, nonrandom chromosome aberrations may provide the first indication of the candidate gene location. One example is cytogenetic studies by in situ hybridization to partially deleted chromosomes with known breakpoints in Wolf-Hirschhorn Syndrome (Tranebjaerg et al. 1984; Park et al. 1987), which played an important role in the discovery of the cystic fibrosis transmembrane conductance regulator (CFTR) gene (Zielenski et al. 1991). Many cancer genes are cloned as genes located in breakpoints involved in recurring, nonrandom chromosome aberrations associated with specific cancer types (Mitelman et al. 1997). With the completion of the high-resolution genetic maps (Murray et al. 1994; Dib et al. 1996), the closure of the physical maps (Hudson et al. 1995; Bouffard et al. 1997; Stewart et al. 1997), the ongoing effort of transcript mapping of human genes (Schuler et al. 1996) and the onset of high-throughput genomic sequencing (Boguski et al. 1996; Marshall and Pennisi 1996), a large amount of comprehensive genome information pertinent to a candidate region is available. Effective use of genome mapping and sequencing data can greatly reduce de novo mapping and sequencing effort, thereby accelerating the process of identifying the target disease gene.
The wealth of genome mapping and sequencing data is a mixed blessing for disease gene hunting. The high density of the markers and the redundancy of the DNA clone coverage provide a high level of resolution and accuracy in genetic and physical maps. However, finding the information for a candidate region is a challenging data mining process. Genetic, physical, and cytogenetic maps were constructed with different methods, and are most useful when integrated. At present, there is no uniform, linear relationship that can directly associate a region on one map to that on another. Furthermore, there are discrepancies between genetic distance and physical proximity because of variations in recombination frequency in various chromosomal regions.
Sequence-tagged sites (STSs) have become the most widely used type of markers in construction of the genetic and physical maps, and a number of STS markers have been localized on both types of maps. These markers have been used to establish the correlation of the genetic, physical mapping data and the sequencing data (J. Zhang, K.M. Chao, and J. Ostell, in prep.). A comprehensive, integrated human genome database has been constructed, which includes the radiation hybrid (RH) maps from the Stanford Human Genome Center (SHGC) and the Whitehead/MIT Center for Genome Research (WI/MIT), the genetic linkage maps from Généthon and the Cooperative Human Linkage Center (CHLC), and the yeast artificial chromosome (YAC)-based STS-content maps from the National Human Genome Research Institute (NHGRI) and WI/MIT.
To make full use of this integrated genome data for disease gene identification, we developed KARIBIN, (karyotypic region-based integrated), a World Wide Web (WWW) application that provides the integrated genome mapping and sequencing data associated with a karyotypic region. With this tool, researchers can easily explore the most up-to-date and comprehensive genome data about a cytogenetic location, which will greatly facilitate target identification in disease gene hunting. The information presented includes the genetic, physical, and transcript mapping data, the clone coverage of YACs, P1 artificial chromosomes (PACs), and bacterial artificial chromosomes (BACs), known disease gene phenotypes, and sequencing status of the region.
Genome Data Integration
Genetic, phyiscal, and cytogenetic maps are integrated with an STS-mediated approach (Fig. 1). Alignments of the various genetic and physical maps are established using consistent STS markers positioned on multiple maps. To evaluate the consistency of STS markers, only their orders are taken into account. Distances between the markers are ignored because of the variations in defining marker distances on different maps. For example, on chromosome 10, D10S578 and D10S604 are positioned with consistent order on WI/MIT, SHGC, Généthon, and CHLC maps. However, their distance on the four maps corresponds to 12%, 4.0%, 1.0%, and 0.6% of the total length of the chromosome. A framework map was constructed from the consistent markers, which provides the integration points for interpolating a region on one map to that on the other. Figure 2 shows an overview of the integrated genome maps for chromosome 7. The genetic and physical maps are presented in parallel with their alignments to the consistent map.
Figure 1.

Linking a cytogenetic band to the rest of the genome data using an STS-mediated approach. The input data are shown in light rectangles, which include the cytogenetic band and the FISH-anchored STS markers. The output data are displayed in dark rectangles, which include the OMIM gene map, the sequencing status, the genetic, physical, and transcript maps and YAC and BAC/PAC coverage.
Figure 2.
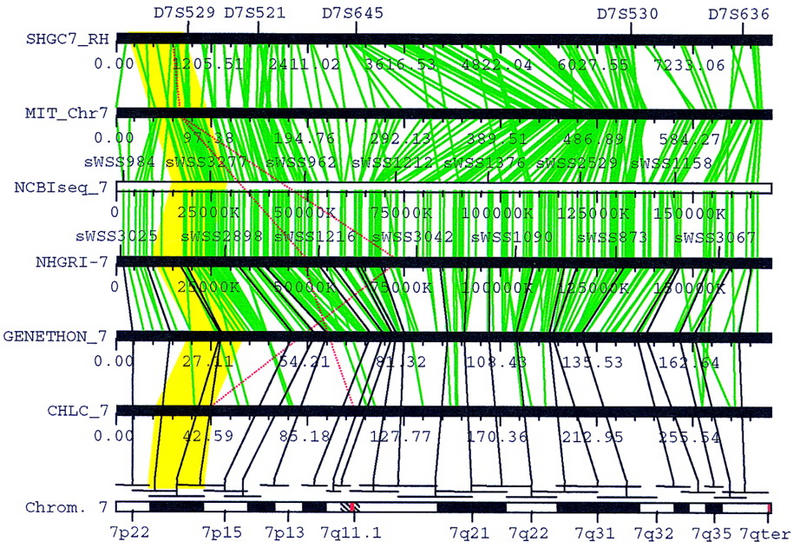
Graphic overview of the integrated genetic, physical, and cytogenetic maps for chromosome 7. Seven maps are displayed from top to bottom in the following order: the RH map from SHGC, the integrated RH and YAC contig map from WI/MIT, the map with consistent markers, the YAC contig map from NHGRI, the genetic map from Généthon, the genetic map from CHLC, and the cytogenetic map. Green lines link the consistent STS markers mapped by at least three groups, and their relative orders are preserved on the consistent map. The black lines linking a cytogenetic band to STS markers on the genetic and physical maps represent the whole-genome FISH mapping data (Green et al. 1994). Red lines indicate the inconsistent STS markers. The yellow polygon highlights the regions on various maps that correspond to 7p21. The graphic view is a screen dump of the Chromoscope program (J. Zhang and J. Ostell, unpubl.).
For chromosomes 1–18, 20, and X, the correlation between the cytogenetic map and the genetic/phyiscal maps are established using two sets of genome-wide FISH mapping data (Green et al. 1994; Bray-Ward et al. 1996). A cytogenetic band can be linked directly to a genetic or physical location if it has a FISH-mapped YAC clone that contains a genetically or physically anchored STS marker. For example, in Figure 2, 7p21 is linked to STS marker AFM200we7 on the Généthon map as well as the NHGRI map (the NHGRI map uses the alias sWSS1164), because the marker is present on yWSS1498, a YAC clone mapped to 7p21 by FISH. For maps that cannot be directly linked to a band, such as the WI/MIT and CHLC maps in Figure 2, their locations are interpolated from the consistent markers flanking the FISH-anchored STS marker. The size of a band is estimated from the fractional length based on the measurements of chromosome idiograms (Report of the Standing Committee on Human Cytogentic Nomenclature 1985). If FISH-mapping data is not available for a band, such as 1q12 in Figure 3, the map locations are interpolated from the flanking bands with FISH-anchored YAC clones (1p13 and 1q22-q23 in Fig. 3). Currently, FISH mapping data for chromosomes 19, 21, and 22 have not been incorporated. For these chromosomes, the fractional length of a band is projected to the framework map, and the consistent markers in the region are used to compute the corresponding locations on the other maps.
Figure 3.
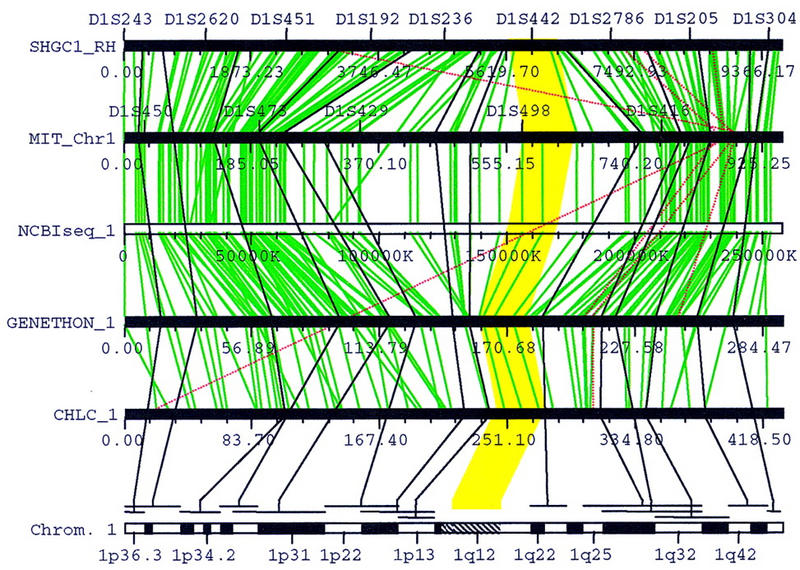
Mapping a cytogenetic band by interpolation. 1q12 is a band with no FISH mapping data. The yellow polygon highlights the regions that corresponds to 1q12, which were interpolated from the flanking FISH-mapped bands 1p13 and 1q22–q23.
By incorporating the human transcript gene map with the integrated genetic, physical, and FISH mapping resource, it is possible to anchor genes on the cytogenetic map even though many of them are not FISH-mapped. On the transcript gene map, an mRNA or expressed sequence tag (EST) representing a unique gene cluster (UniGene) was mapped to a genetic interval defined by two Généthon markers (Boguski and Schuler 1995; Schuler et al. 1996). As the connection between a cytogenetic band and the Généthon map is established, the genes localized between a pair of Généthon markers can be inferred to map to the cytogenetic region containing those markers. We use “electronic FISH mapping” to refer to such a process.
DNA Clone Coverage for a Cytogenetic Band
On the physical map, YAC contigs, which were constructed from overlapping YAC clones ordered by STS-content mapping, represent contiguous DNA coverage of the chromosome. If any of the clones in a contig was mapped by FISH, the cytogenetic locations of the other clones can be inferred from their locations in relation to the FISH-mapped clone. The YAC clone coverage for a cytogenetic band provides the researchers with a set of candidate DNA clones for disease gene mapping and isolation. In KARIBIN, we include YAC-based STS-content maps from WI/MIT (for chromosomes 1–22 and X) and NHGRI (for chromosome 7) for YAC clone coverage on the chromosome. Because of variations in their size, there is no one-to-one mapping between a YAC contig and a cytogenetic band; a large contig may extend over several cytogenetic bands and a band may contain several contigs. YAC clone coverage for a query band is derived from three layers of mappings. First, a cytogenetic band is linked to a location on the physical map, based on FISH mapping data. The YAC contigs mapped to this physical location are then identified and their STS-content mapping is examined to gather the clones that were mapped to the region of interest. YAC clones with large deletions are excluded if they do not contain any STS markers in the region of interest.
A YAC contig is normally constructed with a high level of redundancy to ensure its accuracy and contiguity. For example, on the NHGRI map, there is an average of 9.9 positive YAC clones per STS marker (Bouffard et al. 1997). For a biologist who is interested in selecting clones for future experiment, it is important to distinguish high-quality YAC clones from those that are either chimeric or have deletions. With the default setting in KARIBIN, only the high-quality clones with unambiguous mapping results are selected. To determine the mapping quality of YAC clones, the NHGRI map and the WI/MIT maps were processed differently because they were constructed from different libraries. The NHGRI’s chromosome 7 map was constructed from YAC clones highly enriched for chromosome 7 DNA, which are less chimeric than clones derived from the whole genome library. The original mapping data from NHGRI is well organized, and the YAC clones with inconsistent mapping results, such as deletion and chimerism, are grouped separately from those with consistent mapping results. In KARIBIN, inconsistent YAC clones on the NHGRI map are excluded by the default option as low-quality data, because consistent YAC clones alone are sufficient to represent contiguous DNA coverage. On the other hand, the WI/MIT maps were constructed from the whole genome CEPH mega-YAC library, which has a high rate of chimerism (∼50%). In addition, the information about YAC deletions as well as cross mapping to multiple contigs cannot be accessed directly. To evaluate the mapping quality of the YAC clones in a contig, we combined the data from the two files on the Whitehead ftp site (ftp://ftp.genome.wi.mit.edu/pub/human_STS_releases/july97/), CONTIG2STS and YAC2STS. The former describes the orders of the STS markers on the contigs, and the latter describes the mapping quality of each STS marker on a YAC clone. Based on their STS mapping quality as well as the occurrence of cross-mapping to multiple contigs, YAC clones in each contig are grouped into three categories: consistent, inconsistent, and ambiguos. Low-quality YAC clones with no STS markers mapped unambiguously to the region of interest are excluded with the default option in KARIBIN because WI/MIT has cautioned that ambiguous mapping result be used with extreme care. If a clone has one or more STS markers mapped unambiguously to multiple contigs, it is classified as an inconsistent clone because of high probability of chimerism. However, inconsistent YAC clones are included in the results because consistent clones alone usually are not sufficient to provide contiguous DNA coverage.
BAC or PAC clone coverage is calculated using STS markers that were mapped on a YAC clone as well as a PAC or BAC contig. Currently, the data are only available for chromosome 7. However, the database is designed to incorporate BAC/PAC clone information for any of the human chromosomes.
WWW Query Interface
We use 7q31, the cytogenetic band that harbors the gene for cystic fibrosis, as an example to illustrate how to use KARIBIN to explore the comprehensive genome mapping and sequencing data. The user can either type a query band in the dialog box “Search for CytoGenetic Band,” or select any band in one of the 23 human chromosomes from the pull-down lists (Fig. 4). The checkbox “Anchor Genetic/Physical Maps with FISH,” selected by default, allows the user to choose whether to use the whole genome FISH-mapping data to link a cytogenetic band to the genetic and physical maps. If not selected, the fractional length of the query band will be used to interpolate the corresponding map locations, which is unreliable and inaccurate because of the variations of marker distances on different maps. The check boxes in “Retrieve Data” and “Display Option” allow the user to select the data content as well as the display format. For YAC clone coverage of a band, the default option excludes low-quality YAC clones that are either chimeric or have deletions.
Figure 4.

WWW user interface for KARIBIN.
The search results for 7q31, which include genetic and physical transcript mapping data, disease phenotype and sequencing effort, are summarized in “Table of Contents” (Fig. 5), a road map for exploring the vast array of genome information. Clicking on each item shows the details either graphically and/or in the tabular form with links to the related web sites. The URLs supported in KARIBIN are summarized in Table 1. Transcript mapping data, OMIM, and sequencing effort in the query band are shown in italics because they are linked to external web sites that will be launched with a separate browser. For 7q31, the link to OMIM shows that cystic fibrosis is one of the 25 human diseases mapped in this region. The link to the human transcript map is especially important because it provides the information about the genes located in a cytogenetic band. In this example, 7q31 correlates to a region between Généthon markers D7S2480 and D7S635, and the genes localized to this region on the transcript map are therefore electronically FISH-mapped to 7q31. In this case, the CFTR gene, along with the other 25 UniGene clusters, was mapped to a 9-cM subregion between D7S692 and D7S648 within 7q31. The result from electronic FISH mapping is consistent with the experimentally FISH-mapped cytogenetic loci for the disease gene.
Figure 5.
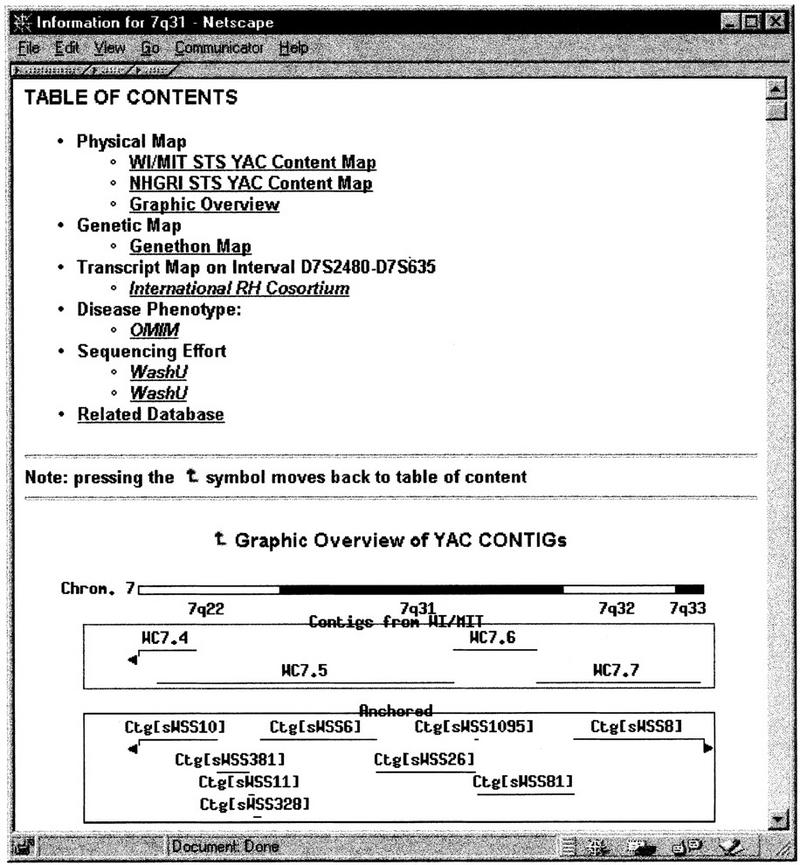
Summary of the genome information related to band 7q31. The chromosomal locations of the YAC contigs from WI/MIT are based on their RH mapping coordinates.
Table 1.
WWW Links for the Data Presented in KARIBIN
The genetic and physical mapping data, which include STS markers and YAC clones, are displayed in the same browser. The graphic overview of the YAC contig coverage displays a region that centers the query (7q31) band and extends with the half-band distance to the left (7q22) and the right (7q32-q33) so the user is able to browse information in the neighboring bands as well. In Figure 5, there are four contigs on the Whitehead map and nine contigs on the NHGRI map located between 7q22 and 7q33. The picture is a live image map. When clicked, the detailed graphic view of the STS-content map of the selected YAC contig will be displayed on a separate browser. Figure 6 shows the graphic view of the CFTR region on YAC contig Ctg[sWSS26]. A total of 9 STS markers and 13 YAC clones were mapped for the CFTR gene on the NHGRI map. If a large contig extends over more than one band, the graphic view will only display the subregion corresponding to the query band. In the tabular view of the physical mapping data (Fig. 7), the YAC clones are ordered by their locations on the contig. If a YAC clone is experimentally FISH mapped to a band, such as yWSS1744 on the NHGRI map, it is highlighted in red for distinction from the computed results. The number of STS markers on each YAC clone is also listed to facilitate the selection of the best YAC clones for future experiments. For convenience, the section “Related Database” lists the web sites that supply the YAC clones, such as CEPH YAC library, Research Genetics, and NHGRI.
Figure 6.

Graphic view of the CFTR region on YAC contig Ctg[sWSS26].
Figure 7.
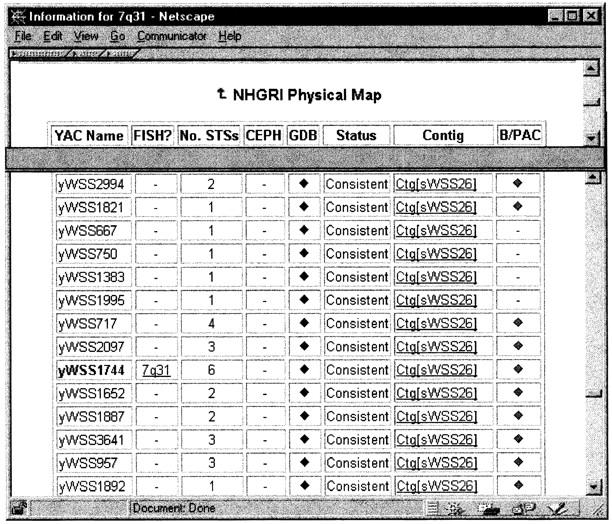
Tabular view of physical mapping data related to a band.
DISCUSSION
The integrity of the genetic, physical, and FISH mapping data are crucial to the accuracy of the computational method that selects the comprehensive genome information associated with a cytogenetic band. Though we have not analyzed the variations among the different mapping results systematically, several chromosomes have been reviewed manually to evaluate data consistency. On chromosome 1, FISH mapping data of 14 CEPH YAC clones containing STS markers on the Généthon map or the WI/MIT map are used to establish the link between the cytogenetic map and the other maps with the STS-mediated approach. All except 725 _e_9, a chimeric YAC clone, have consistent locations on the WI/MIT YAC contig map. The FISH-mapping results show that 725 _e_9 is mapped to band 1p36. However, the STS mapping results from the Whitehead Institute show the clone is mapped unambiguously to chromosome 16 though it has two STS markers mapped ambiguously on chromosome 1. (http://www.genome.wi.mit.edu:80/cgi-bin/contig/yac_info?yac=725_e _9). As the default option in KARIBIN excludes clones with ambiguous mapping data for YAC coverage, it is no surprise that this clone does not show up when the query band is 1p36. On chromosome 7, discrepancies of the STS mapping results have been found between the YAC-content map from NHGRI and the PAC/BAC contig maps from Washington University. For example, both STS markers sWSS241 and sWSS2538 are mapped on a 500-kb PAC contig (http://genome.wustl.edu/gsc/human/Chrom7/Images/ctg1105.gif) constructed by the Genome Sequencing Center in the Washington University. However, on the NHGRI map, the two markers are mapped on two different YAC contigs (sWSS241 on contig sWSS173 and sWSS2538 on contig sWSS9) that are estimated to be 28 Mb apart, which is about the size of three cytogenetic bands. It is not clear whether this is caused by chromosome duplication or errors in the mapping or data entry in one of the groups.
Currently, for chromosomes 19, 21, and 22, a cytogenetic band is linked to the genetic and physical maps using the fractional length approach, which is a good approximation but not as accurate as the results derived from the FISH-mapping data. For chromosome 22, a number of BAC or PAC clones have been FISH-mapped by the Sanger Centre, and we are in the process of incorporating this data into KARIBIN to establish a more accurate relationship between the cytogenetic map and the rest of the genome mapping and sequencing data.
KARIBIN is the first whole-genome integrated data resource that links a wide range of the genome data to a cytogenetic band. It provides the crucial connection between clinical studies of chromosomal abnormalities and biological studies of molecular genetics. Its utility will be greatly enhanced with the progress of the Human Genome Project.
Acknowledgments
We thank W. Yan and E. Green for helpful suggestions to improve the design and interface of KARIBIN. Special thanks go to Michael Wagner and Ray Grimaila for critical review of the manuscript.
The publication costs of this article were defrayed in part by payment of page charges. This article must therefore be hereby marked “advertisement” in accordance with 18 USC section 1734 solely to indicate this fact.
Footnotes
E-MAIL jz70309@glaxowellcome.com; FAX (919) 483-0659.
REFERENCES
- Boguski MS, Schuler GD. ESTablishing a human transcript map. Nat Genet. 1995;10:369–371. doi: 10.1038/ng0895-369. [DOI] [PubMed] [Google Scholar]
- Boguski M, Chakravarti A, Gibbs R, Green E, Myers RM. The end of the beginning: The race to begin human genome sequencing. Genome Res. 1996;6:771–772. doi: 10.1101/gr.6.9.771. [DOI] [PubMed] [Google Scholar]
- Bouffard GG, Idol JR, Braden VV, Iyer LM, Cunningham AF, Weintraub LA, Touchman JW, Mohr-Tidwell RM, Peluso DC, Fulton RS, et al. A physical map of human chromosome 7: An integrated YAC contig map with average STS spacing of 79 kb. Genome Res. 1997;7:673–692. doi: 10.1101/gr.7.7.673. [DOI] [PubMed] [Google Scholar]
- Bray-Ward P, Menninger J, Lieman J, Desai T, Mokady N, Banks A, Ward DC. Integration of the cytogenetic, genetic, and physical maps of the human genome by FISH mapping of CEPH YAC clones. Genomics. 1996;32:1–14. doi: 10.1006/geno.1996.0070. [DOI] [PubMed] [Google Scholar]
- Dib C, Faure S, Fizames C, Samson D, Drouot N, Vignal A, Millasseau P, Marc S, Hazan J, Seboun E, et al. A comprehensive genetic map of the human genome based on 5,264 microsatellites. Nature. 1996;380:152–154. doi: 10.1038/380152a0. [DOI] [PubMed] [Google Scholar]
- Green ED, Idol JR, Mohr-Tidwell RM, Braden VV, Peluso DC, Fulton RS, Massa HF, Magness CL, Wilson AM, Kimura J, et al. Integration of physical, genetic and cytogenetic maps of human chromosome 7: Isolation and analysis of yeast artificial chromosome clones for 117 mapped genetic markers. Hum Mol Genet. 1994;3:489–501. doi: 10.1093/hmg/3.3.489. [DOI] [PubMed] [Google Scholar]
- Hudson T, Stein L, Gerety S, Ma J, Castle A, Silva J, Slonim D, Baptista R, Kruglyak L, Xu S, et al. An STS-based map of the human genome. Science. 1995;270:1945–1954. doi: 10.1126/science.270.5244.1945. [DOI] [PubMed] [Google Scholar]
- Marshall E, Pennisi E. NIH launches the final push to sequence the genome. Science. 1996;272:188–189. doi: 10.1126/science.272.5259.188. [DOI] [PubMed] [Google Scholar]
- Mitelman F, Mertens F, Johansson B. A breakpoint map of recurrent chromosomal rearrangements in human neoplasia. Nat Genet. 1997;15:417–474. doi: 10.1038/ng0497supp-417. [DOI] [PubMed] [Google Scholar]
- Murray JC, Buetow KH, Weber JL, Ludwigsen S, Scherpbier-Heddema T, Manion F, Quillen J, Sheffield VC, Sunden S, Duyk GM, et al. A comprehensive human linkage map with centimorgan density. Science. 1994;265:2049–2054. doi: 10.1126/science.8091227. [DOI] [PubMed] [Google Scholar]
- Park, M., J.R. Testa, D.G. Blair, M. Dean, N.Z. Parsa, and G.F. Vande Woude. 1987.
- The CF locus is distal to and upstream from the met protooncogene transcription unit which is located at 7q31-32. Cytogenet. Cell Genet. 46: 674–675.
- Report of the Standing Committee on Human Cytogenetic Nomenclature. An international system for human cytogenetic nomenclature (1985) ISCN 1985. Birth Defects Orig Artic Ser. 1985;21:1–117. [PubMed] [Google Scholar]
- Schuler GD, Boguski MS, Stewart EA, Stein LD, Gyapay G, Rice K, White RE, Rodriguez-Tome P, Aggarwal A, Bajorek E, et al. A gene map of the human genome. Science. 1996;274:540–546. [PubMed] [Google Scholar]
- Stewart EA, McKusick KB, Aggarwal A, Bajorek E, Brady S, Chu A, Fang N, Hadley D, Harris M, Hussain S, et al. An STS-based radiation hybrid map of the human genome. Genome Res. 1997;7:422–433. doi: 10.1101/gr.7.5.422. [DOI] [PubMed] [Google Scholar]
- Tranebjaerg L, Petersen A, Hove K, Rehder H, Mikkelsen M. Clinical and cytogenetic studies in a large (4;8) translocation family with pre- and postnatal Wolf syndrome. Ann Genet. 1984;27:224–229. [PubMed] [Google Scholar]
- Zielenski J, Rozmahel R, Bozon D, Kerem B, Grzelczak Z, Riordan JR, Rommens J, Tsui LC. Genomic DNA sequence of the cystic fibrosis transmembrane conductance regulator (CFTR) gene. Genomics. 1991;10:214–228. doi: 10.1016/0888-7543(91)90503-7. [DOI] [PubMed] [Google Scholar]