Analysis of phases derived by phase extension identifies the reciprocal-space volumes that lie close to icosahedral NCS axes as seeding places for incorrect phase solutions.
Keywords: phase extension, molecular replacement, icosahedral averaging, noncrystallographic symmetry
Abstract
The constraints imposed on structure-factor phases by noncrystallographic symmetry (NCS) allow phase improvement, phase extension to higher resolution and hence ab initio phase determination. The more numerous the NCS redundancy and the greater the volume used for solvent flattening, the greater the power for phase determination. In a case analyzed here the icosahedral NCS phasing appeared to have broken down, although later successful phase extension was possible when the envelope around the NCS region was tightened. The phases from the failed phase-determination attempt fell into four classes, all of which satisfied the NCS constraints. These four classes corresponded to the correct solution, opposite enantiomorph, Babinet inversion and opposite enantiomorph with Babinet inversion. These incorrect solutions can be seeded from structure factors belonging to reciprocal-space volumes that lie close to icosahedral NCS axes where the structure amplitudes tend to be large and the phases tend to be 0 or π. Furthermore, the false solutions can spread more easily if there are large errors in defining the envelope designating the region in which NCS averaging is performed.
1. Introduction
1.1. Molecular replacement and noncrystallographic symmetry
The concept of noncrystallographic symmetry (NCS) and its use in the solution of the phase problem were suggested by Rossmann & Blow (1962 ▶) and explored with a number of test problems using reciprocal-space procedures (Rossmann & Blow, 1963 ▶, 1964 ▶; Main & Rossmann, 1966 ▶; Main, 1967 ▶; Crowther, 1967 ▶, 1969 ▶). However, real-space averaging (Buehner et al., 1974 ▶; Bricogne, 1976 ▶) was found to be easier for computational and conceptual reasons and gave immediate success for some significant biological structure determinations (Matthews et al., 1967 ▶; Buehner et al., 1973 ▶; Bloomer et al., 1978 ▶; Harrison et al., 1978 ▶; Abad-Zapatero et al., 1980 ▶). These early results were only for phase improvement, not for phase extension to higher resolution. In spite of the significant successes in using NCS averaging, ab initio phase determination or phase extension to higher resolution using NCS was often considered to be questionable (Rossmann, 1972 ▶; Rossmann & Henderson, 1982 ▶).
Gaykema et al. (1984 ▶) were perhaps the first to successfully use real-space NCS averaging (combined with solvent flattening in space not occupied by the NCS-related subunits) for phase extension in a real problem. They extended phases from 4.0 to 3.2 Å using sixfold NCS redundancy. The procedure changed the electron-density map of Panulirus interruptus hemocyanin from being uninterpretable to being interpretable. Nevertheless, doubt in the power of NCS averaging for phase extension may have remained as the increase in resolution was only marginal and thus the map improvement might have been merely a consequence of the improvement of the previously poorly determined phases. The power of NCS averaging was eventually fully validated with the structure determination of the human common cold virus serotype 14 (Rossmann et al., 1985 ▶; Arnold et al., 1987 ▶), where initial phases were determined by single isomorphous replacement to 6 Å resolution and then extended in gradual small steps to 3.0 Å resolution, producing an easily interpretable electron-density map. Since then, numerous other virus structures have been solved using NCS averaging and phase extension. Furthermore, NCS averaging is now in common use whenever there is more than one copy of an unknown molecule per asymmetric unit either in the same or in a different crystal form. A later attempt (Tong & Rossmann, 1995 ▶) to perform reciprocal-space phase extension was successful and computationally faster than the real-space procedure, but failed to become popular largely because of the difficulty of accurately defining the molecular envelope, or ‘G function’, in reciprocal space.
Notwithstanding the extensive experience now available for phase extension, there are times when the procedure appears to fail. This was initially the case in structure determination of the Bombyx mori (silkworm) densovirus (BmDNV), which belongs to the parvovirus family (Kaufmann et al., 2011 ▶). This gave us the opportunity, as reported here, to investigate the differences between successful and unsuccessful phase determinations and thus to establish the cause of the earlier problems.
1.2. Phase determination by NCS averaging in real and reciprocal space
In brief, the iterative phase-extension procedure using NCS symmetry consists of the following steps.
(i) Define a molecular envelope (mask) within which the NCS is valid or around individual NCS-related subunits. Regions outside the mask that do not obey NCS symmetry are assumed to be solvent.
(ii) Take any one electron-density grid point within the envelope and find the densities at all the other NCS-related positions. These will be at non-integral grid points. Therefore, to determine the density at these points it will be necessary to interpolate between the density values at the surrounding grid points. Repeat this for all grid points within the mask.
(iii) Fourier invert the averaged map to give a set of F calc and αcalc values for all the original structure factors.
(iv) Apply the αcalc values to the F obs amplitudes and possibly weight the F obs. Then calculate a new electron-density map.
(v) Repeat steps (i)–(iv) with the new map iteratively until the agreement between F obs and F calc has converged. Then slightly extend the resolution using the phases calculated in step (iii). And so forth.
Although electron-density averaging in real space as described here is intuitively obvious, its analogy in reciprocal space is more informative about the process and thus relevant to the purpose of this paper. It can be shown (Main & Rossmann, 1966 ▶; Rossmann, 1990 ▶) that the real-space refinement procedure described above is exactly equivalent to determining the Fourier back-transformed calculated structure factors Fp with
where Fp and Fh are the complex variables representing the structure factors for reflections with Miller indices (p, q, r) and (h, k, l), respectively (bold characters represent vectors or complex variables). Also, U is the volume of all the NCS asymmetric units (each of volume Un, such that U = NUn) and V is the volume of the unit cell. In this equation, the terms Fh = |Fh|exp(iαh) represent the observed structure amplitudes |F obs| associated with the currently available phases αh that would have been used to calculate the unaveraged map in the real-space method. These phases might have been obtained either from a molecular-replacement model or experimental phasing. The coefficients ahp depend on a knowledge of the NCS operators and can be calculated from
where
and
Here [Cn] is the rotation matrix that relates the electron-density grid point at x n in the nth NCS-related molecule (or subunit) to the equivalent density in the reference molecule given by the fractional coordinates x 1. The function G (Rossmann & Blow, 1962 ▶) modulates the contribution of Fh in the summation (1).
In general the G function is complex, but when the volume U has a center of symmetry, as does a sphere (radius R), the G function is real and can be expressed analytically (Rossmann & Blow, 1962 ▶) and approximates to a radial sinc function (sinθ/θ). The G function (3) approaches unity only when θ = 2π|([Cn T]h − p)|R tends to zero, otherwise the function is negligibly small. Therefore, only those terms on the right-hand side of (1) for which the rotated reciprocal-lattice point [Cn T]h is close to the reciprocal-lattice point p are large. Note that in general the position at [Cn T]h will be at a non-integral reciprocal-lattice point. Thus, the (Fh·ahp) terms that are significant for the determination of Fp in (1) will all be at about the same distance from the reciprocal-space origin, meaning that they correspond to reflections with about the same ‘resolution’.
With an increasing number of NCS asymmetric units N there are more structure factors Fh that rotate close to the position of p, thus increasing the accuracy with which Fp is determined. Notice also that if the envelope U, which is controlled by the radius R for a sphere, is chosen incorrectly then the contribution of the NCS-related points at [Cn T]h will be too small if R is chosen too large (as in the case of BmDNV described here) or vice versa if R is too small. Furthermore, if the envelope extends into ordered density that does not obey the NCS then the averaging process will introduce artifacts into the calculated electron density.
1.3. Limit to resolution increments during phase extension
During phase extension, Fps beyond the previous resolution limit are only determined by Fhs at a resolution less than the previous limit. Thus, at best, only half the significant terms that contribute to (1) will be known. The greater the distance of p from the previous resolution limit, the fewer terms will contribute significantly to the calculation of Fp. The first node of the G function occurs when θ = π in sinθ/θ (or somewhat less for a sphere). That is, significant terms in (1) occur only when θ = 2π|([Cn T]h – p)|R < π, requiring that |([Cn T]h – p)| < 1/2R. Assuming the envelope diameter, 2R, is about equal to the shortest cell dimension, a, then it follows that the resolution increment in phase extension should be less than one reciprocal-lattice step (1/a). If 2R is smaller than the linear size of the unit cell, as is the case in unit cells containing more than one copy of a spherical virus particle, phase extension can proceed in larger steps. However, in the present case of BmDNV the crystal was triclinic with only one particle in the cell, making it necessary to extend by at most only one reciprocal spacing at a time. If R is estimated too large then terms in (1) will include too many terms beyond the first node of the G function where the function is negative and hence possibly alter the phase of Fp by π.
1.4. Phase ambiguity when phases are constrained by NCS
Inspection of (1) shows that there are four sets of phases that can satisfy the equation equally well for all but the lowest order reflections around the origin of reciprocal space. These are (i) the correct phases, αh; (ii) phases for the enantiomorph or opposite-hand structure, −αh; (iii) phases for the Babinet opposite structure that will result in inverted density values, αh + π; and (iv) phases for the Babinet opposite structure with the opposite hand, −αh + π.
Most of the reflections around the origin at F(0, 0, 0) are usually behind the beam stop and therefore unobserved. Nevertheless, the structure factor F(0, 0, 0) has an amplitude equal to the number of electrons in the unit cell on an absolute scale and a phase of zero. The F(0, 0, 0) term impacts the surrounding reflections and these in turn affect other reflections. This would anchor the reflections to give phases consistent with there being positive density at atomic positions in the unit cell and thus solve the ambiguity concerning the correct or Babinet solution. However, in the absence of information about the very low-order reflections there will be the possibility that the NCS averaging procedure will converge on the wrong Babinet solution. This happened in the structure determinations of MS2 (Valegård et al., 1990 ▶) and of ϕX174 (McKenna et al., 1992 ▶). In the latter case the wrong solution was recognized when the positions corresponding to the heavy atoms that had been used to provide initial low-resolution phases were found to have strong negative density using the phases determined by phase extension. Once discovered, it was easily rectified by changing the sign of the density value at every grid point in the electron-density map.
Unlike the determination of the correct Babinet solution of (1), X-ray diffraction data (assuming no anomalous dispersion) cannot differentiate which enantiomorphic solution is correct. This is because the reciprocal lattice occupied by structure-factor amplitudes has a center of symmetry at the origin.
1.5. Structure factors located in a plane that includes the origin of reciprocal space and is perpendicular to a twofold NCS axis have phase 0° or 180°
We will show that in a triclinic system with an NCS twofold axis parallel to the a axis passing through the arbitrarily selected origin reflections in the (0, k, l) reciprocal-space plane are centric (phases are near 0 or π). Consider a Cartesian system oriented such that its x axis is coincident with the NCS twofold axis. Then
As the NCS twofold axis has been assumed to be along the real a axis, the real-space rotation [C2] will move any reciprocal-lattice point at (h, k, l) to a reciprocal-lattice point within the same reciprocal-lattice plane at (h, −k, −l).
The large terms in (1) when G approaches unity will be when h is given by
Hence, approximately, from (1),
Now taking only reflections from a plane containing the origin and orthogonal to the twofold axis along a, that is reflections with Miller indices (0, k, l),
Then, from Friedel’s law, α(0, k, l) = −α(0, −k, −l), since exp(iα) + exp(−iα) = 2cos(α), F(0, q, r) must be all real and can only have a phase of 0 or π. With an NCS redundancy of 2, the volume of the NCS asymmetric unit, U, must be less or equal to V, making (U/V) ≤ 1/2. This result was obtained considering an NCS twofold axis along the real-space a axis in a triclinic system. A triclinic indexing system can always be chosen such that a particular NCS axis direction joins two lattice points, although this might require a large unit cell. Thus, in general, reflections lying in or near a central plane in a reciprocal lattice that is perpendicular to an NCS twofold axis will be ‘centric’. If the twofold axis did not pass through the origin there would still be only two possible values of the phase angle for a particular reflection, but there would be a shift of the phase angle generated by the translation of the symmetry axis from the origin.
1.6. Amplitudes of structure factors located on an N-fold NCS symmetry axis are on average N 1/2 times stronger than amplitudes of structure factors in general positions
Using the triclinic cell as described above having an N-fold instead of a twofold NCS axis, then any reciprocal-lattice point h on the real-space rotation axis will rotate N times onto itself as a result of the NCS symmetry; thus, each contributing a term Fh to the summation in (1). Hence, approximately,
where (U/V) ≤ 1/N.
In contrast, for reflections in general positions the vectors Fh will be in random relative orientations, making their sum on average (U/V)N 1/2 Fh.
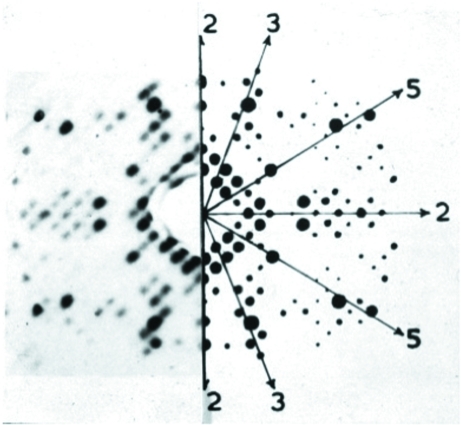
The impact of the increased intensity of reflections lying along an NCS rotation axis was first observed by Caspar (1956 ▶) in his demonstration that the structure of tomato bushy stunt virus had icosahedral symmetry (Fig. 1 ▶).
Figure 1.
Strong reflections in a reciprocal-lattice plane perpendicular to an icosahedral twofold axis in a crystal of tobacco bushy stunt virus. Left, precession photograph of a zero-layer reciprocal-lattice plane; right, weighted reciprocal lattice. Shown also are the directions of the NCS fivefold, threefold and twofold symmetry axes. The original figure is published courtesy of Donald L. D. Caspar.
2. Materials and methods
2.1. Phase-distribution analysis
Correlation coefficients and R factors comparing F obs and F calc were calculated with the program RSTATS from the CCP4 package (Winn et al., 2011 ▶). Data for two-dimensional plots comparing two phase sets were prepared with a custom-written program and plotted with O2D (Kleywegt et al., 2001 ▶). Map files in MRC format were adapted to represent reciprocal space (Ludtke et al., 1999 ▶). The individual grid points in the map were made to correspond to reciprocal-lattice points. Structure factors that had their phases determined by phase extension within ±30° of the phase calculated from a refined BmDNV model were considered to belong to the correct phase solution set. Structure factors with phases belonging to enantiomorph, Babinet opposite and enantiomorph of Babinet opposite solution sets were identified similarly. Two-dimensional plots of reciprocal-space maps were prepared with MAPMAN (Kleywegt & Read, 1997 ▶) and plotted with O2D. The three-dimensional figures of reciprocal-space maps were prepared with the UCSF Chimera package from the Resource for Biocomputing, Visualization and Informatics at the University of California, San Francisco (supported by NIH P41 RR001081; Pettersen et al., 2004 ▶).
3. Results and discussion
3.1. Comparison of unsuccessful and successful structure determinations of the B. mori densovirus
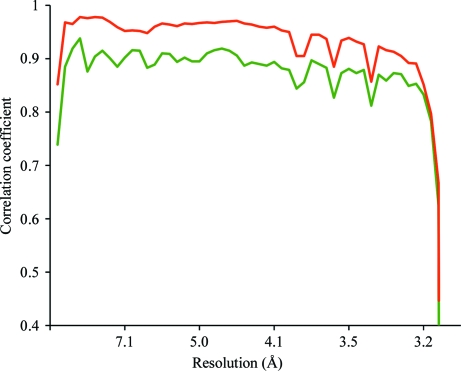
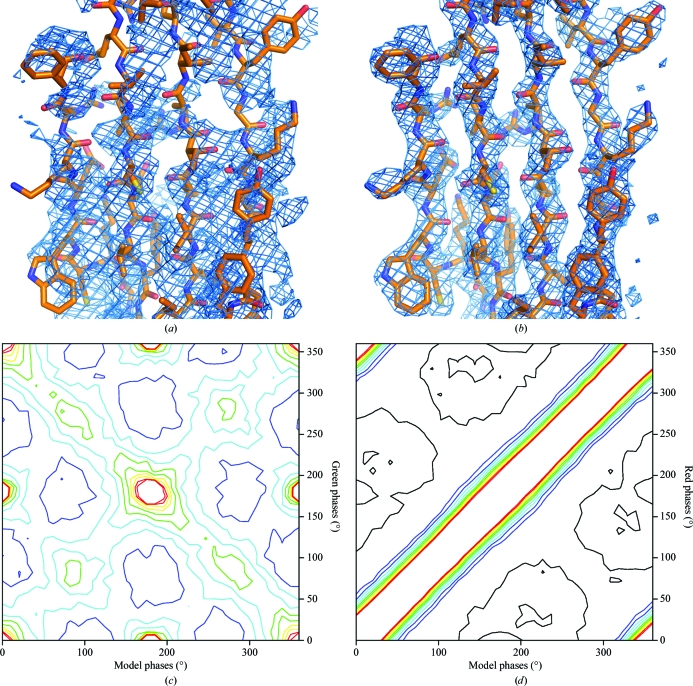
The structure determination of BmDNV and its biological significance are described elsewhere (Kaufmann et al., 2011 ▶). As the success of any X-ray crystal structure determination depends on the diffraction data, the analysis of the data collection is reproduced here (Table 1 ▶). The orientation of the icosahedral virus in the crystal was found with a rotation function (Tong & Rossmann, 1997 ▶). The particle center was arbitrarily assigned to be at the origin. In the first (failed) phase determination, phasing was initiated using a cryo-EM model at 15 Å resolution and extended in small steps to 3.1 Å resolution. The electron density was 60-fold averaged in a spherical shell between radii of 140 and 50 Å using the program ENVELOPE (Rossmann, 1989 ▶; Rossmann et al., 1992 ▶; note that the 280 Å diameter is larger than the shortest cell dimension of 245.4 Å). The final correlation between the observed structure amplitudes and those calculated by Fourier transforming the averaged electron-density map is shown in green in Fig. 2 ▶. The phases determined in this way will be referred to as the ‘green phases’, αG. The electron density based on this phasing was uninterpretable (Fig. 3 ▶ a), although the usual statistics (Arnold et al., 1987 ▶; Rossmann, 1989 ▶, 1990 ▶; Cornea-Hasegan et al., 1995 ▶) for assessing the quality of phase extension were satisfactory. Many virus structures (e.g. human parvovirus B19; Kaufmann et al., 2004 ▶) have been determined with much poorer correlation between F calc and F obs. Subsequently, the phase extension was repeated using the Uppsala programs (Jones, 1992 ▶) starting with phases from the model of the homologous GmDNV parvovirus (Simpson et al., 1998 ▶). Phases were extended from 15 Å resolution. The usual tests for the quality of phase determination were again excellent, but the map was still uninterpretable. Only when the averaging envelope was carefully defined by using the homologous parvovirus model was it possible to obtain an easily interpretable electron-density map (Kaufmann et al., 2011 ▶; Fig. 3 ▶ b). The correlation of the calculated structure amplitudes with the observed amplitudes is shown in red in Fig. 2 ▶ (corresponding to the ‘red phases’, αR). These results are only 6% better than the earlier clearly incorrect (green) phase determinations. A third set of phases was generated from the refined BmDNV model and used as the reference true phases (referred to as the model phases, αM).
Table 1. X-ray data-collection parameters and statistics.
Values in parentheses are for the high-resolution bin. Based on Kaufmann et al. (2011 ▶).
| Wavelength (Å) | 1.2 |
| CCD detector | MAR CCD 165 |
| Sample-to-detector distance (mm) | 200 |
| Exposure time per frame (s) | 20 |
| Oscillation angle per frame (°) | 0.2 |
| Resolution range (Å) | 50–3.1 (3.21–3.10) |
| No. of frames | 900 |
| Space group | P1 |
| Unit-cell parameters (Å, °) | a = 245.4, b = 245.6, c = 245.7, α = 59.98, β = 67.93, γ = 72.27 |
| Mosaicity (°) | 0.36 |
| No. of observed reflections | 1518629 |
| No. of unique reflections | 789029 (63108) |
| Multiplicity | 1.9 (1.3) |
| Completeness (%) | 95.7 (76.6) |
| 〈I〉/〈σ(I)〉 | 16.12 (6.09) |
| Rmerge† | 0.044 (0.122) |
R
merge = 
 .
.
Figure 2.
Correlation coefficients comparing F obs and F calc from the final cycle of phase extension as a function of resolution. Correlation coefficients for phase extension resulting in an uninterpretable map (αG) are shown in green and those for the successful phase extension (αR) in red. The bumps in the correlation coefficients of both successful and unsuccessful phase extensions at resolutions of ∼3.90, ∼3.67 and ∼3.44 Å correspond to the positions of ice rings in the diffraction images.
Figure 3.
Comparison of electron-density maps and structure-factor phases calculated in the unsuccessful (αG, left) and successful (αR, right) phase-extension attempts. (a, b) Electron density corresponding to the ‘BIDG’ β-sheet. (c, d) Frequency distribution of structure factors based on their phase angles calculated from the refined BmDNV model αM (x axis) and phases from the unsuccessful αG (c) and successful αR (d) phase extensions. The contour levels go from black (lowest) to red (highest).
3.2. Comparison of the green (poor) and red (good) phases with the model phases
A plot of the red phases (successful phase extension) against the true phases (Fig. 3 ▶ d) shows excellent agreement. About 70% of the red phases are within 30° of their ‘model’ value (αR ≃ αM). In contrast, the phase distribution for the green phases (unsuccessful phase extension) when plotted against the model phases (Fig. 3 ▶ c) shows a dominant region running from the top left to bottom right in which αG ≃ −αM corresponding to the opposite-handed enantiomorphic solution. In addition, structure factors also cluster in regions where αG ≃ αM corresponding to the correct solution (as in Fig. 3 ▶ d), where αG ≃ αM + π corresponding to the Babinet opposite solution and where αG ≃ −αM + π corresponding to a solution that has both a wrong hand and an inverted Babinet solution. Thus, the green phases sought out all four possible solutions of (1) that are consistent with the given NCS. Hence, the calculated structure-factor amplitudes were still roughly correct, explaining why the correlation between F calc and F obs was high but the electron-density map was uninterpretable.
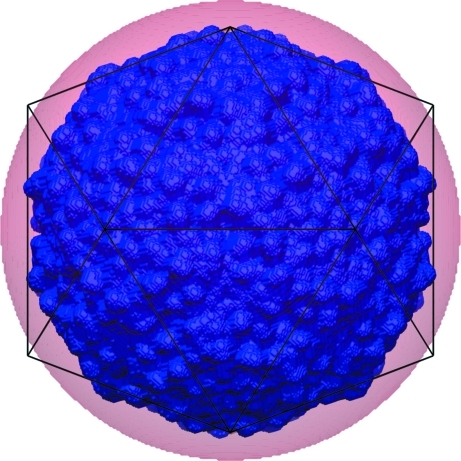
The principal difference between the two phase extensions was that the green phases were determined assuming a spherical mask with a liberally chosen radius, whereas the red phases utilized a mask based on a homologous parvovirus that defined the envelope fairly accurately (Fig. 4 ▶). Changing the mask from an excessively large spherical shell to a detailed mask based on an atomic model changes two aspects relevant to averaging. Firstly, because of the inaccurately chosen envelope for determining the green phases the G function will have incorrectly weighted the various contributions in the summation given by (1). In particular, because R (the external radius of the spherical mask) was chosen to be too large the G function was overly compressed, adding terms that were π out of phase with what should have been the case. Secondly, the atomic mask has greater three-dimensional detail, which will also have the effect of extending the resolution of the G function. To separate the two effects, we calculated an additional phase extension that used a spherical mask with an outer radius of 122 Å (the maximum possible to create non-overlapping masks) and an inner radius of 80 Å. This mask cuts several loops on the surface of the particle. The resulting map was uninterpretable. Therefore, it appears that the use of a molecular-shaped mask was crucial for successful phase determination of BmDNV. Similar difficulties were encountered in structure determination of the first parvovirus structure (Tsao et al., 1991 ▶, 1992 ▶; Chapman et al., 1992 ▶). In this case the very low resolution phases based on spherical models were used to determine the positions of heavy atoms, which were then used to re-initiate phase determination.
Figure 4.
Comparison of envelopes used for phase extension. The spherical mask with an outer radius of 140 Å is shown as a transparent red sphere. The envelope derived from the structure of GmDNV in which all voxels are included that are less than 7 Å from any atom is shown in blue. The icosahedral mesh shows the orientation of the icosahedral NCS.
3.3. Distribution of structure factors with phase angles close to 0 and π
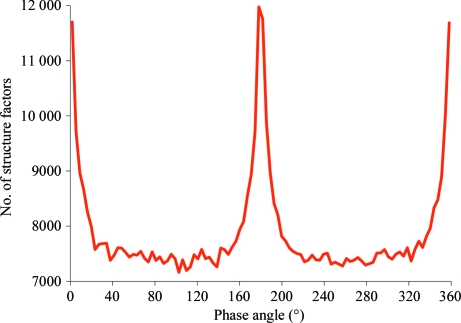
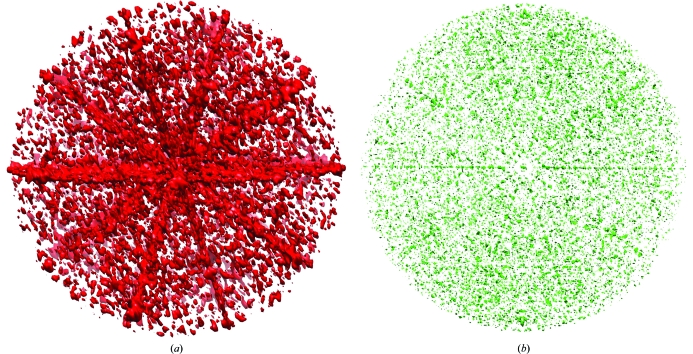
In the red phase set, structure factors with phases close to 0 or π are ∼35% overrepresented in comparison to structure factors with other phases (Fig. 5 ▶). This is caused by the presence of the 30 icosahedral twofold-symmetry axes and their effect on structure-factor phases, as explained in §1. A three-dimensional plot of reflections that have phases within 20° of either 0° or 180° shows that they accumulate in central planes perpendicular to twofold axes (Fig. 6 ▶ a) for reasons explained in §1. For icosahedral symmetry there are five twofold axes perpendicular to each fivefold axis. Thus, each fivefold axis is at the intersection of five planes in reciprocal space where all phases are likely to be centric. Similarly, the threefold and twofold axes are at the intersection of three and two such planes. Thus, there are five, three and two times as many centric reflections surrounding each fivefold, threefold and twofold axis, respectively, in reciprocal space than for a general point on a central plane perpendicular to a twofold axis. Similarly, a plot of reflections that have amplitude larger than twice the average amplitude in their resolution shell shows an accumulation of these reflections along icosahedral symmetry axes in proportion to the multiplicity of their symmetry (Fig. 6 ▶ b).
Figure 5.
Frequency distribution of structure factors versus their phase angle as determined by successful phase extension (αR). Note that the vertical axis starts at 7000.
Figure 6.
Reciprocal-space regions in which structure factors have approximately centric phases and strong amplitudes. (a) Structure factors with phase angles within 20° of 0° or 180° for the successful phase extension αR are shown in red. (b) Structure factors with normalized amplitudes greater than two are shown in green.
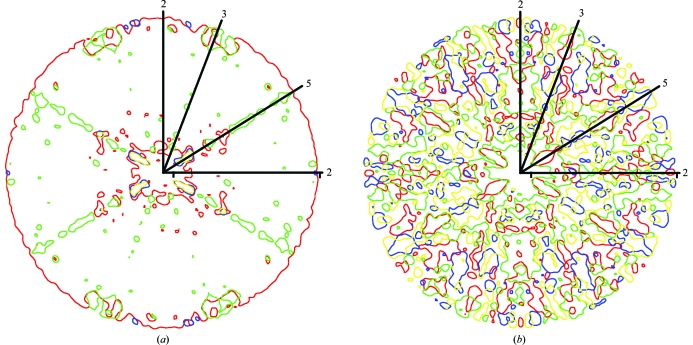
3.4. Reciprocal-space volumes around NCS axes can seed incorrect phase solutions
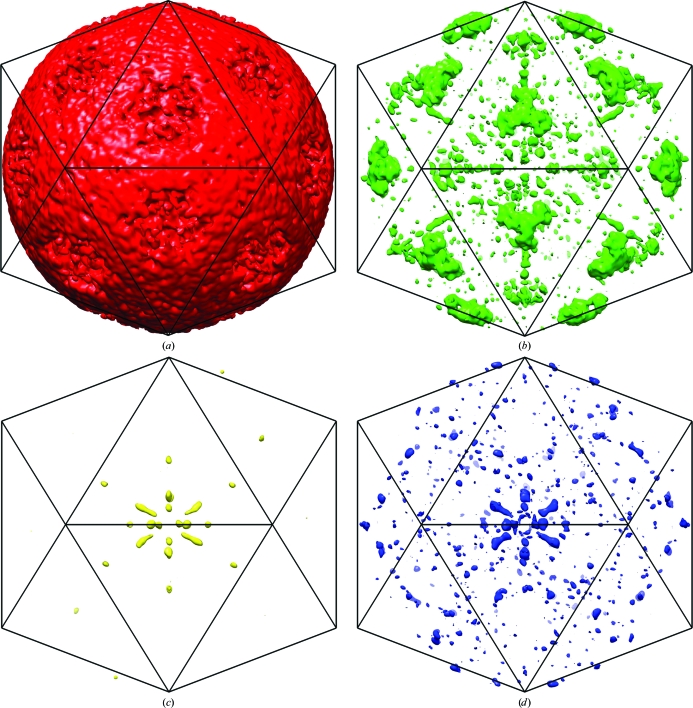
Previous thinking was that a specific phase set might become dominant within a resolution shell as all the reflections of about the same resolution can interact strongly with one another because the G function can only be large when the reflections at h and p have about the same interplanar spacing (i.e. about the same resolution; equation 3). This was borne out in the observation of ‘bumps’ in the plots of correlation coefficients against resolution. It was thought that the valleys between bumps were regions in which different phase sets were fighting each other, making for poor results in satisfying (1) (Arnold et al., 1987 ▶). However, based on the current analysis it appears that wrong phase sets can be seeded from reflections that are near the NCS axes in reciprocal space or are close to planes in reciprocal space that are orthogonal to NCS twofold axes (Figs. 7 ▶ and 8 ▶). As shown above theoretically and here experimentally, the phases in these regions are near 0 or π and on average are more intense than other reflections. Thus, not only are the phases in these regions consistent with any of the four phase solutions but, because of their larger than average intensity, they will have a greater than average impact on surrounding reflections. Phases near 0 and π are shared between the correct and enantiomorphic solutions of both correct and Babinet opposite phase sets (Figs. 3 ▶ c and 3 ▶ d). Thus, regions of reciprocal space close to the NCS axes may become seeded with different phase solutions. For instance, in the successful phase determination the regions around the icosahedral threefold axes at the high-resolution limit belonged to the enantiomorphic solution (Figs. 6 ▶ a and 7 ▶ b).
Figure 7.
Central sections of reciprocal space containing icosahedral NCS axes, showing regions with structure-factor angles belonging to different phase solutions. (a) Successful phase extension (αR). (b) Failed phase extension (αG). Regions of structure factors with correct phases are shown in red, the enantiomorph in green, the Babinet opposite in blue and the enantiomorph of the Babinet opposite in yellow. Lines with numbers indicate the positions of icosahedral symmetry axes.
Figure 8.
Three-dimensional distribution of structure factors with phases calculated in the successful phase extension (αR) belonging to different phase solution sets. Structure factors with phases belonging to the correct solution are shown in red (a), the enantiomorph in green (b), the Babinet opposite in yellow (c) and the enantiomorph of the Babinet opposite in blue (d). The icosahedral mesh shows the orientation of the icosahedral NCS.
The analyses reported here have shown that the primary cause for obtaining an initial uninterpretable electron-density map was the choice of a far too liberal envelope for averaging. The situation was probably accentuated in the triclinic system, in which the size of the viral particle approached that of the unit cell, requiring more caution when determining the step size for each resolution extension. The results have also shown that regions of reciprocal space around NCS axes are most prone to seeding false solutions.
Acknowledgments
We thank Sheryl Kelly for help with the preparation of the manuscript. We are grateful to Donald L. D. Caspar for providing the diffraction image of the crystal of tobacco bushy stunt virus. This work was supported by a National Institutes of Health grant to MGR (AI11219).
References
- Abad-Zapatero, C., Abdel-Meguid, S. S., Johnson, J. E., Leslie, A. G., Rayment, I., Rossmann, M. G., Suck, D. & Tsukihara, T. (1980). Nature (London), 286, 33–39. [DOI] [PubMed]
- Arnold, E., Vriend, G., Luo, M., Griffith, J. P., Kamer, G., Erickson, J. W., Johnson, J. E. & Rossmann, M. G. (1987). Acta Cryst. A43, 346–361.
- Bloomer, A. C., Champness, J. N., Bricogne, G., Staden, R. & Klug, A. (1978). Nature (London), 276, 362–368. [DOI] [PubMed]
- Bricogne, G. (1976). Acta Cryst. A32, 832–847.
- Buehner, M., Ford, G. C., Moras, D., Olsen, K. W. & Rossman, M. G. (1973). Proc. Natl Acad. Sci. USA, 70, 3052–3054. [DOI] [PMC free article] [PubMed]
- Buehner, M., Ford, G. C., Olsen, K. W., Moras, D. & Rossman, M. G. (1974). J. Mol. Biol. 90, 25–49. [DOI] [PubMed]
- Caspar, D. L. (1956). Nature (London), 177, 475–476. [DOI] [PubMed]
- Chapman, M. S., Tsao, J. & Rossmann, M. G. (1992). Acta Cryst. A48, 301–312. [DOI] [PubMed]
- Cornea-Hasegan, M. A., Zhang, Z., Lynch, R. E., Marinescu, D. C., Hadfield, A., Muckelbauer, J. K., Munshi, S., Tong, L. & Rossmann, M. G. (1995). Acta Cryst. D51, 749–759. [DOI] [PubMed]
- Crowther, R. A. (1967). Acta Cryst. 22, 758–764.
- Crowther, R. A. (1969). Acta Cryst. B25, 2571–2580. [DOI] [PubMed]
- Gaykema, W. P. J., Hol, W. G. J., Vereijken, J. M., Soeter, N. M., Bak, H. J. & Beintema, J. J. (1984). Nature (London), 309, 23–29.
- Harrison, S. C., Olson, A. J., Schutt, C. E., Winkler, F. K. & Bricogne, G. (1978). Nature (London), 276, 368–373. [DOI] [PubMed]
- Jones, T. A. (1992). Proceedings of the CCP4 Study Weekend. Molecular Replacement, edited by E. Dodson, S. Gover & W. Wolf, pp. 91–105. Warrington: Daresbury Laboratory.
- Kaufmann, B., El-Far, M., Plevka, P., Bowman, V. D., Li, Y., Tijssen, P. & Rossmann, M. G. (2011). J. Virol. 85, 4691–4697. [DOI] [PMC free article] [PubMed]
- Kaufmann, B., Simpson, A. A. & Rossmann, M. G. (2004). Proc. Natl Acad. Sci. USA, 101, 11628–11633. [DOI] [PMC free article] [PubMed]
- Kleywegt, G. J. & Read, R. J. (1997). Structure, 5, 1557–1569. [DOI] [PubMed]
- Kleywegt, G. J., Zou, J.-Y., Kjeldgaard, M. & Jones, T. A. (2001). International Tables for Crystallograhy, Vol. F, edited by M. G. Rossmann & E. Arnold, pp. 353–356. Dordrecht/Boston/London: Kluwer Academic Publishers.
- Ludtke, S. J., Baldwin, P. R. & Chiu, W. (1999). J. Struct. Biol. 128, 82–97. [DOI] [PubMed]
- Main, P. (1967). Acta Cryst. 23, 50–54.
- Main, P. & Rossmann, M. G. (1966). Acta Cryst. 21, 67–72.
- Matthews, B. W., Sigler, P. B., Henderson, R. & Blow, D. M. (1967). Nature (London), 214, 652–656. [DOI] [PubMed]
- McKenna, R., Xia, D., Willingmann, P., Ilag, L. L. & Rossmann, M. G. (1992). Acta Cryst. B48, 499–511. [DOI] [PubMed]
- Pettersen, E. F., Goddard, T. D., Huang, C. C., Couch, G. S., Greenblatt, D. M., Meng, E. C. & Ferrin, T. E. (2004). J. Comput. Chem. 25, 1605–1612. [DOI] [PubMed]
- Rossmann, M. G. (1972). The Molecular Replacement Method. A Collection of Papers on the Use of Non-Crystallographic Symmetry. New York: Gordon & Breach.
- Rossmann, M. G. (1989). Proceedings of the CCP4 Study Weekend. Improving Protein Phases, edited by S. Bailey, E. Dodson & S. Phillips, pp. 49–56. Warrington: Daresbury Laboratory.
- Rossmann, M. G. (1990). Acta Cryst. A46, 73–82. [DOI] [PubMed]
- Rossmann, M. G., Arnold, E., Erickson, J. W., Frankenberger, E. A., Griffith, J. P., Hecht, H.-J., Johnson, J. E., Kamer, G., Luo, M. & Mosser, A. G. (1985). Nature (London), 317, 145–153. [DOI] [PubMed]
- Rossmann, M. G. & Blow, D. M. (1962). Acta Cryst. 15, 24–31.
- Rossmann, M. G. & Blow, D. M. (1963). Acta Cryst. 16, 39–45.
- Rossmann, M. G. & Blow, D. M. (1964). Acta Cryst. 17, 1474–1475.
- Rossmann, M. G. & Henderson, R. (1982). Acta Cryst. A38, 13–20.
- Rossmann, M. G., McKenna, R., Tong, L., Xia, D., Dai, J., Wu, H., Choi, H. K. & Lynch, R. E. (1992). J. Appl. Cryst. 25, 166–180.
- Simpson, A. A., Chipman, P. R., Baker, T. S., Tijssen, P. & Rossmann, M. G. (1998). Structure, 6, 1355–1367. [DOI] [PMC free article] [PubMed]
- Tong, L. & Rossmann, M. G. (1995). Acta Cryst. D51, 347–353. [DOI] [PubMed]
- Tong, L. & Rossmann, M. G. (1997). Methods Enzymol. 276, 594–611. [PubMed]
- Tsao, J., Chapman, M. S., Agbandje, M., Keller, W., Smith, K., Wu, H., Luo, M., Smith, T. J., Rossmann, M. G. & Compans, R. W. (1991). Science, 251, 1456–1464. [DOI] [PubMed]
- Tsao, J., Chapman, M. S., Wu, H., Agbandje, M., Keller, W. & Rossmann, M. G. (1992). Acta Cryst. B48, 75–88. [DOI] [PubMed]
- Valegård, K., Liljas, L., Fridborg, K. & Unge, T. (1990). Nature (London), 345, 36–41. [DOI] [PubMed]
- Winn, M. D. et al. (2011). Acta Cryst. D67, 235–242.


