The Cu-containing nitrite reductase from G. kaustophilus has been overexpressed, purified and crystallized in space group R3. The crystals diffracted to 1.3 Å resolution.
Keywords: nitrite reductases, copper, denitrification, Gram-positive bacteria
Abstract
The soluble region (residues 32–354) of GK0767, a copper-containing nitrite reductase from the thermophilic Gram-positive bacterium Geobacillus kaustophilus HTA426, has been cloned and overexpressed in Escherichia coli. The purified recombinant protein was crystallized using the hanging-drop vapour-diffusion method. X-ray diffraction data were collected and processed to a maximum resolution of 1.3 Å. The crystals belonged to space group R3, with unit-cell parameters a = b = 115.1, c = 87.5 Å. Preliminary studies and molecular-replacement calculations reveal the presence of one subunit of the homotrimeric structure in the asymmetric unit; this corresponds to a V M value of 3.14 Å3 Da−1.
1. Introduction
Denitrification, known as an example of anaerobic respiration, is a process in which nitrogenous compounds are used as alternative electron acceptors for energy production in living cells (Knowles, 1982 ▶). Recent earth-science and geochemical studies have revealed that the process contributes to the greenhouse effect and destruction of the ozone layer and it is also the major process for the return of fixed nitrogen to the atmosphere (Zumft, 1997 ▶). Complete denitrification involves four reaction steps (NO3 −→NO2 −→NO→N2O→N2) catalyzed by nitrate reductase, nitrite reductase, nitric oxide reductase and nitrous oxide reductase, respectively. One-electron reduction of NO2 − to NO by nitrite reductase has been focused on as a key step in the denitrification process because this is the first step that leads to the gaseous products NO, N2O and N2.
Geobacillus is a phenotypically and phylogenetically coherent genus of thermophilic bacilli with high 16S rRNA sequence similarity (98.5–99.2%) and was separated from the genus Bacillus (Nazina et al., 2001 ▶). Members of Geobacillus have been isolated from various terrestrial and marine environments not only in geothermal areas but also in temperate regions and permanently cold habitats (McMullan et al., 2004 ▶), demonstrating a great capability for adaptation to a wide variety of environmental niches. G. kaustophilus HTA426, which was isolated from deep-sea sediment in the Mariana Trench, is a thermophilic organism of immense research interest. It grows optimally at 333 K, with an upper temperature limit of 347 K (Takami et al., 1997 ▶; Takami, Nishi et al., 2004 ▶). Its complete genome sequence has been reported as the first example of a thermophilic Bacillus-related species and is composed of a 3.54 Mb chromosome and a 47.9 kb plasmid (Takami, Takaki et al., 2004 ▶). Meanwhile, G. thermodenitrificans is a facultative aerobe that is capable of growth by denitrification (Manachini et al., 2000 ▶). Recently, genomic study of denitrifying G. thermodenitrificans NG80-2 has revealed the presence of complete gene clusters for denitrification: the first example in a Gram-positive bacterium (Feng et al., 2007 ▶). The genome sizes and structures are quite similar in these two Geobacillus strains. The 2578 (74.9% of total putative proteins) NG80-2 genes have orthologues with an average protein identity of 83.2% in G. kaustophilus HTA426 and genome-wide synteny of orthologues between the two strains has also been detected (Feng et al., 2007 ▶).
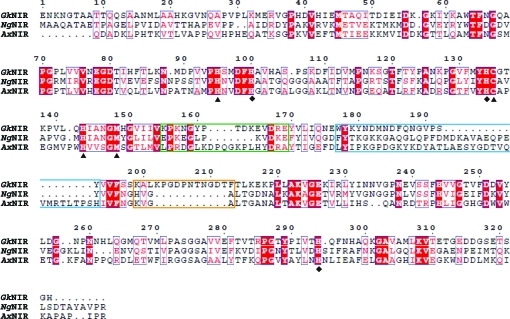
The amino-acid sequence deduced from the nirK gene (GK0767) encoding copper-containing nitrite reductase (CuNIR) in G. kaustophilus HTA426 shows extremely high similarity not only to GT0650 (96% identity) encoding NirK in G. thermodenitrificans NG80-2 but also to ADP75747.1 (82% identity) from Geobacillus sp. Y4.1MC1. However, the sequences also show relatively low similarities (∼30%) to well known CuNIRs, although the residues in the Cu-binding sites and enzymatic functions are well conserved. This finding prompts speculation that Geobacillus CuNIRs commonly adapt to environmental stress by conformational changes arising from amino-acid replacements, deletions and/or insertions in the sequences. Moreover, a ClustalW alignment analysis (Thompson et al., 1994 ▶) between G. kaustophilus CuNIR (GkNIR), Achromobacter xylosoxidans CuNIR (AxNIR; 19% identity to GkNIR) as a class I CuNIR (Suzuki et al., 1999 ▶) and Neisseria gonorrhoeae CuNIR (NgNIR; 27% identity to GkNIR) as a class II CuNIR (Boulanger & Murphy, 2002 ▶) reveals the presence of three characteristic loop regions in the amino-acid sequences of Geobacillus CuNIRs, which are named the ‘linker loop’, ‘tower loop’ and ‘extra loop’ in this study (Fig. 1 ▶). Therefore, determination and analysis of the three-dimensional structure of Geobacillus CuNIR is indispensable for a deeper understanding of the adaptive evolution of the CuNIR molecule at the atomic level.
Figure 1.
Sequence comparison between Geobacillus CuNIR and well known CuNIRs. Abbreviations and accession numbers are as follows: GkNIR, GK0767 from G. kaustophilus strain HTA426 (gi:56419302); NgNIR, CuNIR from N. gonorrhoeae strain FA1090 (gi:59718528); AxNIR, CuNIR from A. xylosoxidans strain GIFU1051 (gi:3721763). ClustalW was used to perform sequence alignment (Thompson et al., 1994 ▶) and the figure was generated using the program ESPript (Gouet et al., 1999 ▶). Diamonds, type 1 Cu ligands; squares, type 2 Cu ligands. The three characteristic loop regions in GkNIR are shown in coloured boxes: green, linker loop; blue, tower loop; orange, extra loop.
Here, we describe the cloning, expression, purification, crystallization and preliminary X-ray analysis of GK0767, a copper-containing nitrite reductase from G. kaustophilus HTA426, as a first example of a Geobacillus CuNIR.
2. Experimental methods
2.1. Cloning, expression and purification
The gene encoding the putative soluble region from residues Glu32 to His354 of GK0767 was amplified by PCR using the genomic DNA of G. kaustophilus HTA426 as a template. The N-terminal region from Met1 to Ala31 was assumed to be a signal peptide for secretion using the amino-acid sequence-based prediction server SignalP3.0 (http://www.cbs.dtu.dk/services/SignalP/; Emanuelsson et al., 2007 ▶). Moreover, the lipobox motif (Babu et al., 2006 ▶) for the lipid-modified cysteine site (18LAA21C), which functions as an anchor to the cell membrane, was also found in this region. To identify whether this protein binds to the cell membrane using the putative lipid-modified site, it would probably be best to investigate the native form from the original growth culture. However, there was only a trace expression level under the cultivation conditions reported previously. Therefore, in this study the N-terminal region was deleted using a genetic engineering procedure for efficient overexpression in Escherichia coli. Sites for the restriction enzymes NdeI (CATATG) and HindIII (AAGCTT) were incorporated into the sequences of the forward and reverse primers, 5′-TACATATGGAAAATAAAAACGGAACAGCGGCAACTA-3′ and 5′-GGAAGCTT AATGTCCGCTTGTTTCTGAGCCG-3′, respectively. The underlined parts of each sequence indicate the start and stop codons for amino-acid translation, respectively. The product DNA fragment was cloned into the T7 expression vector pET-20b(+) opened by digestion with NdeI and HindIII. The presence of the inserted gene was confirmed by DNA-sequence analysis. As a result, a Met residue originating from the vector was added at the N-terminus before the Glu32 residue of GkNIR and the Glu residue was then numbered as the first residue in this study for clarity.
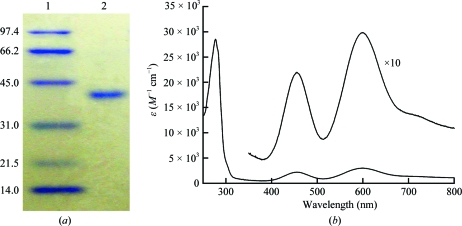
Plasmids for recombinant expression of GkNIR were transformed into E. coli strain Rossetta-gami (DE3). 1.5 l Luria–Bertani medium containing 200 µg ml−1 ampicillin, 1.0 mM CuSO4 and 4.0 mg ml−1 glucose was inoculated with colonies from a plate of the same medium cultured overnight at 310 K. The recombinant cells were incubated in the liquid medium for 24 h at 310 K. The cells were collected by centrifugation, washed with 40 mM Tris–HCl pH 8.0 (buffer A) containing 0.9%(w/v) NaCl and resuspended in 60 ml buffer A containing 1.0 mM CuSO4 and 0.5 mM phenylmethylsulfonyl fluoride. The cells were disrupted by sonication in a chilled water bath and the cell lysate was incubated at 343 K for 30 min. The sample was centrifuged at 15 000g for 60 min and the supernatant was loaded onto a DEAE-Sepharose column (GE Healthcare UK Ltd, Buckinghamshire, England) pre-equilibrated with buffer A. After a wash with buffer A, the proteins were eluted with buffer A containing 0.2 M NaCl. The fractions containing GkNIR were collected and a 40% saturated concentration of ammonium sulfate was added to the sample solution. After incubation at 277 K for 30 min, the solution was centrifuged at 15 000g for 30 min and the supernatant was loaded onto a Phenyl-Sepharose column (GE Healthcare UK Ltd, Buckinghamshire, England) pre-equilibrated with buffer A containing a 40% saturated concentration of ammonium sulfate. After elution with buffer A, the fractions containing GkNIR were collected and dialysed with buffer A at 277 K for 12 h. The sample was loaded onto a Q-Sepharose column (GE Healthcare UK Ltd, Buckinghamshire, England) pre-equilibrated with buffer A and after a wash with buffer A containing 0.1 M NaCl the protein was eluted with a linear gradient of NaCl concentration from 0.1 to 0.2 M. GkNIR was estimated to be >95% pure using SDS–PAGE; the absorption ratio (A 280/A 600) was 9.3 (Fig. 2 ▶).
Figure 2.
SDS–PAGE profile and UV–Vis absorption spectrum of the purified GkNIR protein. (a) 12.5% SDS–PAGE. Lane 1, molecular-weight markers; the size of each protein (in kDa) is shown on the left. Lane 2, GkNIR (3 µg). (b) UV–Vis absorption spectrum. The spectrum was measured in 40 mM Tris–HCl pH 8.0 at 298 K using a Shimadzu UV-2450 spectrophotometer. A 10× enlarged spectrum in the range 350–800 nm is also shown for clarity.
2.2. Crystallization experiments
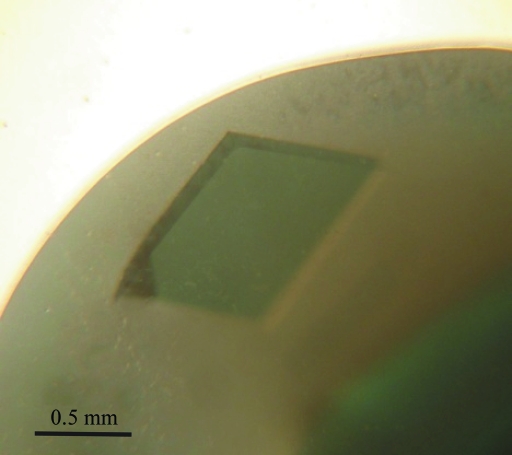
The protein was concentrated using a Millipore Centriprep-YM30 (30 kDa molecular-weight cutoff, Millipore, Massachusetts, USA). The protein concentration was determined by measuring the absorbance at 280 nm. A preliminary crystallization screen was carried out using Crystal Screen, Crystal Screen 2, MembFac and PEG/Ion kits (Hampton Research, California, USA). Hanging-drop vapour-diffusion experiments were set up by pipetting drops consisting of 1 µl protein solution (20 mg ml−1) and 1 µl well solution at 277 K. After optimization of the best screening condition, X-ray diffraction-quality crystals were grown in hanging drops consisting of 3 µl protein solution (250 mg ml−1) and 3 µl well solution and the drops were equilibrated against 0.3 ml well solution [0.1 M acetate buffer pH 4.6, 5.5%(w/v) PEG 4000 and 175 mM ZnSO4] at 293 K. The approximate dimensions of the GkNIR crystals were 0.7 × 1.0 × 0.2 mm (Fig. 3 ▶).
Figure 3.
Crystal of GkNIR. The crystal has approximate dimensions of 0.7 × 1.0 × 0.2 mm.
2.3. Data collection and processing
Prior to synchrotron data collection, the crystals were rinsed with well solution containing 29.5%(v/v) 2-methyl-2,4-pentanediol as a cryoprotectant and then flash-cooled by immersion in liquid nitrogen. A data set was collected from a single crystal at 100 K on beamline BL38B1 at SPring-8 (Hyogo, Japan) using an ADSC Quantum 210 CCD detector (Area Detector Systems Co., California, USA). The HKL-2000 package (Otwinowski & Minor, 1997 ▶) and SCALA (Evans, 2006 ▶) as implemented in the CCP4 package (Winn et al., 2011 ▶) were used to reduce, integrate and scale the collected data. Crystallographic statistics of the data are summarized in Table 1 ▶.
Table 1. Crystal parameters and data-collection statistics for GkNIR.
Values in parentheses are for the highest resolution shell.
| Wavelength (Å) | 1.0 |
| Resolution (Å) | 18.9–1.30 (1.37–1.30) |
| Space group | R3 |
| Unit-cell parameters (Å) | a = b = 115.1, c = 87.5 |
| Rmerge† | 0.080 (0.358) |
| Rp.i.m.‡ | 0.042 (0.256) |
| 〈I/σ(I)〉 | 14.9 (2.4) |
| No. of observations | 356275 (33749) |
| No. of unique reflections | 101119 (14139) |
| Completeness (%) | 95.2 (90.8) |
| Multiplicity | 3.5 (2.4) |
| Crystal mosaicity (°) | 0.42 |
R
merge = 
 , where Ii(hkl) is the ith observation of reflection hkl and 〈I(hkl)〉 is the average intensity for all observations i of reflection hkl.
R
p.i.m. = 
 .
.
3. Results and discussion
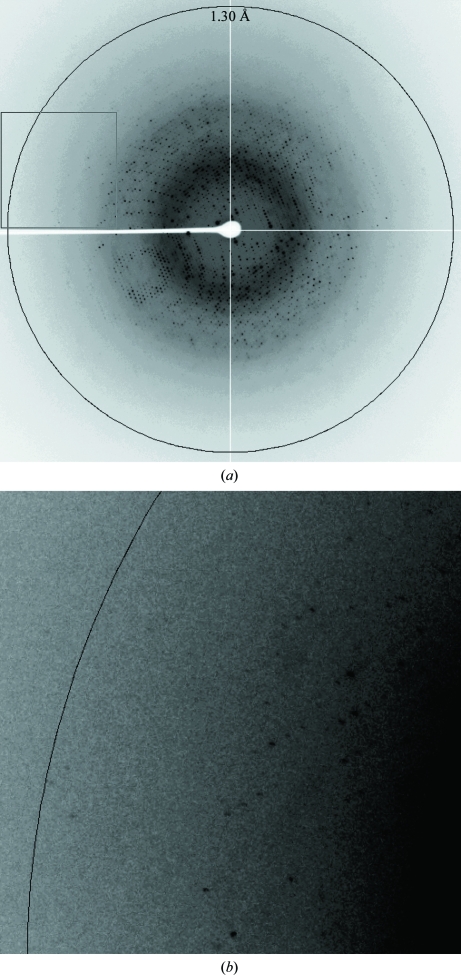
The crystal diffracted to 1.3 Å resolution and belonged to the rhombohedral space group R3, with unit-cell parameters a = b = 115.1, c = 87.5 Å for the hexagonal cell (Fig. 4 ▶). Considering the molecular weight of GkNIR (35 471 Da) and the cell volume (1 003 414.062 Å3) and assuming the presence of one or two polypeptide chains of GkNIR in the asymmetric unit, the calculated V M values (Matthews, 1968 ▶) were 3.14 and 1.57 Å3 Da−1, corresponding to solvent contents of 60.9 and 21.8%, respectively.
Figure 4.
One-shot image of the diffraction pattern of a GkNIR crystal. The pattern displays a maximum resolution of 1.3 Å and the crystal belongs to space group R3. (a) Overall image of one shot. (b) Enlargement of the inset box region of the overall image with adjusted background level for clarity.
Molecular replacement with a monomeric subunit of NgNIR (PDB entry 1kbw; Boulanger & Murphy, 2002 ▶) as a search model was performed in the resolution range 15.0–4.0 Å using Phaser (McCoy et al., 2007 ▶), which gave only one solution, with a log-likelihood gain (LLG) of 69.5, in space group R3. Furthermore, a Patterson self-rotation calculation confirmed the absence of a crystallographic twofold-symmetry axis, which should be present if the space group was R32 and not R3. Interpretable electron density for the GkNIR molecule was observed in difference Fourier 2F o − F c and F o − F c maps calculated using phases from partial refinement of the GkNIR model. Refinement using REFMAC (Murshudov et al., 1997 ▶) and manual model building of the GkNIR molecule using Coot (Emsley & Cowtan, 2004 ▶) are in progress.
Acknowledgments
Synchrotron-radiation experiments were performed on beamline BL44XU [Proposal No. 2009A6931 (to MN)] and beamline BL38B1 [Proposal No. 2010A1921 (to TT)] at SPring-8 with the approval of the Japan Synchrotron Radiation Research Institute. This work was supported in part by Grants-in-Aid for Encouragement of Young Scientists (B) 20750137 (to MN) and Scientific Research (B) 20350078 (to SS) from the Ministry of Education, Science, Sports and Culture of Japan.
References
- Babu, M. M., Priya, M. L., Selvan, A. T., Madera, M., Gough, J., Aravind, L. & Sankaran, K. (2006). J. Bacteriol. 188, 2761–2773. [DOI] [PMC free article] [PubMed]
- Boulanger, M. J. & Murphy, M. E. (2002). J. Mol. Biol. 315, 1111–1127. [DOI] [PubMed]
- Emanuelsson, O., Brunak, S., von Heijne, G. & Nielsen, H. (2007). Nature Protoc. 2, 953–971. [DOI] [PubMed]
- Emsley, P. & Cowtan, K. (2004). Acta Cryst. D60, 2126–2132. [DOI] [PubMed]
- Evans, P. (2006). Acta Cryst. D62, 72–82. [DOI] [PubMed]
- Feng, L., Wang, W., Cheng, J., Ren, Y., Zhao, G., Gao, C., Tang, Y., Liu, X., Han, W., Peng, X., Liu, R. & Wang, L. (2007). Proc. Natl Acad. Sci. USA, 104, 5602–5607. [DOI] [PMC free article] [PubMed]
- Gouet, P., Courcelle, E., Stuart, D. I. & Métoz, F. (1999). Bioinformatics, 15, 305–308. [DOI] [PubMed]
- Knowles, R. (1982). Microbiol. Rev. 46, 43–70. [DOI] [PMC free article] [PubMed]
- Manachini, P. L., Mora, D., Nicastro, G., Parini, C., Stackebrandt, E., Pukall, R. & Fortina, M. G. (2000). Int. J. Syst. Evol. Microbiol. 50, 1331–1337. [DOI] [PubMed]
- Matthews, B. W. (1968). J. Mol. Biol. 33, 491–497. [DOI] [PubMed]
- McCoy, A. J., Grosse-Kunstleve, R. W., Adams, P. D., Winn, M. D., Storoni, L. C. & Read, R. J. (2007). J. Appl. Cryst. 40, 658–674. [DOI] [PMC free article] [PubMed]
- McMullan, G., Christie, J. M., Rahman, T. J., Banat, I. M., Ternan, N. G. & Marchant, R. (2004). Biochem. Soc. Trans. 32, 214–217. [DOI] [PubMed]
- Murshudov, G. N., Vagin, A. A. & Dodson, E. J. (1997). Acta Cryst. D53, 240–255. [DOI] [PubMed]
- Nazina, T. N., Tourova, T. P., Poltaraus, A. B., Novikova, E. V., Grigoryan, A. A., Ivanova, A. E., Lysenko, A. M., Petrunyaka, V. V., Osipov, G. A., Belyaev, S. S. & Ivanov, M. V. (2001). Int. J. Syst. Evol. Microbiol. 51, 433–446. [DOI] [PubMed]
- Otwinowski, Z. & Minor, W. (1997). Methods Enzymol. 276, 307–326. [DOI] [PubMed]
- Suzuki, S., Kataoka, K., Yamaguchi, K., Inoue, T. & Kai, Y. (1999). Coord. Chem. Rev. 190–192, 245–265.
- Takami, H., Inoue, A., Fuji, F. & Horikoshi, K. (1997). FEMS Microbiol. Lett. 152, 279–285. [DOI] [PubMed]
- Takami, H., Nishi, S., Lu, J., Shimamura, S. & Takaki, Y. (2004). Extremophiles, 8, 351–356. [DOI] [PubMed]
- Takami, H., Takaki, Y., Chee, G.-J., Nishi, S., Shimamura, S., Suzuki, H., Matsui, S. & Uchiyama, I. (2004). Nucleic Acids Res. 32, 6292–6303. [DOI] [PMC free article] [PubMed]
- Thompson, J. D., Higgins, D. G. & Gibson, T. J. (1994). Nucleic Acids Res. 22, 4673–4680. [DOI] [PMC free article] [PubMed]
- Winn, M. D. et al. (2011). Acta Cryst. D67, 235–242.
- Zumft, W. G. (1997). Microbiol. Mol. Biol. Rev. 61, 533–616. [DOI] [PMC free article] [PubMed]


