

Abstract
Single-nucleotide variations are the most widely distributed genetic markers in the human genome. A subset of these variations, the substitution mutations, are responsible for most genetic disorders. As single nucleotide polymorphism (SNP) markers are being developed for molecular diagnosis of genetic disorders and large-scale population studies for genetic analysis of complex traits, a simple, sensitive, and specific test for single nucleotide changes is highly desirable. In this report we describe the development of a homogeneous DNA detection method that requires no further manipulations after the initial reaction is set up. This assay, named dye-labeled oligonucleotide ligation (DOL), combines the PCR and the oligonucleotide ligation reaction in a two-stage thermal cycling sequence with fluorescence resonance energy transfer (FRET) detection monitored in real time. Because FRET occurs only when the donor and acceptor dyes are in close proximity, one can infer the genotype or mutational status of a DNA sample by monitoring the specific ligation of dye-labeled oligonucleotide probes. We have successfully applied the DOL assay to genotype 10 SNPs or mutations. By designing the PCR primers and ligation probes in a consistent manner, multiple assays can be done under the same thermal cycling conditions. The standardized design and execution of the DOL assay means that it can be automated for high-throughput genotyping in large-scale population studies.
The ability to determine efficiently and unambiguously the mutational status or genotype of any living organism has great applications in molecular diagnostics, clinical genetic testing, population genetics, and agricultural biotechnology (Risch and Merikangas 1996; Collins et al. 1997). High-throughput detection methods for single-nucleotide variations currently in use include homogeneous methods such as the template-directed dye-terminator incorporation (TDI) assay (Chen and Kwok 1997), the 5′-nuclease allele-specific hybridization TaqMan assay (Livak et al. 1995b), and the recently described allele-specific molecular beacon assay (Tyagi et al. 1998). The TDI assay combines PCR and specific primer extension with fluorescence resonance energy transfer (FRET) detection and requires almost no optimization, but it requires three separate steps that include adding reagents twice after the initial reaction setup (Chen et al. 1997). The TaqMan assay is the simplest of all diagnostic assays in which one can determine the mutational status of a DNA sample in one step during PCR (Livak et al. 1995b). However, the TaqMan assay has the stringent requirement that a perfectly complementary internal probe hybridizes and is cleaved at the polymorphic site during the strand extension phase in PCR, whereas the corresponding probe with a 1-base mismatch does not. This requires some optimization and may be difficult to achieve in AT-rich domains. Allele discrimination by use of molecular beacons of four different colors has been shown to work very well when synthetic oligonucleotides are used as targets, but assay conditions for amplified or genomic DNA targets are still being worked out (Tyagi et al. 1998).
Here, we report the development of the DOL assay that has all the desirable properties of a homogeneous DNA detection test. It combines the highly sensitive and specific PCR–OLA (oligonucleotide ligation assay) with FRET detection in one reaction in which the mutational status or genotype is determined without any purification or manipulation after the reaction is set up initially. FRET is observed when two fluorescent dyes are in close proximity and the donor dye’s emission spectrum overlaps the acceptor dye’s excitation spectrum. When the donor is excited, the donor’s specific emission decreases (quenching) with a concomitant increase in the acceptor’s specific emission (Foster 1965). Although the efficiency of FRET is very sensitive to the distance between the donor and acceptor, with energy transfer dropping dramatically as the distance between them increases, the hydrophobic interactions between the dyes make it possible to observe FRET even when the donor and acceptor are placed >30 bases apart on an oligonucleotide in an aqueous solution (Livak et al. 1995a; Chen and Kwok 1997) The ability to detect intramolecular FRET against the background of unquenched donor emission provides a detection system that requires no separation or purification of the product in the DOL assay. The changes in fluorescence intensities during the ligation reaction can be monitored in real time by a fluorescence spectrophotometer connected to a thermal cycler, or at its end point by means of a fluorescence plate reader.
The experimental design of this study is shown in Figure 1. PCR primers are designed to have high melting temperatures (Tms) with the aid of a primer selection program. Three dye-labeled ligation probes are needed for each biallelic marker. A 5′-donor dye-labeled common probe is designed to terminate one base immediately upstream from the polymorphic site. Two allele-specific, 5′-phosphorylated, 3′-acceptor dye-labeled probes are designed to have the allelic base at the 5′-end. All three ligation probes are designed with the same primer selection program to have matching but low Tms. The donor dye used in this study is FAM (5-carboxy-fluorescein), the acceptor dyes used are ROX (6-carboxy-X-rhodamine) and TAMRA (N,N,N′,N′-tetramethyl-6-carboxyrhodamine). A thermostable DNA polymerase with no 5′-nuclease activity (AmpliTaq, FS) and a thermostable DNA ligase (Ampligase) are used. The genomic DNA test sample is added to the reaction mixture containing the two PCR primers, three ligation probes, AmpliTaq, FS DNA polymerase, Ampligase, and a reaction buffer containing nicotinamide–adenine dinucleotide (NAD). Thermal cycling is performed in a thermal cycler equipped with a spectrophotometer such that fluorescence intensities of the donor and acceptor dyes can be monitored in real time. During the first (PCR) stage of the reaction, the annealing/extension temperature is kept high (∼65°C) such that the ligation probes are unable to anneal. This prevents the extension of the FAM-labeled ligation probe during the PCR phase of the reaction. After sufficient PCR products have been formed, the second (ligation) stage of the reaction is done with low annealing/ligation temperature (∼45°C) such that the ligation probes can anneal and be ligated together. The use of a DNA polymerase (AmpliTaq, FS) lacking 5′-nuclease activity prevents the cleavage of ligation probes during the ligation phase of the reaction.
Figure 1.
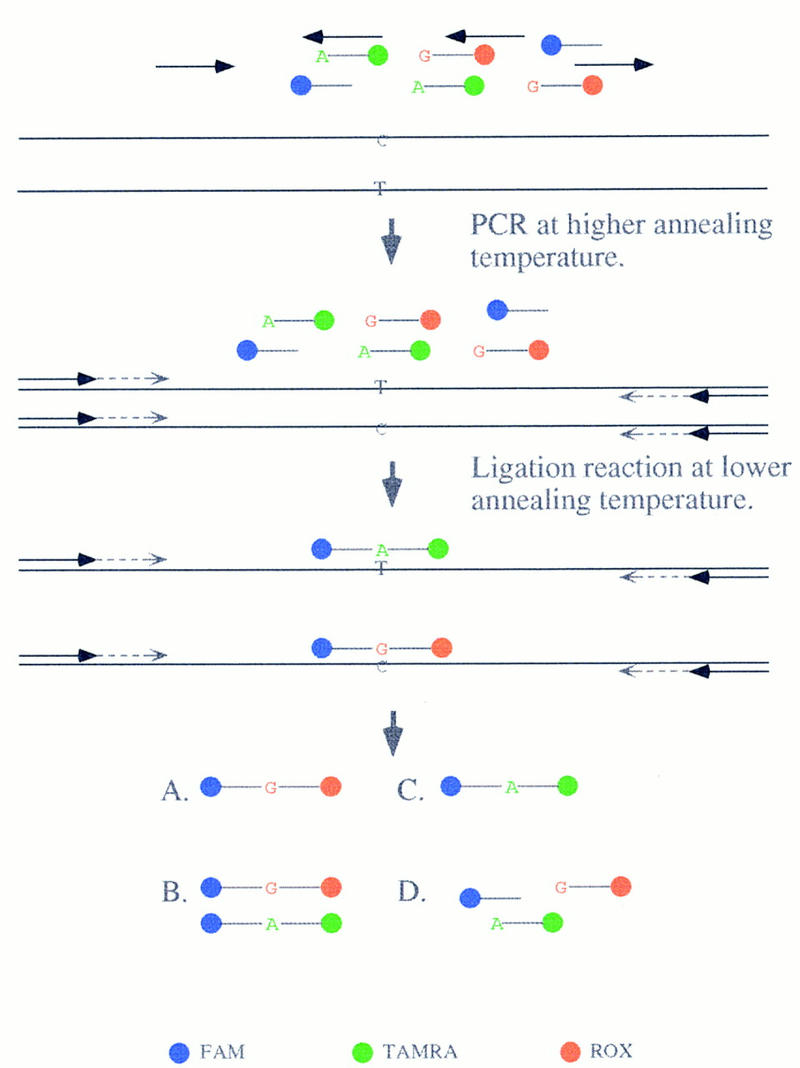
DOL assay with FRET detection. All of the reagents, including DNA polymerase, DNA ligase, PCR primers, and ligation probes, are added to the test DNA sample when the reaction is first set up. In a two-stage thermal cycling sequence, PCR is allowed to proceed without the ligation probe annealing to the target followed by the ligation reaction when enough PCR product has accumulated. At the end of the assay, there are four possible outcomes for each test sample: (A) homozygous for the first allele leading to the formation of a ligation product containing the G allele in this example in the absence of the ligation product corresponding to the second allele (A allele in this example); (B) heterozygous with ligation product of both alleles formed; (C) homozygous for the second allele with the ligation product containing the A allele formed in this example in the absence of the G allele ligation product; (D) PCR or ligation failure leading to no ligation product being formed. (Blue) FAM; (green) TAMRA; (red) ROX.
RESULTS
To determine whether the DOL assay works well with a variety of polymorphisms/mutations, PCR primers and ligation probes were designed for 10 biallelic markers, including the cystic fibrosis (CF) ΔF508 deletion in the CFTR gene (Kerem et al. 1989), the familial breast cancer 185delAG and 5382insC mutations in the BRCA1 gene (Couch et al. 1996), the hemochromatosis H63D mutation in the HFE gene (Feder et al. 1996), the codon 39 C/T mutation in the β-globin gene responsible for βo-thalassemia in Sardinia (Trecartin et al. 1981), the C282T and T341C mutations in the N-acetyltransferase (NAT2) gene (Vatsis et al. 1991), three biallelic, single-nucleotide substitution markers associated with D1S8 (Monckton et al. 1993), s14102 found on chromosome 14 (X. Chen et al., unpubl.), and exon 1 of the peripherin/retinal degradation slow (RDS) gene (Farrar et al. 1991). The s14102 marker has an extremely low GC content (26%) in the vicinity of the polymorphic site. Each marker was used to test a number of DNA samples in a blinded study, and the results were compared with those obtained by other genotyping methods, including DNA sequencing.
Figure 2 shows the fluorescent species found at the end of a typical DOL assay when the mixture is separated on a sequencing gel. The marker tested is the thalassemia mutation in which the wild-type allele is C and the mutant allele is T. The lower blue band is the FAM-labeled ligation probe, the lower red band is the ROX-labeled probe specific for the mutant T allele, and the lower yellow band is the TAMRA-labeled probe specific for the normal C allele. This is clearly displayed as electropherograms (blue peak for FAM, red peak for ROX, and black peak for TAMRA). A matrix for these dyes was carefully constructed such that no bleedthrough of FAM was seen in any of the singly labeled probes. In the first gel lane on the left, the individual is homozygous for the mutant T allele and has a top blue band that is shown to be a composite peak containing both FAM and ROX fluorescence. The doubly labeled ligation product (30-mer) migrates much slower than the unreacted, singly labeled probes (14- to 16-mer). In the second gel panel, the heterozygous carrier exhibits two closely spaced blue bands on top where the electropherogram shows two peaks representing the doubly labeled ligation products. The two ligation products migrate at different rates because of the one-base difference between the two products and the different electrophoretic properties conferred to the two products by the ROX and TAMRA dyes. The third panel shows the homozygous normal individual with a top blue band that is doubly labeled for FAM and TAMRA. In contrast, the control salmon sperm DNA shows no ligation products in the right panel. The minor blue bands just above the FAM probe represent minor extension products during the second stage of thermal cycling. These bands are clearly absent in the negative control salmon sperm reaction mixture. Although there is a formal possibility that probes specific for a small deletion variant may get extended to give rise to a full-length variant, it is a statistically small population and is not seen in our studies of the cystic fibrosis 3-base deletion mutation (see below).
Figure 2.
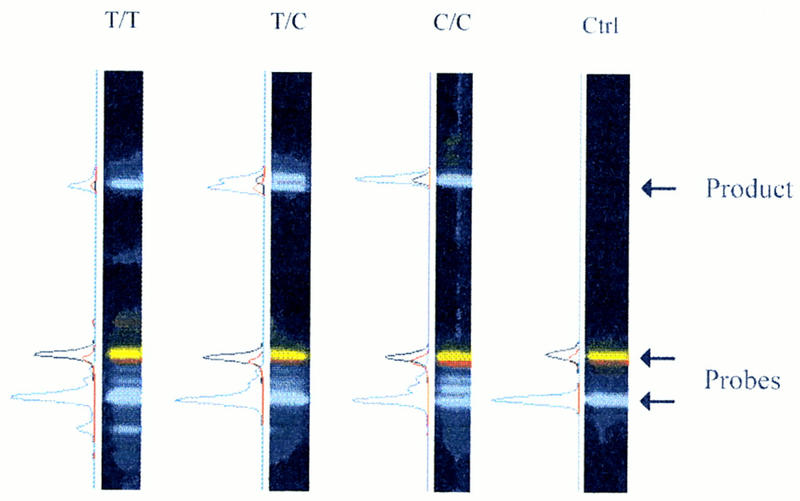
Gel image and electropherograms of PCR–DOL reaction mixtures. Four DNA samples were subjected to the PCR–DOL assay to test their mutational status for the C/T βo-thalassemia mutation. The unreacted ligation probes are found at the bottom of the gel image [(blue band) FAM-labeled common probe; (red band) ROX-labeled mutant T probe; (yellow band) TAMRA-labeled wild-type C probe]. The products are found near the top of the gel image, where the FAM–ROX ligation product migrates slightly faster than the FAM–TAMRA ligation product. The electropherogram of each lane is plotted alongside the gel image where the color scheme is the same as that for the gel image, except that the black peak represents the TAMRA label. (Lane 1) Homozygous mutant sample with a single product that is doubly labeled with FAM and ROX. (Lane 2) Heterozygous carrier with two products that are doubly labeled with FAM–TAMRA and FAM–ROX, respectively. (Lane 3) Homozygous normal control with a single product doubly labeled with FAM and TAMRA. Varying amounts of FAM-probe extension products (blue bands between the unreacted FAM and ROX/TAMRA probes) are seen in lanes 1–3. (Lane 4) Negative control salmon sperm DNA sample in which no ligation or extension products are seen.
The real time fluorescence changes of the four representative thalassemia samples above are shown in Figure 3. The first 35 PCR cycles are monitored at the 65°C annealing/extension temperature and the last 15 ligation cycles at the 45°C annealing/ligation temperature. During the first 10 PCR cycles, a slow ramping rate was used from the denaturing temperature (95°C) to the annealing/extension temperature (65°C) to minimize false priming in the initial amplifications. As fluorescence intensities of fluorescent dyes are affected by temperature, the baseline fluorescence intensities are quite different between the various segments of thermal cycling. Except for minor baseline drifting, fluorescence intensities were not changed significantly during the PCR cycles in any of the four samples. The cause of the baseline drifting is unknown but may be caused by the change in pH during the course of the PCR. As the thermal cycling condition was changed, the FAM and TAMRA fluorescence intensities were shifted upward, whereas the ROX fluorescence intensity was shifted downward when they were monitored at the lower annealing/ligation temperature. During the 15 ligation cycles, the fluorescence intensities changed according to the mutational status of the individual sample being tested. In Figure 3A, the affected homozygote has a drop in FAM intensity (2000 units) with a corresponding rise in ROX intensity (1500 units), whereas the TAMRA intensity drifted downward by 100 units over the 15 ligation cycles. In Figure 3B, the normal homozygote (C/C) exhibits a big drop in FAM fluorescence intensity (2200 units) with a corresponding rise in TAMRA intensity (700 units), whereas the ROX intensity only drifted <100 units. In Figure 3C, the heterozygous carrier has a drop in FAM intensity (2300 units) with rises in both ROX and TAMRA intensities (900 and 300 units, respectively). In contrast, the control salmon sperm DNA sample shows insignificant changes in intensity for all three dyes (Fig. 3D). Accountin for minor variations from sample to sample, the change in ROX and TAMRA intensities in the heterozygote was about half of those in the corresponding homozygotes.
Figure 3.
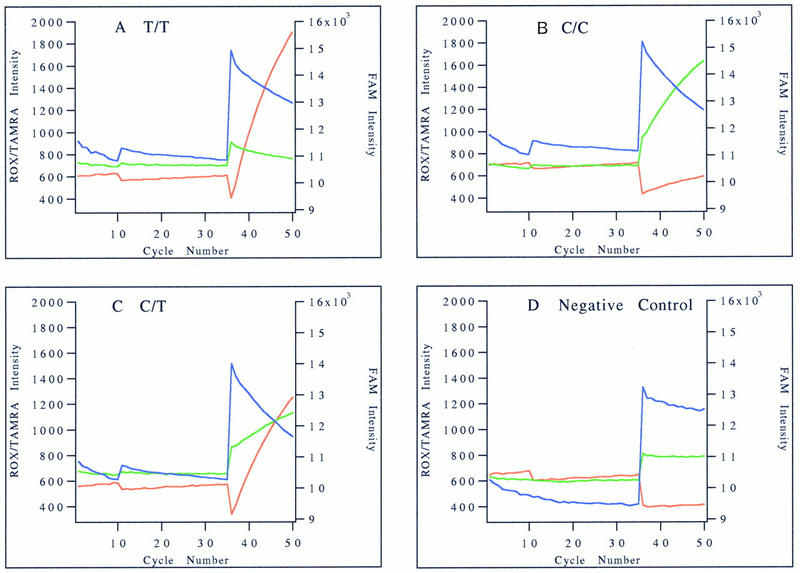
Fluorescence intensity profiles of the PCR–DOL assay. The real-time fluorescence intensities of FAM (blue), ROX (red), and TAMRA (green) during PCR and ligation phases of the reaction are plotted against cycle number. The scale for ROX and TAMRA intensities is on the left, and that for FAM intensity is on the right. The fluorescence intensity profiles of the same samples used for Fig. 2 are shown here. (A) Homozygous mutant sample; (B) homozygous normal control; (C) heterozygous carrier; (D) negative salmon sperm DNA control.
More than 10 samples were tested for each of the 10 marker/mutation (150 total samples) by the DOL assay with mutational status or genotype correctly determined in 147 samples. The remaining three samples gave negative results because of PCR failure (2%).
In an effort to make this assay as flexible and as generally applicable as possible, we investigated the possibility of performing multiple reactions in one run under the same conditions. PCR primers and ligation probes for five different markers were designed to function well under the same thermal cycling conditions and with the same reaction buffer. These markers include the BRCA1 5382insC and CF ΔF508 mutations, and the D1S8, RDS, and s14102 SNP markers. Ten genomic DNA samples plus two salmon sperm DNA samples (as negative controls) were tested against each marker in one run. In Figure 4, the normalized initial slope of fluorescence intensity change for ROX is plotted against that for TAMRA. Normalization is not necessary if each marker is evaluated separately, but it is used here to display all data points together in one plot. The data points fall into four distinct groups. The group in the upper left corner represents samples with a high rate of FRET to ROX but little or no FRET to TAMRA. These samples are homozygous for the allele corresponding to the ROX-labeled allele-specific probe. The group in the lower right corner represents samples with a high rate of FRET to TAMRA but insignificant FRET to ROX. These samples are homozygous for the allele corresponding to the TAMRA-labeled allele-specific probe. The group in the center of the plot has a moderate rate of FRET to both ROX and TAMRA. These are heterozygous samples. The group near the origin represents those samples with minimal FRET to both ROX and TAMRA, and they are either negative controls or PCR failures. In this experiment, 1 of the 60 samples (a sample being tested for the cystic fibrosis mutation) failed to amplify and was found in the origin. All other samples gave results that were in complete agreement with those generated by other means.
Figure 4.
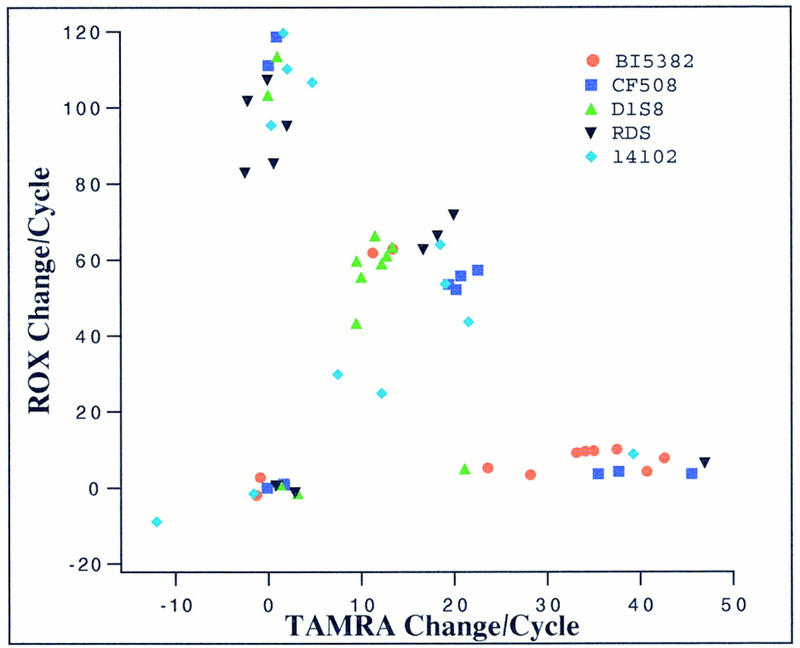
Scatter plot of initial slopes of change in fluorescence intensities. The linearly normalized initial slopes of ROX and TAMRA fluorescence intensity changes of 60 samples (10 human genomic plus 2 salmon sperm DNA samples for each of the 5 markers/mutations) are plotted together. A normalization constant is used for each marker such that the data points can be plotted together on the same scale.
DISCUSSION
The results of our studies demonstrate the three major advantages of the DOL assay. First, the DOL assay is a closed tube assay requiring no manipulations after adding genomic DNA to the reagent mixture initially. There are no separation, purification, or centrifugation steps. Currently, the entire assay takes <3 hr from the time one adds the genomic DNA to the reaction mixture to the time one sees the results. In contrast, the original coupled PCR–OLA assay requires an additional step of gel electrophoresis on a denaturing sequencing gel after the reaction is completed, doubling the time scale and the personnel cost of the reaction (Eggerding 1995). Second, the DOL assay has built-in internal controls. Because the fluorescence intensities are monitored in real time, the initial fluorescence intensities serve as the controls for fluorescence changes. Furthermore, the fact that both alleles are being assayed in the same tube and the semiquantitative nature of the fluorescence intensity changes makes it simple to identify PCR failures. Third, it is possible to design PCR primers and probes for multiple different assays that will perform well under one set of standardized reaction conditions. In our experience, a primer selection program that takes into account the nearest neighbor effects can predict annealing temperatures of the PCR primers and ligation probes so consistently that there is little or no optimization necessary when one uses a uniform set of criteria to select the primers and probes for different assays. This provides tremendous flexibility for tailoring the markers used to best suit the study being undertaken. For example, one can test one genomic sample in a 96-well format against 96 different SNP markers in identity testing; a patient sample against a large number of known mutations in the CFTR, BRCA1, or P53 genes; or a clinical sample against a large number of markers specific for various infectious agents.
In this study the allelic bases are placed at the 5′ end in this assay (even though placing the allelic base at the 3′ end is more discriminatory) for the practical reason that phosphoramidites of the acceptor dyes are not available because they are difficult to synthesize. Placement of the donor and acceptor dyes internally rather than at the 5′ and 3′ ends also works, but it increases the cost of the ligation probes without increasing the FRET substantially (X. Chen, unpubl.). The need for specialized equipment to monitor fluorescence intensity changes is a drawback, but with the proper external controls, an inexpensive fluorescence plate reader can be used for end-point fluorescence determination. A second drawback of this assay is the dye-labeled ligation probes required. Given the personnel and plasticware savings of this simple assay, and the fact that each probe synthesis yields enough reagents to perform >10,000 assays, the break-even point is reached (as compared with other genotyping assays currently in use) when a moderate number of assays are performed.
In summary, the DOL assay is a simple, flexible, and robust assay that is capable of detecting all known single nucleotide DNA variations in any living organism. Because the assay requires only one simple pipetting step to set up, it can be easily automated. Furthermore, this homogeneous assay is not restricted to a particular format, making it possible to consider different high-throughput engineering strategies to increase the number of samples or tests one can perform in each experiment. These attributes makes the DOL assay highly suitable for clinical diagnosis, genetic research, and agricultural biotechnology applications.
METHODS
Enzymes
AmpliTaq, FS DNA polymerase, and Ampligase DNA ligase were purchased from Perkin Elmer Applied Biosystems Division (PE-ABD, Foster City, CA) and Epicentre Technologies, Inc. (Madison, WI).
PCR Primers and Ligation Probes
PCR primers were custom synthesized by Life Technologies (Gaithersburg, MD). Dye-labeled ligation probes were custom synthesized at PE-ABD. PCR primers and ligation probes were designed by use of the PrimerExpress program (PE-ABD). The Tms for PCR primers and ligation probes are fixed at 65°C and 45°C, respectively. A 20°C difference in Tms is essential for the success of performing the PCR and ligation reaction in the same experiment. The common ligation probe is labeled with FAM at its 5′ end and terminates 1 base upstream from the polymorphism/mutation site. The allele-specific ligation probe has the allele-specific base at its 5′ end. It is 5′-phosphorylated and 3′-labeled with either ROX or TAMRA. The primers and probes prepared for this study are listed in Table 1.
Table 1.
PCR Primer and Ligation Probe Sequences
| Namea | Sequenceb (5‘ → 3‘) |
|---|---|
| CF508-p1 | GTGCATAGCAGAGTACCTGAAACAGGAAGTA |
| CF508-p2 | TGATCCATTCACAGTAGCTTACCCATAGAGG |
| CF508-A | FAM-CATTAAAGAAAATATCAT |
| CF508-B | p-TGGTGTTTCCTATGA-ROX |
| CF508-C | p-CTTTGGTGTTTCCTA-TAMRA |
| BRCAI185-p1 | AATGGATTTATCTGCTCTTCGCGTTGAAGA |
| BRCAI185-p2 | TCATTTGCATAGGAGATAATCATAGGAATCCCAA |
| BRCAI185-A | FAM-ATGCAGAAAATCTTAG |
| BRCAI185-B | p-TGTCCCATCTGTCT-ROX |
| BRCAI185-C | p-AGTGTCCCATCTGTC-TAMRA |
| BRCAI5382-p1 | GGGTTGTGTTTGGTTTCTTTCAGCATGA |
| BRCAI5382-p2 | AGTCTTACAAAATGAAGCGGCCCATCTCT |
| BRCAI5382-A | FAM-AGCAAGAGAATCCC |
| BRCAI5382-B | p-CAGGACAGAAAGATCT-ROX |
| BRCAI5382-C | p-AGGACAGAAAGATCTTC-TAMRA |
| HFE63-p1 | GCTCTGTCTCCAGGTTCACACTCTC |
| HFE63-p2 | GATCCCACCCTTTCAGACTCTGACTC |
| HFE63-A | FAM-GTTCGTGTTCTATGAT |
| HFE63-B | p-CATGAGAGTCGCC-ROX |
| HFE63-C | p-GATGAGAGTCGCC-TAMRA |
| THAL-p1 | CATGTGGAGACAGAGAAGACTCTTGGG |
| THAL-p2 | GCAGCTCACTCAGTGTGGCAAAGG |
| THAL-A | FAM-TCTACCCTTGGACC |
| THAL-B | p-CAGAGGTTCTTTGAGT-ROX |
| THAL-C | p-TAGAGGTTCTTTGAGTC-TAMRA |
| NAT-p1 | GGGTGGTGTCTCCAGGTCAATCAAC |
| NAT-p2 | CTGCCACATCTGGGAGGAGCTTC |
| NAT282-A | FAM-TTAGGAGGGTATTTTTA |
| NAT282-B | p-CATCCCTCCAGTTAA-TAMRA |
| NAT282-C | p-TATCCCTCCAGTTAAC-ROX |
| NAT341-A | FAM-ATTCCTGCCGTCA |
| NAT341-B | p-ATGGTCACCTGCAG-TAMRA |
| NAT341-C | p-GTGGTCACCTGCAG-ROX |
| D1S8-p1 | CCACCCTTCCCACCAAACTACTCAC |
| D1S8-p2 | CTTCTACCAATACCACCCTGTCACGTC |
| D1S8-A | FAM-TCCAACCCTAGCC |
| D1S8-B | p-GATACGGGAACGAC-ROX |
| D1S8-C | p-AATACGGGAACGAC-TAMRA |
| s14102-p1 | TAGCTGTCCATGCAGCGTGATTCACCA |
| s14102-p2 | CTCTCCATCCTCTCTCCTCTCACACATTAGTTTACAC |
| s14102-A | FAM-TGGCTTAGTGGTTTC |
| s14102-B | p-ATTGTTTTATTTTTGTAAA-ROX |
| s14102-C | p-GTTGTTTTATTTTTGTAAA-TAMRA |
| RDS-p1 | TGCTATCCTGTGTCTTCAACTCGCT |
| RDS-p2 | GGTAGTACTTCATGCCGTTCTTGAG |
| RDS-A | FAM-CCTGGCTATCTGTGT |
| RDS-B | p-CCTCTTCAACATCAT-ROX |
| RDS-C | p-TCTCTTCAACATCAT-TAMRA |
p1/p2 are the forward and reverse PCR primers.
FAM, ROX, and TAMRA are fluorescent donor and acceptor dyes; (p) 5‘-phosphorylation.
DOL Assay
Genomic DNA (30 ng) was incubated with 0.5 unit of AmpliTaq–FS DNA polymerase and 1.5 unit of Ampligase DNA ligase in a MicroAmp optical tube (PE-ABD) containing 10 mm Tris at pH 8.3, 6.5 mm MgCl2, 50 mm KCl, 1 mm NAD, 250 μm dNTPs, 2.5 μm of each PCR primer, 0.2 μm FAM-labeled, 0.2 μm ROX-labeled, and 0.25 μm TAMRA-labeled ligation probes in a 20-μl reaction. Thermal cycling was performed in an ABI 7700 Sequence Detector (PE-ABD) by use of the following cycling conditions: After initial denaturing at 95°C for 2 min, PCR was performed in two segments—10 cycles at 95°C for 15 sec, ramping slowly to 65°C over 90 sec, 65°C for 30 sec, followed by 30 cycles at 95°C for 15 sec, 65°C for 30 sec; followed by the ligation stage of 25 cycles at 95°C for 15 sec, 45°C for 90 sec. Fluorescence intensities were monitored during the reaction at the annealing temperatures and the recorded data were analyzed by the PE-ABD SDS software.
GeneScan Analysis
To an aliquot of the ligation product mixture (1 μl) was added 5 μl of gel loading buffer [5:1 formamide to 50 mm EDTA (pH 8.0) containing 50 mg/ml Blue dextran]. This mixture (2 μl) was loaded onto a sequencing gel (6% polyacrylamide, 8 m urea, 1× TBE) for electrophoresis on an Applied Biosystems 373A automatic DNA sequencer (PE-ABD). The fluorescent species were analyzed with the GeneScan 672 software (PE-ABD).
Data Analysis
The fluorescence intensities data acquired during the annealing/ligation phase of the primer extension cycles were used for analysis. This was necessary because of the significant reduction in fluorescein fluorescence intensity at high temperatures. The analysis was done by use of the multicomponent data from the ABI 7700 Sequence Detector. The ROX and TAMRA fluorescence intensities of each cycle were averaged and the initial rate of change (initial slope) in the average fluorescence intensity for each dye was calculated by linear regression for cycles 38–40. The average intensities of cycles 36 and 37 (first 2 ligation cycles) were not used because, often, there was a dramatic change in fluorescence intensity during the transitional cycles between the two stages. The genotype of a sample was scored by use of the following criteria:
Initial slope of <5 fluorescence units/cycle for both alleles = no reaction (sample contained neither alleles or PCR failure).
Initial slope of <5 units/cycle for one allele and >10 units/cycle for the other allele = homozygous for the allele with significant change.
- Initial slope of >5 units/cycle for both alleles.
- the allele 1/allele 2 ratio is >4 = homozygous for allele 1.
- the allele 1/allele 2 ratio is <0.25 = homozygous for allele 2.
- the allele 1/allele 2 ratio is between 0.33 to 3 = heterozygote.
Acknowledgments
We thank G. Pilia and B. Zehnbauer for DNA samples, S. Downey and B. Mullah for ligation probe synthesis, R. Jones and E. Shulse for careful reading of the manuscript. This work was supported in part by grants from the National Institutes of Health.
The publication costs of this article were defrayed in part by payment of page charges. This article must therefore be hereby marked “advertisement” in accordance with 18 USC section 1734 solely to indicate this fact.
Footnotes
E-MAIL kwok@im.wustl.edu; FAX (314) 362-8159.
REFERENCES
- Chen X, Kwok P-Y. Template-directed dye-terminator incorporation (TDI) assay: A homogeneous DNA diagnostic method based on fluorescence energy transfer. Nucleic Acids Res. 1997;25:347–353. doi: 10.1093/nar/25.2.347. [DOI] [PMC free article] [PubMed] [Google Scholar]
- Chen X, Zehnbauer B, Gnirke A, Kwok P-Y. Fluorescence energy transfer detection as a homogeneous DNA diagnostic method. Proc Natl Acad Sci. 1997;94:10756–10761. doi: 10.1073/pnas.94.20.10756. [DOI] [PMC free article] [PubMed] [Google Scholar]
- Collins FS, Guyer MS, Chakravarti A. Variations on a theme: Cataloging human DNA sequence variation. Science. 1997;278:1580–1581. doi: 10.1126/science.278.5343.1580. [DOI] [PubMed] [Google Scholar]
- Couch FJ, Weber BL. Mutations and polymorphisms in the familial early-onset breast cancer (BRCA1) gene. Hum Mutat. 1996;8:8–18. doi: 10.1002/humu.1380080102. [DOI] [PubMed] [Google Scholar]
- Eggerding FA. A one-step coupled amplification and oligonucleotide ligation procedure for multiplex genetic typing. PCR Methods Applic. 1995;4:337–345. doi: 10.1101/gr.4.6.337. [DOI] [PubMed] [Google Scholar]
- Farrar GJ, Kenna P, Jordan SA, Kumar-Singh R, Humphries P. A sequence polymorphism in the human peripherin/RDS gene. Nucleic Acids Res. 1991;19:6982. doi: 10.1093/nar/19.24.6982-a. [DOI] [PMC free article] [PubMed] [Google Scholar]
- Feder JN, Gnirke A, Thomas W, Tsuchihashi Z, Ruddy DA, Basava A, Dormishian F, Domingo R, Jr, Ellis MC, Fullan A, et al. A novel MHC class I-like gene is mutated in patients with hereditary haemochromatosis. Nature Genet. 1996;13:399–408. doi: 10.1038/ng0896-399. [DOI] [PubMed] [Google Scholar]
- Foster T. Modern quantum chemistry, Istanbul lectures, part III. New York, NY: Academic Press; 1965. pp. 93–137. [Google Scholar]
- Kerem B, Rommens JM, Buchanan JA, Markiewicz D, Cox TK, Chakravarti A, Buchwald M, Tsui LC. Identification of the cystic fibrosis gene: Genetic analysis. Science. 1989;245:1073–1080. doi: 10.1126/science.2570460. [DOI] [PubMed] [Google Scholar]
- Livak KJ, Flood SJ, Marmaro J, Giusti W, Deetz K K. Oligonucleotides with fluorescent dyes at opposite ends provide a quenched probe system useful for detecting PCR product and nucleic acid hybridization. PCR Methods Applic. 1995a;4:357–362. doi: 10.1101/gr.4.6.357. [DOI] [PubMed] [Google Scholar]
- Livak KJ, Marmaro J, Todd JA. Towards fully automated genome-wide polymorphism screening. Nature Genet. 1995b;9:341–342. doi: 10.1038/ng0495-341. [DOI] [PubMed] [Google Scholar]
- Monckton DG, Tamaki K, MacLeod A, Neil DL, Jeffreys AJ. Allele-specific MVR-PCR analysis at minisatellite D1S8. Hum Mol Genet. 1993;2:513–519. doi: 10.1093/hmg/2.5.513. [DOI] [PubMed] [Google Scholar]
- Risch N, Merikangas K. The future of genetic studies of complex human diseases. Science. 1996;273:1516–1517. doi: 10.1126/science.273.5281.1516. [DOI] [PubMed] [Google Scholar]
- Trecartin RF, Liebhaber SA, Chang JC, Lee KY, Kan YW, Furbetta M, Angius A, Cao A. β-Thalassemia in Sardinia is caused by a nonsense mutation. J Clin Invest. 1981;68:1012–1017. doi: 10.1172/JCI110323. [DOI] [PMC free article] [PubMed] [Google Scholar]
- Tyagi S, Bratu DP, Kramer FR. Multicolor molecular beacons for allele discrimination. Nature Biotech. 1998;16:49–53. doi: 10.1038/nbt0198-49. [DOI] [PubMed] [Google Scholar]
- Vatsis KP, Martell KJ, Weber WW. Diverse point mutations in the human gene for polymorphic N-acetyltransferase. Proc Natl Acad Sci. 1991;88:6333–6337. doi: 10.1073/pnas.88.14.6333. [DOI] [PMC free article] [PubMed] [Google Scholar]