

Abstract
Previously, we assigned the genes for two autosomal recessive disorders, Meckel syndrome (MKS; MIM 249000) and Mulibrey Nanism [MUL (muscle–liver–brain–eye Nanism); MIM 253250] that are enriched in the Finnish population, to overlapping genomic regions on chromosome 17q. Now, we report the construction of a bacterial clone contig over the critical region for both disorders. Several novel CA-repeat markers were isolated from these clones, which allowed refined mapping of the MKS and MUL loci using haplotype and linkage disequilibrium analysis. The localization of the MKS locus was narrowed to <1 cM between markers D17S1290 and 132-CA, within an ∼800-kb region. The MUL locus was refined into an ∼1400-kb interval between markers D17S1290 and 52-CA. The whole MKS region falls within the MUL region. In the common critical region, the conserved haplotypes were different in MKS and MUL patients. A trancript map was constructed by assigning expressed sequence tags (ESTs) and genes, derived from the human gene map, to the bacterial clone contig. Altogether, four genes and a total of 20 ESTs were precisely localized. These data provide the molecular tools for the final identification of the MKS and the MUL genes.
[The sequence data described in this paper have been submitted to the GenBank data library under accession nos. G42608–G42611, G42376–G42388, and G42200–G42250. The online supplement for primer sequences and PCR product sizes, as well as the STS-content table, are available at http://www.cshl.org/gr.]
Meckel syndrome (MKS; MIM 249000) and Mulibrey Nanism [MUL (muscle–liver–brain–eye Nanism); MIM 253250] are rare autosomal recessive disorders in which the clinical presentation involves multiple tissues. MKS, which leads to death soon after birth, is characterized by central nervous system (CNS) malformations, in most cases occipital encephalocele, polycystic kidneys, cystic and fibrotic changes of the liver, and polydactyly (Salonen 1984). MKS has been suggested to be caused by a failure of mesodermal induction (Blankenberg et al. 1987), and in MUL, several tissues of mesodermal origin are affected. The typical clinical features for MUL are growth failure of prenatal onset, dysmorphic features, constrictive pericardium, with consequent hepatomegaly, yellowish dots in the ocular fundi, and J-shaped sella turcica (Perheentupa et al. 1973; Lipsanen-Nyman 1986; Lapunzina et al. 1995). The prognosis of MUL patients is determined mostly by the degree of the constrictive pericardium (Perheentupa et al. 1973).
Both MKS and MUL are typical diseases of the “Finnish disease heritage”; that is, a number of hereditary disorders that occur more frequently in Finland than elsewhere (Perheentupa et al. 1970). The birth prevalence of MKS in Finland is estimated to be 1:9000; however, even higher incidences are reported in some other isolated populations (Salonen and Norio 1984; Salonen 1984). Although the Finnish MKS patients represent both a clinically and genetically uniform syndrome, MKS, globally, seems to be heterogenous with a wide spectrum of phenotypes and locus heterogeneity (Paavola et al. 1997; Roume et al. 1997, 1998). Some 75 MUL patients have been described worldwide, most of them from Finland, where the incidence of MUL is estimated to be 1:40,000 (Lipsanen-Nyman 1986). The reported non-Finnish MUL patients are mostly sporadic cases (Lapunzina et al. 1995).
The genes for both MKS and MUL have been assigned previously to chromosome 17q (Paavola et al. 1995; Avela et al. 1997). The MKS locus covered a 13-cM region between markers D17S1607 and D17S807, and no allelic association was initially observed with the markers available for the study. Obligatory recombinations recently detected in two new Meckel families restricted the locus within ∼5 cM between D17S1606 and D17S807 (P. Paavola, unpubl.). The MUL locus was assigned previously to a 7-cM region within the MKS locus interval between marker loci D17S1799 and D17S948 where initial linkage disequilibrium analysis suggested a localization near marker D17S1853 (Avela et al. 1997). The haplotype analysis further refined the localization between D17S1853 and D17S1604 (K. Avela, unpubl.).
Here, we report the physical and transcript map of the critical region for both MKS and MUL, which provides the material for the final identification of the disease genes. The construction of the physical map allowed us to isolate several novel polymorphic markers and to significantly refine the localization of the MKS and MUL loci by exploiting haplotype and linkage disequilibrium analysis. The high-resolution physical and genetic mapping also enabled the positional exclusion of a serine–arginine-rich splicing factor gene, SFRS1, and a T-box transcription factor gene, TBX2, a putative candidate based on the expression pattern of the homologous mouse gene during development.
RESULTS
Construction of the Physical and Transcript Map
The contig skeleton for our region of interest was derived from the Whitehead/MIT database (Hudson et al. 1995; http://www.genome.wi.mit.edu). A total of 19 previously mapped yeast artificial chromosomes (YACs) (Chumakov et al. 1995) were localized using metaphase fluorescence in situ hybridization (FISH) analyses. The following YACs on the MKS–MUL region were shown to be nonchimeric: 925H8, 791A5, 898E7, 913D6, and 944F6, whereas the YACs 850G1, 783H9, 794A4, 651G8, 812F7, and 905A4 proved to be chimeric. Only nonchimeric clones were used for sequence-tagged site (STS)-content mapping to confirm the order of the clones and STSs.
To construct a more detailed map and to generate additional microsatellite markers for further narrowing of the critical disease gene regions, we screened PAC and BAC libraries (Shizuya et al. 1992; Ioannou et al. 1994) with the available STSs and expressed sequence tags (ESTs). The ends of the isolated PAC and BAC clones were sequenced to develop new STSs (http://www.cshl.org/gr, Suppl. 1) for further screening of clones and for securing the overlaps between the clones. In the critical region for MKS and MUL, between the markers D17S1290 and 52-CA, we were able to construct a bacterial clone contig with at least two times clone coverage consisting of both PAC and BAC clones (see Fig. 1). Three bacterial clones, PAC hRPC.1171i10, BAC hRPK.506h21, and PAC hRPC.1096f1, that have been sequenced at the Whitehead Institute/MIT (http://www.seq.wi.mit.edu), were found by using BLAST comparisons with the STS sequences (Fig. 1). The sequence data from the clone hRPC.1171i10 was used to fill the remaining region of 1× clone coverage in our contig. The contig extended outside our region of interest both on the centromeric and telomeric side where it partially reached only 1× clone coverage.
Figure 1.

The genomic clone contig of the MKS–MUL region. The PACs are indicated by solid bars (214g11 is a P1 clone) and the BACs by gray bars. For the orientation of the clones, either SP6 or T7 end of the clones are marked. Nonchimeric YAC clones mapping to the region are shown as open bars. The polymorphic markers used for the genetic mapping are shown in boldface type on the top, whereas the ESTs and genes are marked with gray text. Three sequenced bacterial clones (by the Whitehead Institute/MIT) are also shown in the map; the sizes of the bacterial clones hRPK.506h21 (BAC), hRPC.1171i10 (PAC), and hRPC.1096f1 (PAC) are 162,083 bp, 175,120 bp, and 124,898 bp, respectively.
Six novel dinucleotide repeat markers were isolated from three PAC (95i19, 52i20, and 58p18) and two BAC (272g3 and 132i10) clones of the region (Fig. 1). The primer sequences and the allele sizes and frequencies are shown in Table 1. We also assigned a CHLC marker, D17S1290, into the genomic clones within this region (925H8, 791A5, and 53n20, 194o12, 17b7, 313g19, and hRPC.1171i10). In addition, the detailed physical map enabled us to precisely localize a total of 20 ESTs of both known and unknown homology, which were previously only roughly assigned either by radiation hybrid mapping or by STS-content mapping to the YAC clones in the region (see Fig. 1; http://www.cshl.org/gr, Suppl. 2). These ESTs were derived from the gene map of the human genome (Schuler et al. 1996). One EST (WI-7318 or SGC30655) showed considerable homology to a mouse gene encoding for clathrin heavy-chain protein, and two other ESTs (WI-18519 and WI-18389) represented the recently cloned human RAD51c gene (Dosanjh et al. 1998). Three other genes, the B-cell leukemia/lymphoma-5 gene, BCL5 (GenBank accession no. M31826), the myeloperoxidase gene, MPO (GenBank accession no. M19507; the corresponding EST is WI-6053), and the serine–arginine-rich splicing factor gene, SFRS1 (GenBank accession no. M69040), were also precisely localized (see Fig. 1; http://www.cshl.org/gr, Suppl. 2).
Table 1.
The Primer Sequencies and the Allele Sizes and Frequencies of the Novel Polymorphic Markers
| Marker | Primers | Alleles | Size (bp) | Frequency (%) | Heterozygosity |
|---|---|---|---|---|---|
| 95-CA | F: GTCAAGTTGATCAACTTCTGA | 1 | 222 | 0.05 | 0.70 |
| R: CTTGTGGCGAGCTGAGATC | 2 | 224 | 0.24 | ||
| 3 | 226 | 0.25 | |||
| 4 | 228 | 0.27 | |||
| 5 | 230 | 0.16 | |||
| 6 | 232 | 0.01 | |||
| 272a-CA | F: TTCCTACGTGCTAAGCACTA | 1 | 198 | 0.01 | 0.87 |
| R: CCACGTCTCTCTGTTTCAAC | 2 | 200 | 0.27 | ||
| 3 | 202 | 0.06 | |||
| 4 | 204 | 0.38 | |||
| 5 | 210 | 0.18 | |||
| 6 | 208 | 0.07 | |||
| 7 | 206 | 0.02 | |||
| 272b-CA | F: TTGGTCATGTAGTTGGTTTG | 1 | 72 | 0.01 | 0.63 |
| R: CAGATATATAGCACACATATC | 2 | 78 | 0.24 | ||
| 3 | 80 | 0.04 | |||
| 4 | 84 | 0.24 | |||
| 5 | 86 | 0.29 | |||
| 6 | 88 | 0.07 | |||
| 7 | 90 | 0.11 | |||
| 8 | 82 | 0.01 | |||
| 132-CA | F: ACAGAGCAAGACCCTGTCT | 1 | 117 | 0.01 | 0.87 |
| R: TGGCTCATTGAATCCAGTGA | 2 | 121 | 0.02 | ||
| 3 | 125 | 0.40 | |||
| 4 | 127 | 0.28 | |||
| 5 | 129 | 0.19 | |||
| 6 | 131 | 0.08 | |||
| 58-CA | F: CCAGTCCTGGTTACTTCCCA | 1 | 276 | 0.12 | 0.83 |
| R: GCAAGAAGGGCTACAGTGGA | 2 | 278 | 0.14 | ||
| 3 | 280 | 0.26 | |||
| 4 | 282 | 0.17 | |||
| 5 | 284 | 0.18 | |||
| 6 | 286 | 0.08 | |||
| 7 | 288 | 0.06 | |||
| 52-CA | F: CCTTCCTCCCTCCAATCTCT | 0 | 181 | 0.01 | 0.62 |
| R: TACTTGGCCCCCAACCTAC | 1 | 185 | 0.04 | ||
| 2 | 187 | 0.07 | |||
| 3 | 189 | 0.50 | |||
| 4 | 191 | 0.10 | |||
| 5 | 193 | 0.08 | |||
| 6 | 195 | 0.20 |
Simultaneously with the STS-content mapping of the isolated PAC and BAC clones, we positioned clones in relation to each other by the fiber-FISH method (Fig. 2; Heiskanen et al. 1994, 1996). Before the fiber-FISH analysis, the localization of the clones on 17q22–q23 was confirmed by metaphase-FISH. By hybridizing two to four PAC or BAC clones simultaneously on free DNA fibers, the clone order and orientation in relation to each other as well as the clone overlaps and gaps between different clones were determined. This enabled the construction of a fine-resolution visual clone contig across the MKS–MUL region.
Figure 2.
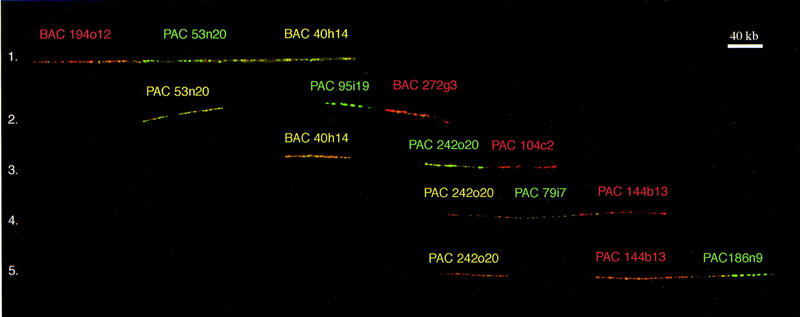
A fiber-FISH image of the physical clone contig covering the MKS region and partly the MUL region. The contig was constructed by hybridizing three clones simultaneously on free DNA fibers. Each line in the figure represents one hybridization image. Biotin-labeled probes were detected with TRITC (red) and digoxigenin-labeled probes with FITC (green). The mixture of biotin and digoxigenin labels of the same probe resulted in a yellow signal. Also, the overlaps of different probes labeled with biotin and digoxigenin resulted in a yellow signal (the color in the name of each probe refers to the used label).
The insert sizes of the PAC and BAC clones constituting the minimum tiling path of the contig were determined by using restriction digestion followed by pulsed-field gel electrophoresis (PFGE; Table 2). Fiber-FISH analyses were used to verify and confirm these size estimations. In fiber-FISH, one or two bacterial clones, whose sizes were determined by PFGE, were used as a standard for calibration in each hybridization image to estimate the sizes of other clones. According to both the PFGE data and fiber-FISH, the size of the contig from D17S1290 to 52-CA, that is also the critical region for MUL, was estimated to be ∼1.4 Mb. Furthermore, the total physical length of the critical region for MKS was determined to be ∼800 kb (between markers D17S1290 and 132-CA; Figs. 1 and 2).
Table 2.
The Estimated PAC/BAC Insert Sizes of the Minimum Tiling Pathway of the Contig
| Clone name | Estimated size (kb) |
|---|---|
| 6i20 | 130 |
| 40h14 | 120 |
| 53n20 | 240 |
| 58p18 | 80 |
| 95i19 | 170 |
| 104c2 | 80 |
| 158i5 | 110 |
| 180k5 | 170 |
| 194o12 | 80 |
| 229h9 | 200 |
| 261p2 | 50 |
| 272g3 | 180 |
| 303g1 | 140 |
| 459c10 | 240 |
| 471l15 | 180 |
| 520n16 | 130 |
| 523e2 | 140 |
High-Resolution Mapping of MKS and MUL by Haplotype and Linkage Disequilibrium Analysis
MKS
Before the establishment of the physical map and isolation of novel polymorphic markers, the critical chromosomal region for MKS was indicated by a core haplotype (cen-3-3-6-tel for markers D17S957, D17S1606, and D17S1604) that was observed in 10 out of 40 MKS chromosomes but in none of the control chromosomes. Later, significant allelic association was detected between MKS and the novel marker loci D17S1290, 95-CA, 272a-CA, 272b-CA, 132-CA, and 58-CA. Using the DISLAMB program (Terwilliger 1995), the strongest associations between MKS and an allele were detected at the marker loci 95-CA and 132-CA (λ-value > 0.80 with P-value < 10−5; see Table 3). At 132-CA the disease associated allele (n:o 5, uncommon allele in the controls) was observed also in four chromosomes (Table 3) that represent other, rare disease haplotypes (see below). Therefore, the λ-value for 132-CA may be misleadingly high (for predicting the distance of the gene from the marker) as compared with the other marker loci.
Table 3.
Linkage Disequilibrium and Haplotype Data in MKS and MUL
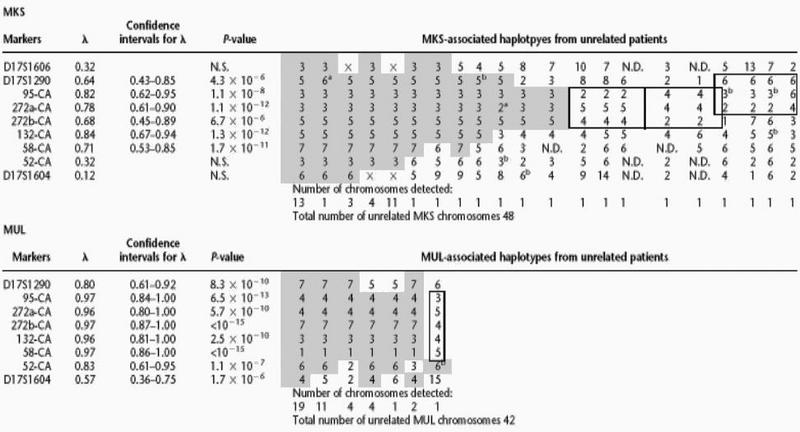 |
The haplotypes consist of nine (MKS) and eight (MUL) microsatellite repeat markers covering the region for the disease loci. The λ values, confidence intervals for λ and P-values are shown for each marker.
▒ The conserved haplotype.
Haplotypes most likely representing other mutations on the minimum genetic region.
(N.D.) Not determined.
(N.S.) Not significant.
Possible allele mutation.
Uninformative meiosis.
(x) Other than the ancient allele.
Three telomeric and two centromeric historical recombinations in MKS chromosomes defined a minimum genetic region for the MKS locus between the markers D17S1290 and 132-CA (Table 3). Five patients were compound heterozygotes for the common MKS haplotype and another haplotype, and in two patients, both chromosomes differed from the common MKS haplotype. In these seven patients, four different rare MKS haplotypes were observed on the minimum genetic region, possibly suggesting “minor” MKS mutations (in Table 3 the haplotypes are defined by a solid line).
MUL
The analysis of the novel markers from the region between D17S1853 and D17S1604 revealed significant allelic association between MUL and marker loci D17S1290, 95-CA, 272a-CA, 272b-CA, 132-CA, 58-CA, and 52-CA. Using the DISLAMB program (Terwilliger 1995) the strongest associations between MUL and an allele were detected at 95-CA, 272a-CA, 272b-CA, 132-CA, and 58-CA (λ-value > 0.95 with P-value < 10−5; see Table 3).
Analysis of historical recombinations in haplotypes of the MUL chromosomes (Table 3) refined the critical MUL region between markers D17S1290 and 52-CA. Altogether, five centromeric and four telomeric historical recombinations were detected in MUL chromosomes. One patient was a compound heterozygote for the ancestral haplotype and a different haplotype that most likely represents a “minor” MUL mutation in the Finnish population.
Exclusion of TBX2 and SFRS1 as Candidate Genes for MKS and MUL
TBX2, a gene encoding a T-box transcription factor that in mouse is expressed in many stages and tissues during the embryonal development (Chapman et al. 1996), was recently cloned and assigned to 17q23 (Cambell at al. 1995). Thus, it presented a potential candidate gene for both MKS and MUL. Using PCR with primers designed from the 3′ UTR of the TBX2 cDNA, we located TBX2 to YAC clones (731E9 and 935C4) on 17q23 that did not overlap with the MKS–MUL clone contig (Fig. 1). A PAC clone, 210a19, isolated for TBX2 was also assigned by metaphase FISH on chromosome 17q23. The hybridization of 210a19 on free DNA fibers showed that TBX2 is located at least 2 Mb telomeric to the marker D17S1604 (data not shown). Thus, TBX2 could be positionally excluded as the causative gene for MKS and MUL. The serine–arginine-rich splicing factor gene, SFRS1 (GenBank accession no. M69040), was localized to the MKS–MUL clone contig, but it resided centromeric to D17S1290 that defined the centromeric border of the critical regions for both MKS and MUL. Thus, SFRS1 was also positionally excluded.
DISCUSSION
We have created a defined physical and EST-based transcript map for the region on chromosome 17q harboring the genes for MKS and MUL, two distinct disorders displaying symptoms from multiple organs, for the eventual cloning of the corresponding genes.
The bacterial clone contig has been confirmed by STS-content mapping using previously only roughly assigned STSs and ESTs as well as several novel PAC/BAC-end sequence-derived STSs (see Fig. 1; http://www.cshl.org/gr, Suppl. 2). The contig assembly was further confirmed visually by the fiber-FISH technique. Furthermore, the length of the contig in the critical MKS–MUL region (from D17S1290 to 52-CA) was estimated to be ∼1.4 kb. This estimate was primarily based on the clone size determinations by PFGE, but it was also concordant with the measurements made by the fiber-FISH analyses. The fiber-FISH method has earlier been shown reliable in estimating physical distances of various disease linked genomic regions (Heiskanen et al. 1995; Klockars et al. 1996; Aaltonen et al. 1997). The entire contig spanning the MKS–MUL critical region has at least 2× clone coverage. The contig has thus enough coverage to enable long-range sequencing as a tool to identify novel genes, provided that the disease locus regions as determined by linkage disequilibrium mapping are small enough to justify such an effort.
The detailed physical map that we constructed allowed us to isolate and precisely map several polymorphic microsatellite markers, which enabled the significant refinement of the MKS and MUL loci. The MKS locus was narrowed from 13 cM to a <1-cM region between markers D17S1290 and 132-CA, whereas the MUL locus was refined between the markers D17S1290 and 52-CA, to a region that overlaps the MKS critical region (Fig. 1). Taking advantage of the genomic clones isolated from this region and their size estimates, the MKS locus interval was estimated to cover ∼800 kb and the MUL locus interval approximately 1400 kb of DNA. Previously, the MUL locus was reported to map to an ∼500-kb region around marker locus D17S1853 (Avela et al. 1997). This estimate was based on the assumption of 1 cM corresponding to 1 Mb in the region. The construction of the contig has enabled a more accurate estimate of the physical distance across the region. It is evident that in the MKS–MUL region the ratio of physical to genetic distance is well above the average of 1.0, maybe even as high as 2.0. Considering this and the confidence limits of the linkage disequilibrium analysis, the original MUL region estimate falls within the present, more accurate estimate.
In MKS, linkage disequilibrium was detectable only within an ∼1000-kb region (D17S1290–58-CA), whereas in MUL, linkage disequilibrium was detectable across ∼2000 kb from D17S1606 to D17S1604. These data would suggest an earlier introduction of the MKS mutation into the Finnish population. The later appearance of MUL into the Finnish population is also supported by the genealogy of the disorders. In MUL, the disease is clustered in the restricted Savo and North Carelia regions of Eastern Finland (Lipsanen-Nyman 1986), representing partly early and partly late-settled areas (de la Chapelle 1993), whereas in MKS, the ancestors are spread all over Finland also on the coastal, early settlement regions (Salonen and Norio 1984). Furthermore, the haplotype data on MKS and MUL patients refers to multiple mutations in MKS versus one major ancestral mutation in MUL. In MUL, one major haplotype was found, and only a single patient was a compound heterozygote for this major haplotype and another very different haplotype. In MKS, one major haplotype was associated with the disease, but also four different haplotypes (on the minimum genetic region) were observed in seven heterozygous patients (Table 3).
The detailed physical map that we have constructed has now created valuable tools for isolating candidate genes for MKS and MUL. We have shown that the TBX2 and SFRS1 genes are located outside the critical regions of MKS and MUL thus excluding these genes as candidates. Even though the MPO gene maps to the MKS critical region, it does not appear as a relevant candidate because mutations in MPO have already been shown to cause defective cellular immunity (Kizaki et al. 1994). BCL5 may be considered a relatively good candidate because BCL2-deficient mice have a polycystic kidney disease-like change of renal tubules (Nakayama et al. 1994). However, the nervous system was reported to be normal in mice despite the fact that this organ shows high levels of endogenous expression. The recently cloned RAD51c gene belongs to a group of strand transfer proteins that are thought to be involved in both recombinational repair of DNA damage and meiotic recombination (Dosanjh et al. 1998). No specific phenotypes are described to be caused by the mutations in the RAD51c gene or the other members of this gene family; thus, the probability of this positional candidate being the MKS or the MUL gene is difficult to evaluate. Additionally, the contig of genomic clones that we have constructed has enabled the localization of several ESTs and EST contigs of unknown homology on the critical MKS–MUL region. We are currently testing these positional candidates for mutations in the MKS and MUL patients to identify the genes causing these two disorders.
METHODS
Isolation of Genomic Clones
As a first step, we identified YAC clones for the MKS–MUL region. Clones positive for the previously mapped STSs and ESTs (Hudson et al. 1995; Dib et al. 1996; http://www.genome.wi.mit.edu) between markers D17S957 and D17S1604 were provided by the Centre d’Etude du Polymorphisme Humain (CEPH) in Paris. Individual clones were cultured, and total yeast DNA was extracted and stored in agarose beads or extracted by the alkaline lysis method. The chimerism of YAC clones was analyzed by the metaphase FISH technique (Bray-Ward et al. 1996), and clones mapping only to 17q22–q23 were used for further mapping. The presence of STSs and ESTs (Hudson et al. 1995; Schuler et al. 1996) in the YACs was tested by PCR amplification.
The STSs and ESTs present in the YACs were used for screening of PAC and BAC libraries by PCR amplification (http://www.cshl.org/gr, Suppls. 1 and 2). Primer sequences for the genes used for bacterial clone screenings are as follows: BCL5 (GenBank accession no. M31826), I: 5′-gagcaagtctgcgccatg-3′, II: 5′-tgggtgactgcactgtctg-3′, fragment size 180 bp; SFRS1 (GenBank accession no. M69040), I: 5′-gtggttatcttacctggggaagttc-3′, II: 5′-gcacttggagtcataccattgcc-3′, fragment size 196 bp; TBX2 (GenBank accession no. M19507) I: 5′-ctgcccagctgctcccctgc-3′, II: 5′-ccggctgcagcccacttttc-3′, fragment size 120 bp. The PAC library consisting of 321 multiwell microtiter plates was kindly provided by Professor Pieter J. De Jong (Roswell Park Institute, Buffalo, NY). The commercially available P1 library (Genome Systems, Inc., St. Louis, MO) and BAC library DNA pools (release III, Research Genetics, Inc., Huntsville, AL) were used for the P1 (SFRS1) and BAC screenings. PCR-positive clones were picked and cultured in 100 ml of Terrific Broth media or 400 ml of Luria–Bertani media, supplemented with 25 mg/ml of kanamycin (PACs) (Ioannou et al. 1994) or 12.5 mg/ml of chloramphenicol (BACs) (Shizuya et al. 1992). DNA was extracted using a Plasmid Maxiprep (tip 500) kit (Qiagen).
Generation of New STSs
The end fragments of the PAC and BAC clones were sequenced directly from the clone DNA with SP6 and T7 vector primers at the DNA Sequencing Laboratory of the Institute of Biotechnology, University of Helsinki. New STSs were designed from the nonrepetitive end sequences using Primer3 software (Whitehead Institute). PCRs were done in a 50-μl reaction mix with 50 pmoles of each primer using the annealing temperatures 3–5°C degrees less than Tm. Primer sequences and PCR product sizes for the novel STSs are presented in Supplement 1 at http://www.cshl.org/gr.
Isolation of Novel CA-Repeats
Novel CA-repeats were isolated from the PAC and BAC clones as described earlier (Klockars et al. 1996; Ranta et al. 1997). Shortly, PAC DNA was digested with Sau3A1 and ligated to pGEM7, transformed into DH5α cells and plated onto selective agar plates. BAC DNA was digested with RsaI and ligated to SmaI-cut pUC18 vector (Pharmacia, Biotech), transformed into Epicurian Coli SURE competent cells (Stratagene), and plated onto selective agar plates. The colonies were transferred onto nylon filters (Hybond-N, Amersham or Magna Chart, MSI) and hybridized with a radioactively labeled (GT)16 oligonucleotide at 65°C overnight. After autoradiography, positive colonies were selected, and DNA was isolated using a Plasmid Miniprep (tip 20) kit (Qiagen) or Wizard Plus Miniprep kit (Promega). The inserts were sequenced with SP6 and T7 vector primers. Oligonucleotide primers flanking the CA-repeats were selected with Primer3 software (Whitehead Institute).
FISH
Targets for FISH
The metaphase chromosome targets were achieved by culturing human peripheral blood lymphocytes according to standard protocols (Lemieux et al. 1992; Tenhunen et al. 1995). Agarose-embedded lymphocytes were used as a source of free DNA fibers according to the method described earlier (Heiskanen et al. 1994, 1996).
Probes for FISH
All clones used for the FISH experiments (PACs and BACs) were labeled with biotin 11-dUTP (Sigma) and digoxigenin 11-dUTP (Boehringer Mannheim) by nick translation according to standard protocols.
FISH Procedure
The FISH procedure was performed as described earlier (Pinkel et al. 1986; Lichter et al. 1988; Aaltonen et al. 1997). Briefly, the hybridization mixture contained 50% formamide and 10% dextran sulfate in 2× SSC. Repetitive sequences were suppressed with 10-fold excess of Cot-1 DNA (BRL, Gaithersburg, MD). After overnight incubation at 37°C the slides were washed at 44°C three times in 50% formamide and 2× SSC, twice in 2× SSC, and once in 0.5× SSC. The slides were counterstained with DAPI (Sigma).
Digital Imaging
A multicolor image analysis was used for acquisition, display and quantitative analysis of fiber-FISH as described elsewhere (Heiskanen et al. 1996; Aaltonen et al. 1997). In fiber-FISH, the clone sizes determined by PFGE were used as a standard for calibration in each individual fiber-FISH image. The distance measurements were done by applying the distance measurement option of the IPLab software (Signal Analytics Corp., Vienna, VA). In each fiber-FISH image, at least one clone was used as a calibration standard to measure the sizes of other clones, gaps separating different clones, and overlaps between these clones. The known clone sizes enabled compatible and therefore reliable measurements to be made. If two known clone sizes were in the same hybridization, the results of the distance measurements were verified with each other (data not shown).
Estimation of Clone Insert Sizes by PFGE
NotI-digested BAC/PAC DNA was separated in 1% agarose using a workshop made pulsed-field gel electrophoresis apparatus designed according to the principles described by Chu et al. (1986). The electrophoretic condition was 120 V, 60-sec pulse time for 48 hr at 16°C. The fragments were visualized by staining the gel with ethidium bromide, and their sizes were estimated by comparing them with the Lambda Ladder (New England BioLabs) size marker.
Family Material
Previously, 17 Finnish Meckel families including 25 patients have been described (Paavola et al. 1995). Eight new families with 11 patients were included in this study. The diagnostic criteria for inclusion were as described (Salonen 1984). In MUL, 19 patients from 13 previously described families (Avela et al. 1997) and 8 new families with one affected individual in each were studied. The diagnostic criteria of MUL were as described previously (Lipsanen-Nyman 1986; Lapunzina et al. 1995). DNA was extracted from venous blood or in the case of a deceased patient, from paraffin-embedded autopsy samples using standard procedures (Isola et al. 1994). All the blood samples were drawn in accordance with the Helsinki declaration.
Genotyping
Markers D17S957, D17S1853, D17S1606, and D17S1604 originated from the Généthon marker collection (Dib et al. 1996). Marker D17S1290 originated from the CHLC marker collection (http://www.chlc.org). Marker 95-CA was detected in the T7 end sequence of PAC 95i19. Markers 272a-CA, 272b-CA, 132-CA, 58-CA, and 52-CA were discovered by a CA-repeat screening protocol described above. The PCR amplification of the polymorphic microsatellite markers using radiolabeled primers and the size analysis of the PCR products were performed as described earlier (Aaltonen et al. 1993; Sulisalo et al. 1993).
Linkage Disequilibrium Analysis
The significance of linkage disequilibrium between the disease and marker loci was analyzed using the DISLAMB program (Terwilliger 1995). This program applies a likelihood-based test for linkage disequilibrium and has only one degree of freedom, irrespective of the number of alleles at any given marker. The calculations are based on the parameter λ, which expresses the proportion of the increase of a certain allele in the disease chromosomes, relative to its population frequency. Confidence intervals for λ were calculated for 1-lod units. The most likely haplotypes were constructed manually, assuming a minimum number of recombinations in each family.
Acknowledgments
For the clinical expertise and collection of the valuable DNA samples from the families, we want to thank Drs. Riitta Salonen (MKS), Aki Mustonen (MKS), Pertti Aula (MKS), Marita Lipsanen-Nyman (MUL), and Jaakko Perheentupa (MUL). Also, the help of Sinikka Lindh has been valuable in collecting the MUL blood samples. We thank Dr. Pieter de Jong for kindly providing the human genomic PAC library and Johanna Aaltonen for setting up the PAC library as well as sharing her wide knowledge on physical mapping. Maaret Ridanpää is appreciated for advice on the BAC library screenings. We also thank Elina Hellsten and Susanna Ranta for their valuable advice in the CA-repeat isolation. Ritva Timonen, Paula Hakala, and Mervi Eeva are appreciated for excellent technical assistance. This work was financially supported by the Academy of Finland, the Farmos Research Foundation, the Finnish Medical Society Foundation, the Ulla Hjelt Foundation, the Rinnekoti Research Foundation, the Maud Kuistila’s Foundation, and the Research Institute of Helsinki University Central Hospital.
The publication costs of this article were defrayed in part by payment of page charges. This article must therefore be hereby marked “advertisement” in accordance with 18 USC section 1734 solely to indicate this fact.
Footnotes
E-MAIL Anna-Elina.Lehesjoki@helsinki.fi; FAX 358-9-6158 5632.
E-MAIL LPeltonen@mednet.ucla.edu; FAX 358-9-4744 8480.
REFERENCES
- Aaltonen J, Komulainen J, Vikman A, Palotie A, Wadelius C, Perheentupa J, Peltonen L. Autoimmune polyglandular disease type I: Exclusion map using amplifiable multiallelic markers in a microtiter well format. Eur J Hum Genet. 1993;1:164–171. [PubMed] [Google Scholar]
- Aaltonen J, Horelli-Kuitunen N, Fan J-B, Björses P, Perheentupa J, Mayers R, Palotie A, Peltonen L. High-resolution physical and transcriptional mapping of the autoimmune polyendocrinopathy–candidiasis–ectodermal– dystrophy locus on chromosome 21q22.3 by FISH. Genome Res. 1997;7:820–829. doi: 10.1101/gr.7.8.820. [DOI] [PubMed] [Google Scholar]
- Avela K, Lipsanen-Nyman M, Perheentupa J, Wallgren-Pettersson C, Marchand S, Fauré S, Sistonen P, de la Chapelle A, Lehesjoki A-E. Assignment of the Mulibrey Nanism gene to 17q by linkage and linkage disequilibrium analysis. Am J Hum Genet. 1997;60:896–902. [PMC free article] [PubMed] [Google Scholar]
- Blankenberg, T.A., B.H. Ruebner, W.G. Ellis, J. Bernstein, and J.E. Dimmick. 1987. Pathology of renal and hepatic anomalies in Meckel syndrome. Am. J. Med. Genet. (Suppl.) 3: 395–410. [DOI] [PubMed]
- Bray-Ward P, Menninger J, Lieman J, Desai N, Mokady N, Banks A, Ward DC. Integration of the cytogenetic, genetic, and physical maps of the human genome by FISH mapping of CEPH YAC clones. Genomics. 1996;32:1–14. doi: 10.1006/geno.1996.0070. [DOI] [PubMed] [Google Scholar]
- Cambell C, Goodrich K, Casey G, Beatty B. Cloning and mapping of a human gene (TBX2) sharing a highly conserved protein motif with the drosophila omb gene. Genomics. 1995;28:255–260. doi: 10.1006/geno.1995.1139. [DOI] [PubMed] [Google Scholar]
- Chapman DL, Garvey N, Hancock S, Alexiou M, Agulnik S, Gibson Brown JJ, Cebra-Thomas J, Bollag RJ, Silver LM, Papaioannou VE. Expression of the T-box family genes, Tbx1-Tbx5, during early mouse development. Dev Dynam. 1996;206:379–390. doi: 10.1002/(SICI)1097-0177(199608)206:4<379::AID-AJA4>3.0.CO;2-F. [DOI] [PubMed] [Google Scholar]
- Chu G, Vollrath D, Davis RW. Separation of large DNA molecules by contour-clamped homogenous electric fields. Science. 1986;234:1582–1585. doi: 10.1126/science.3538420. [DOI] [PubMed] [Google Scholar]
- Chumakov IM, Rigault P, Le Gall I, Belanné-Chantelot C, Billault A, Guillou S, Soularue P, Guasconi G, Poullier E, Gros I, et al. A YAC contig map of the human genome. Nature. 1995;377:175–297. doi: 10.1038/377175a0. [DOI] [PubMed] [Google Scholar]
- de la Chapelle A. Disease gene mapping in isolated human populations: The example of Finland. J Med Genet. 1993;30:857–865. doi: 10.1136/jmg.30.10.857. [DOI] [PMC free article] [PubMed] [Google Scholar]
- Dib C, Fauré S, Fizames C, Samson D, Drouot N, Vignal A, Millasseau P, Marc S, Hazan J, Seboun E, et al. A comprehensive genetic map of the human genome based on 5,264 microsatellites. Nature. 1996;380:152–154. doi: 10.1038/380152a0. [DOI] [PubMed] [Google Scholar]
- Dosanjh MK, Collins DW, Fan W, Lennon GG. Isolation and characterization of RAD51C, a new human member of the RAD51family of related genes. Nucleic Acids Res. 1998;26:1179–1184. doi: 10.1093/nar/26.5.1179. [DOI] [PMC free article] [PubMed] [Google Scholar]
- Heiskanen M, Karhu R, Hellsten E, Peltonen L, Kallioniemi O, Palotie A. High resolution mapping using fluorescence in situ hybridization (FISH) to extended DNA fibers prepared from agarose-embedded cells. BioTechniques. 1994;17:928–934. [PubMed] [Google Scholar]
- Heiskanen M, Hellsten E, Kallioniemi OP, Makela TP, Alitalo K, Peltonen L, Palotie A. Visual mapping by fiber-FISH. Genomics. 1995;30:31–36. doi: 10.1006/geno.1995.0005. [DOI] [PubMed] [Google Scholar]
- Heiskanen M, Kallioniemi O-P, Palotie A. Fiber-FISH: Experiences and a refined protocol. Genet Anal Biomol Eng. 1996;12:179–184. [PubMed] [Google Scholar]
- Hudson TJ, Stein LD, Gerety SS, Ma J, Castle AB, Silva J, Slonim DK, Baptista R, Kruglyak L, Xu SH, et al. An STS-based map of the human genome. Science. 1995;270:1945–1954. doi: 10.1126/science.270.5244.1945. [DOI] [PubMed] [Google Scholar]
- Ioannou PA, Amemiya CT, Garnes J, Kroisel PM, Shizuya H, Chen C, Batzer MA, de Jong P. A new bacteriophage P1-derived vector for the propagation of large human DNA fragments. Nat Genet. 1994;4:84–89. doi: 10.1038/ng0194-84. [DOI] [PubMed] [Google Scholar]
- Isola J, DeVries S, Chu L, Ghazvini S, Waldman F. Analysis of changes in DNA sequence copy number by comparative genomic hybridization in archival paraffin-embedded tumor samples. Am J Pathol. 1994;145:1301–1308. [PMC free article] [PubMed] [Google Scholar]
- Kizaki M, Miller CW, Selsted ME, Koeffler HP. Myeloperoxidase (MPO) gene mutation in hereditary MPO deficiency. Blood. 1994;83:1935–1940. [PubMed] [Google Scholar]
- Klockars T, Savukoski M, Isosomppi J, Laan M, Järvelä I, Petrukhin K, Palotie A, Peltonen L. Efficient construction of a physical map by fiber-FISH of the CLN5 region: Refined assignment and long-range contig covering the critical region on 13q22. Genomics. 1996;35:71–78. doi: 10.1006/geno.1996.0324. [DOI] [PubMed] [Google Scholar]
- Lapunzina P, Rodriguez JI, de Matteo E, Gracia R, Moreno F. Mulibrey nanism: Three additional patients and a review of 39 patients. Am J Med Genet. 1995;55:349–355. doi: 10.1002/ajmg.1320550320. [DOI] [PubMed] [Google Scholar]
- Lemieux NM, Dutrillaux B, Viegas-Pequiqnot E. A simple method for simultaneous R- or G-banding and fluorescence in situ hybridization of small single-copy genes. Cytogenet Cell Genet. 1992;59:311–312. doi: 10.1159/000133277. [DOI] [PubMed] [Google Scholar]
- Lichter P, Cremer T, Chang Tang CJ, Watkins P, Manuelis L, Ward DC. Rapid detection of human chromosome 21 aberration by in situ hybridization. Proc Natl Acad Sci. 1988;85:9664–9668. doi: 10.1073/pnas.85.24.9664. [DOI] [PMC free article] [PubMed] [Google Scholar]
- Lipsanen-Nyman M. “Mulibrey-nanismi.” Ph.D. thesis. Helsinki, Finland: the University of Helsinki; 1986. [Google Scholar]
- Nakayama K, Nakayama K, Negishi I, Kuida K, Sawa H, Loh DY. Targeted disruption of Bcl-2 alpha beta in mice: Occurrence of gray hair, polycystic kidney disease, and lymphocytopenia. Proc Natl Acad Sci. 1994;91:3700–3704. doi: 10.1073/pnas.91.9.3700. [DOI] [PMC free article] [PubMed] [Google Scholar]
- Paavola P, Salonen R, Weissenbach J, Peltonen L. The locus for Meckel syndrome with multiple congenital anomalies maps to chromosome 17q21-q24. Nat Genet. 1995;11:213–215. doi: 10.1038/ng1095-213. [DOI] [PubMed] [Google Scholar]
- Paavola P, Salonen R, Baumer A, Schinzel A, Boyd PA, Gould S, Meusburger H, Tenconi R, Barnicoat A, Winter R, Peltonen L. Clinical and genetic heterogeneity in Meckel syndrome. Hum Genet. 1997;101:88–92. doi: 10.1007/s004390050592. [DOI] [PubMed] [Google Scholar]
- Perheentupa J, Autio S, Leisti S, Raitta C. Mulibrey nanism: Dwarfism with muscle, liver, brain and eye involvement. Acta Paediatr Scand. 1970;59:74–75. doi: 10.1111/j.1651-2227.1970.tb14591.x. [DOI] [PubMed] [Google Scholar]
- Perheentupa J, Autio S, Leisti S, Raitta C, Tuuteri L. Mulibrey-nanism, an autosomal recessive syndrome with pericardial constriction. Lancet. 1973;2:351–355. doi: 10.1016/s0140-6736(73)93193-0. [DOI] [PubMed] [Google Scholar]
- Pinkel D, Straume T, Gray J. Cytogenetic analysis using quantitative, high sensitivity, fluorescence hybridization. Proc Natl Acad Sci. 1986;83:2934–2938. doi: 10.1073/pnas.83.9.2934. [DOI] [PMC free article] [PubMed] [Google Scholar]
- Ranta S, Lehesjoki A-E, de Fatima Bonaldo M, Knowles JA, Hirvasniemi A, Ross B, de Jong PJ, Bento Soares M, de la Chapelle A, Gilliam TC. High-resolution mapping and transcript identification at the progressive epilepsy with mental retardation locus on chromosome 8p. Genome Res. 1997;7:887–896. doi: 10.1101/gr.7.9.887. [DOI] [PubMed] [Google Scholar]
- Roume J, Ma HW, Le Merrer M, Cormier-Daire V, Girlich D, Genin E, Munnich A. Genetic heterogeneity in Meckel syndrome. J Med Genet. 1997;34:1003–1006. doi: 10.1136/jmg.34.12.1003. [DOI] [PMC free article] [PubMed] [Google Scholar]
- Roume J, Genin E, Cormier-Daire V, Ma HW, Mehaye B, Attie T, Razavi-Encha F, Fallet-Bianco C, Buenerd A, Clerget-Darpoux F, Munnich A, Le Merrer M. A gene for Meckel syndrome maps to chromosome 11q13. Am J Hum Genet. 1998;63:1095–1101. doi: 10.1086/302062. [DOI] [PMC free article] [PubMed] [Google Scholar]
- Salonen R. The Meckel syndrome: Clinicopathological findings in 67 patients. Am J Med Genet. 1984;18:671–689. doi: 10.1002/ajmg.1320180414. [DOI] [PubMed] [Google Scholar]
- Salonen R, Norio R. The Meckel syndrome in Finland: Epidemiologic and genetic aspects. Am J Med Genet. 1984;18:691–698. doi: 10.1002/ajmg.1320180415. [DOI] [PubMed] [Google Scholar]
- Schuler GD, Boguski MS, Stewart EA, Stein LD, Guapay G, Rice K, White RE, Rodriquez-Tome P, Aggarwal A, Bajorek E, et al. A gene map of the human genome. Science. 1996;274:540–546. [PubMed] [Google Scholar]
- Shizuya H, Birren B, Kim U-J, Mancino V, Slepak T, Tachiiri Y, Simon M. Cloning and stable maintenance of 300-kilobase-pair fragments of human DNA in Escherichia coli using an F-factor-based vector. Proc Natl Acad Sci. 1992;89:8794–8797. doi: 10.1073/pnas.89.18.8794. [DOI] [PMC free article] [PubMed] [Google Scholar]
- Sulisalo T, Sistonen P, Hästbacka J, Wadelius C, Mäkitie O, de la Chapelle A, Kaitila I. Cartilage-hair hypoplasia gene assigned to chromosome 9 by linkage analysis. Nat Genet. 1993;3:338–341. doi: 10.1038/ng0493-338. [DOI] [PubMed] [Google Scholar]
- Tenhunen K, Laan M, Manninen T, Palotie A, Peltonen L, Jalanko A. Molecular cloning, chromosomal localization and expression of the mouse aspartylglucosaminidase gene. Genomics. 1995;30:244–250. doi: 10.1006/geno.1995.9881. [DOI] [PubMed] [Google Scholar]
- Terwilliger JD. A powerful likelihood method for the analysis of linkage disequilibrium between trait loci and one or more polymorphic marker loci. Am J Hum Genet. 1995;56:777–787. [PMC free article] [PubMed] [Google Scholar]