

Abstract
We have developed a rapid visual method for identifying novel members of gene families. Starting with an evolutionary tree, 20–50 protein query sequences for a gene family are selected from different branches of the tree. These query sequences are used to search the GenBank and expressed sequence tag (EST) DNA databases and their nightly updates using the tfastx3 or tfasty3 programs. The results of all 20–50 searches are collated and resorted to highlight EST or genomic sequences that share significant similarity with the query sequences. The statistical significance of each DNA/protein alignment is plotted, highlighting the portion of the query sequence that is present in the database sequence and the percent identity in the aligned region. The collated results for database sequences are linked using the WWW to the underlying scores and alignments; these links can also be used to perform additional searches to characterize the novel sequence further. With traditional “deep” scoring matrices (BLOSUM50) one can search for previously unrecognized families of large protein superfamilies. Alternatively, by using query sequences and EST libraries from the same species (e.g., human or mouse) together with “shallow” scoring matrices and filters that remove high-identity sequences, one can highlight new paralogs of previously described subfamilies. Using query sequences from the glutathione transferase superfamily, we identified two novel mammalian glutathione transferase families that were recognized previously only in plants. Using query sequences from known mammalian glutathione transferase subfamilies, we identified new candidate paralogs from the mouse class-mu, class-pi, and class-theta families.
DNA sequences from cDNA libraries of expressed mRNAs—expressed sequence tags (ESTs)—are surveyed routinely for gene expression studies and pharmaceutical target identification. Although the genome centers that produce EST sequences routinely perform BLAST sequence similarity searches to identify the sequence, it is often difficult to determine from these annotations whether an EST sequence encodes a family member that is already well characterized or one that is novel. Similar problems are encountered with sequences from high-throughput genome sequencing. Often, the most interesting novel family members are those that share low, but statistically significant, similarity with several known family members. Such low similarity may lie below the thresholds required for high-volume sequence similarity searching. Alternatively, EST or genomic sequences that are closely related, but not identical, to well-recognized genes can provide the first evidence of novel paralogous genes. Thus, similarity searches with members of any large family will identify hundreds or thousands of homologs in GenBank and often dozens of sequences in the nightly updates. Similarity searching programs are designed to highlight the most similar sequences; this can make it difficult to identify novel members of large families because so many strongly similar family members are in the databases already.
Difficulties in the identification of novel family members are compounded by the rate at which EST sequences are accumulating. More than 100,000 new EST sequences enter the GenBank database every month. For any well-characterized family, >90%–95% of these new sequences will encode known family members; our goal is to identify the 5%–10% of the family members that are unrecognized. The FAST_PAN strategy described here greatly simplifies the process of searching for EST sequences that are distantly related to several distantly related members of a gene family.
We have developed a data display tool that presents the results of repeated tfastx3 or tfasty3 queries as histograms that are viewed with an Acrobat Reader using a Netscape or Internet Explorer browser. (The strategy could be used equally well with TBLASTN, but the program would require modifications to interpret the TBLASTN output.) For each library sequence found, the significant matches to each of 20–50 query sequences are displayed and the region wherein each query sequence matches the library sequence is indicated. Links to the underlying sequence alignments are provided and individual library sequences can be used to query, for example, the nonredundant division of GenBank using fastx or blastx. With this tool, the results of dozens of individual queries of a DNA (or protein) database can be reviewed rapidly for subsequent analysis of potential novel gene family members. In the results below, we describe two applications of the FAST_PAN strategy: (1) identification of unrecognized gene subfamilies (e.g., mammalian ESTs whose closest known homologs are found in plants); and (2) identification of unrecognized gene paralogs (e.g., a gene that is closely related to known mammalian members of a family but sufficiently different to suggest that it is a novel mammalian paralog).
RESULTS
A Strategy for Identifying New Gene Subfamilies
With modern high-throughput searching methods, EST and genomic sequences from large gene families often contain annotations that the sequence belongs to the family. Although these annotations are generally accurate, they rarely indicate the novelty of the sequence. For example, a typical annotation might read
vs69f03.r1 Stratagene mouse skin (#937313) Mus musculus cDNA clone IMAGE:1151549 5′ similar to gb:J04696 Mouse glutathione S-transferase class mu (MOUSE);, mRNA sequence.
Here the annotation correctly identifies the EST as a class-mu glutathione transferase, but we are not told which class-mu isoenzyme is most similar. In other cases, the annotation can be much more cryptic
vn58a10.r1 Barstead mouse proximal colon MPLRB6 Mus musculus cDNA clone IMAGE:1025370 5′ similar to WP:C29E4.7 CE00089;, mRNA sequence.
Here, WP:C29E4.7 is a Caenorhabditis elegans Wormpep (http://www.sanger.ac.uk/Projects/C_elegans/wormpep) protein sequence, with no hint that it belongs to the glutathione transferase superfamily. As a result, investigators perform nightly searches to identify new members of their favorite protein families, waking up in the morning to page after page of BLAST (Altschul et al. 1990) or FASTA (Pearson 1996) output. The FAST_PAN program automates this process and provides tools to highlight ESTs and genomic sequences encoding novel (previously unrecognized) members of protein families.
The FAST_PAN strategy is outlined in Box I and Figure 1. A set of query sequences from a protein family is selected to represent the different branches of the family. Each of these sequences is used to search an EST or genomic DNA database. The results of all of the searches are concatenated and reformatted to show the results of all of the query sequences that shared significant similarity to a particular EST (library) sequence, rather than the conventional output that shows all of the EST (library) sequences that share significant similarity with a query sequence.
Figure 1.
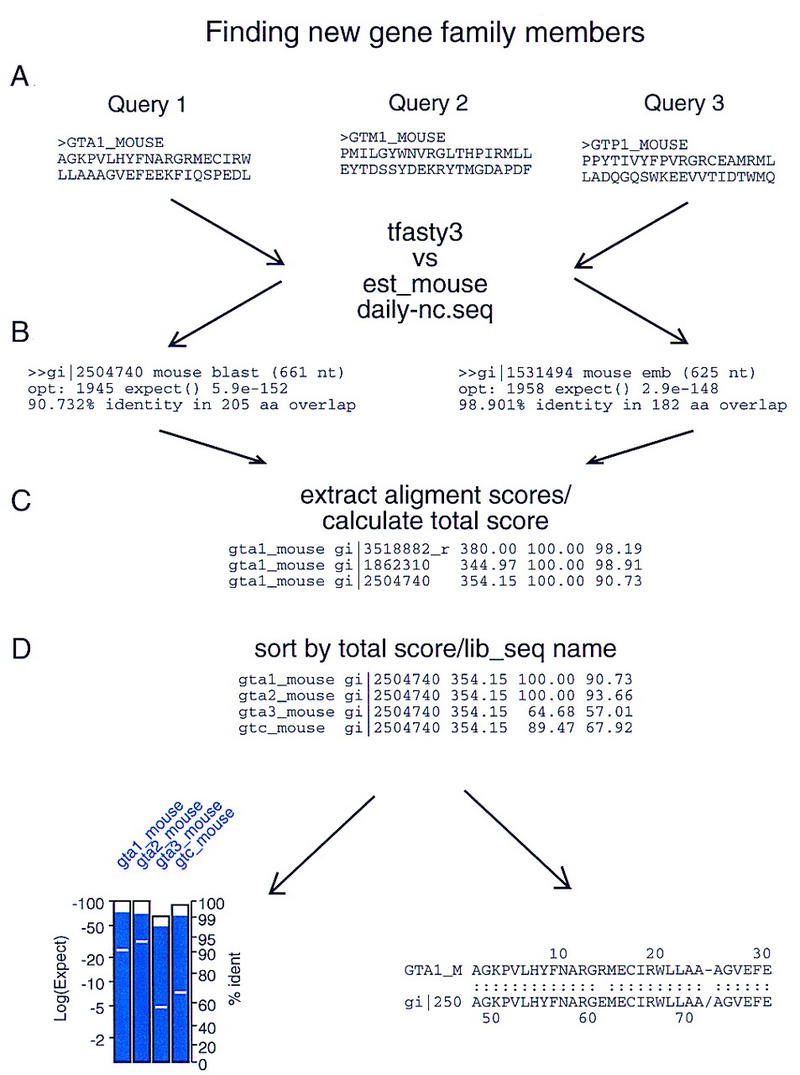
Panning for genes flowchart. The overall FAST_PAN strategy is outlined. The precise steps are described in Box 1.
The identification of several novel mouse glutathione transferase families is shown in Figures 2–6. An evolutionary tree (Fig. 2) was first constructed by identifying >125 glutathione transferase family members by searching with class-pi (GTP_HUMAN), class-theta (GTT1_DROME), class-sigma (GTS2_DROME), plant (GTH1_TOBAC), and bacterial (GT_HAEIN) protein sequences using the fasta3 and ssearch3 search programs (Pearson 1996). Some glutathione transferase homologs with unusual lengths, such as crystallins, elongation factor 1γs, and small heat shock proteins, were excluded from the list. Sequences (116) that shared <90% identity were selected and aligned using the ClustalW program (Thompson et al. 1994). The multiple alignment was transformed to protein evolutionary distances using the PHYLIP protdist program (Felsenstein 1989), and then an evolutionary tree (Fig. 2) was constructed from those distances using the PHYLIP fitch program.
Figure 2.
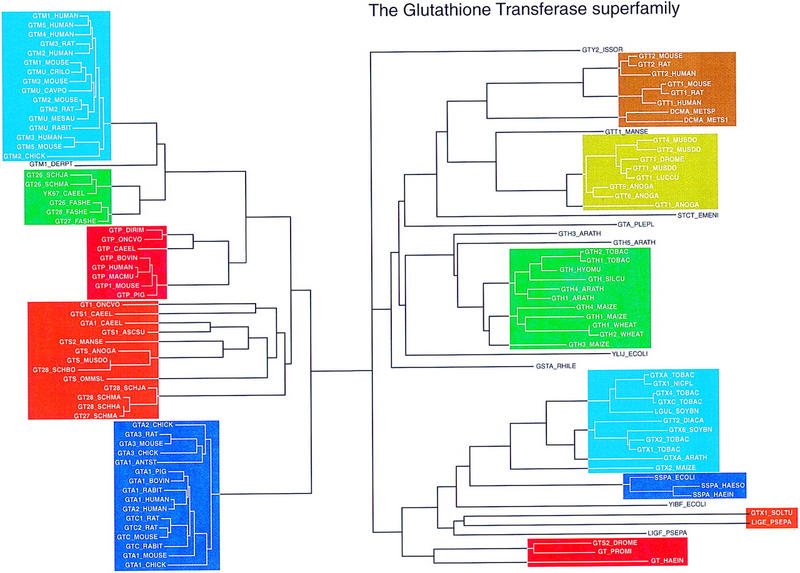
Glutathione transferase evolutionary tree. One-hundred thirty-six glutathione transferase family members were identified by searches of SwissProt (rel. 34 with updates) with the query sequences GTP_HUMAN, GTT1_DROME, GTS2_DROME, GTH1_TOBAC, and GT_HAEIN. The protein sequences were aligned using ClustalW (Thompson et al. 1994), and a distance matrix was calculated with the PHYLIP protdist program (Felsenstein 1989). The tree shown was produced by the fitch program of the PHYLIP package. The regions of the tree used for gene discovery are highlighted in color.
Figure 6.
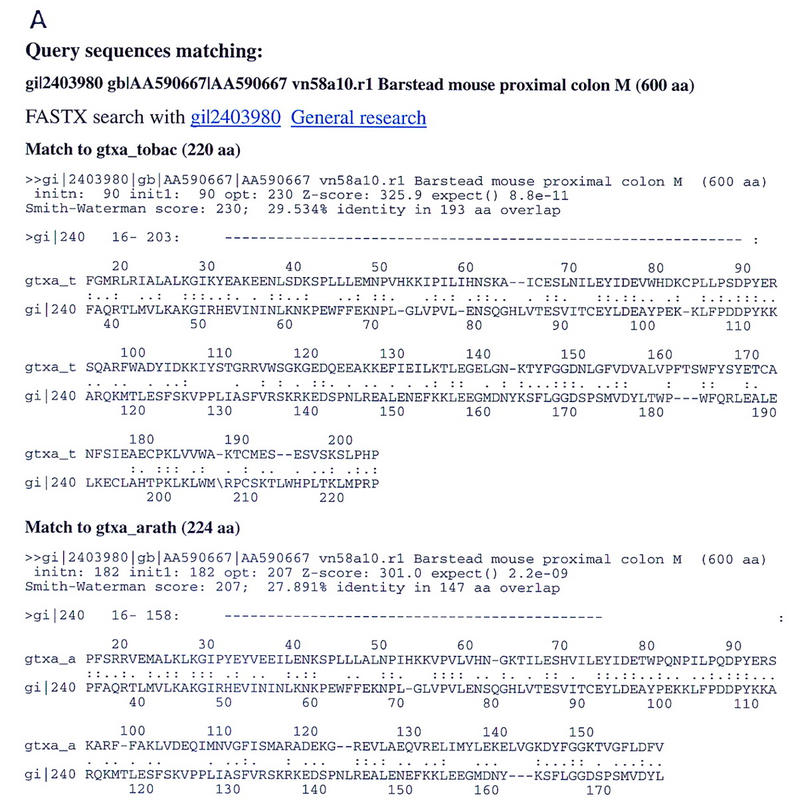
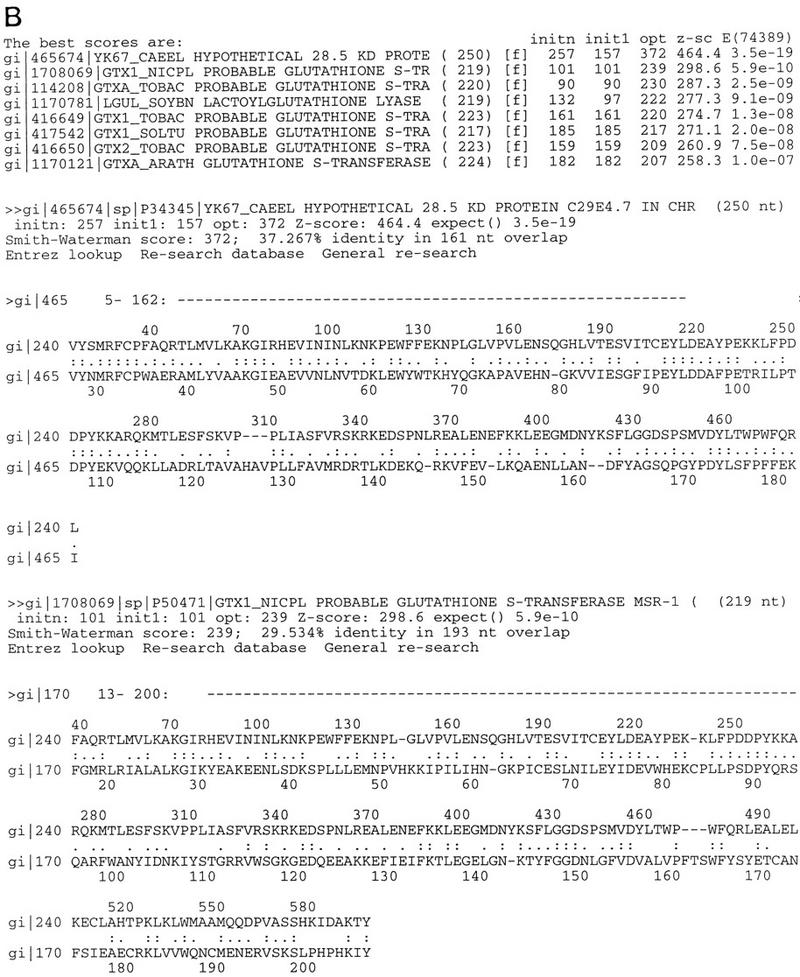
WWW link to confirming alignments. (A) Alignments of the mouse class-mu EST sequence gi|2403980 with the original query protein sequences. Two alignments (gtxa_tobac and gtxa_arath) with the original query sequences used to build the histogram in Fig. 5 are shown; alignments to sspa_ecoli [E() < 10−5] and gtx1_soltu [E() < 10−10] are not shown. Alignments were calculated with tfasty3 using BLOSUM50 and gap penalties of −15/−3/−20/−20 (Pearson et al. 1997). (−) Protein or translated DNA alignment gaps; (\,/) frameshifts. (Dashed Line) A map of the portion of the query amino acid sequence aligned with the EST sequence. (B) A re-search of the gi|2403980 EST against the SwissProt database. Significant similarity is shared with several plant glutathione transferases. Alignments are shown with a C. elegans unidentified glutathione transferase and a hypothetical Nicotiana enzyme.
The colors of the different branches of the evolutionary tree in Figure 2 correspond to the histogram summaries of the similarity search results (Figs. 3, 5, and 8, below). Three of the five color panels on the left side of Figure 2 correspond to the mammalian class-mu (aqua), class-pi (red), and class-alpha (dark blue) families that were recognized by 1985 (Mannervik et al. 1985); the other two color panels comprise class-mu-like sequences from C. elegans and other invertebrates (green) and a variety of invertebrate glutathione transferases that are more similar to the mammalian class-alpha, class-mu, and class-pi enzymes than to the class-theta (orange) and plant sequences (olive, green, and aqua). (The tree in Figure 2 was used only as a guide in selecting a representative set of query sequences. It has not been subjected to the appropriate tests to determine whether it is a robust representation of glutathione transferase phylogeny.) The homology relationships among glutathione transferases on the right side of Figure 2 were largely unrecognized before the discovery of the insect and mammalian class-theta glutathione transferases. When the FAST_PAN method was developed in the Fall of 1997, the only mammalian glutathione transferases in this part of the tree belonged to class theta (brown).
Figure 3.
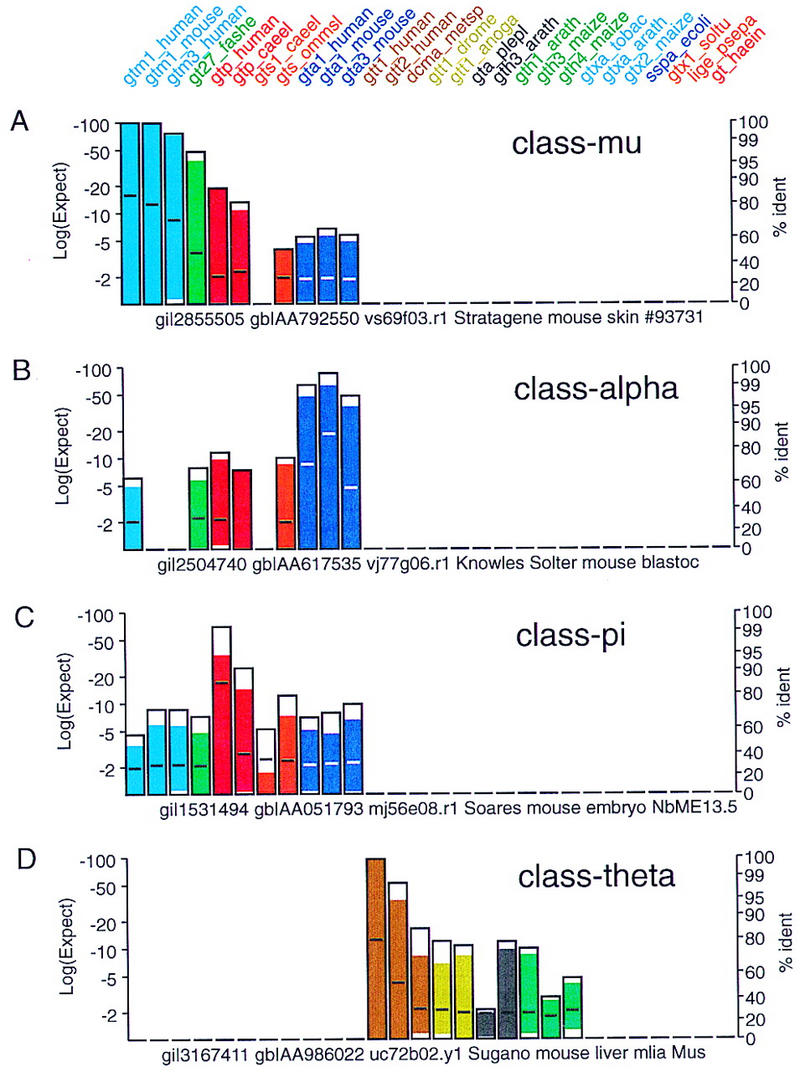
Known glutathione transferase family members. Typical profiles for matches between ESTs encoding members the four well-known mammalian glutathione transferase families: class alpha, class mu, class pi, and class theta. Searches were performed with the glutathione transferase query sequences indicated at the top of the Figure against the est_mouse database obtained from the National Center for Biotechnology Information (http://ncbi.nlm.nih.gov/blast/db/est_mouse) using the tfasty3 program with the default scoring parameters: the BLOSUM50 matrix and −15 for the first residue in a gap, −3 for additional residues, and −20 for frameshifts between or within codons (−15/−3/−20/−20). Matches against class-mu (gi|2855505), class-alpha (gi|2504740), class-pi (gi|1531494), and class-theta (gi|3167411) ESTs are shown.
Figure 5.
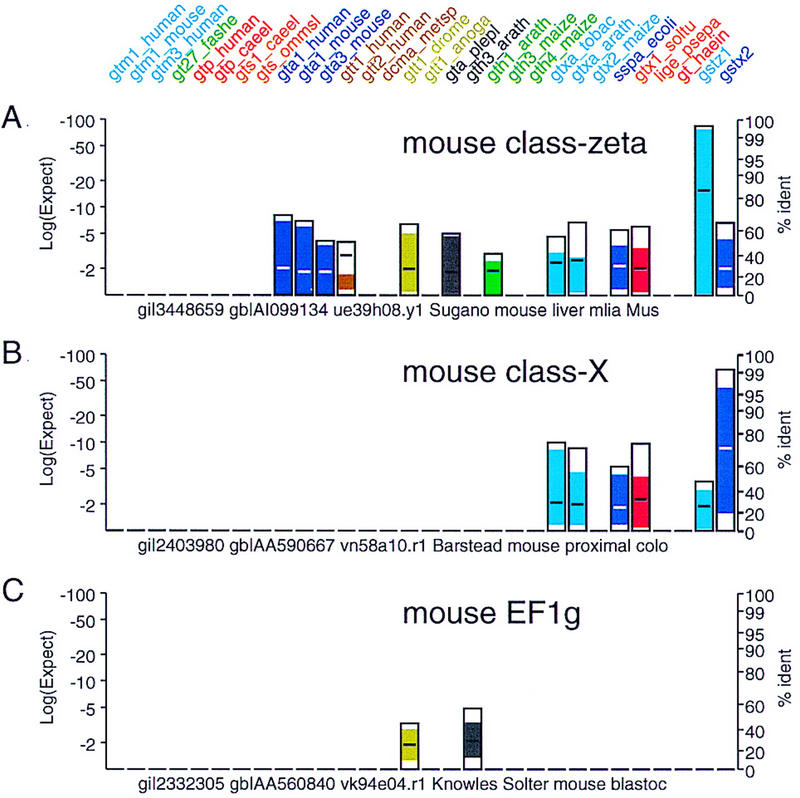
Novel glutathione transferase families. Mouse EST sequences that do not belong to the class-mu, -alpha, -pi, or -theta families are shown. These EST sequences share strong similarity to plant and bacterial glutathione transferases. (Two additional protein query sequences, a mouse class-zeta gst_z and a mouse class-X gst_x have been added to the panel to highlight the similarity of the novel ESTs with these new glutathione transferase classes.) Searches were performed as in Fig. 3. (A) EST (gi|3448659) belongs to a recently discovered glutathione transferase family termed class zeta (Board et al. 1997). (B) EST gi|2403980 (mouse class X), does not share significant similarity with any of the vertebrate sequences in the query set; strongest similarity is seen with the GTXA_TOBAC [E() < 10−10] and GTXA_ARATH [E() < 10−8] glutathione transferases. This EST belongs to a recently described novel mammalian glutathione transferase class (GenBank accession no. U80819, R. Kodym and M.D. Story, unpubl.). (C) EST gi|2332305 shares strong similarity with the EF1γ translation elongation factors and probably does not encode a glutathione transferase. The EF1γ proteins contain a domain homologous to glutathione transferases (Koonin et al. 1994).
Figure 8.
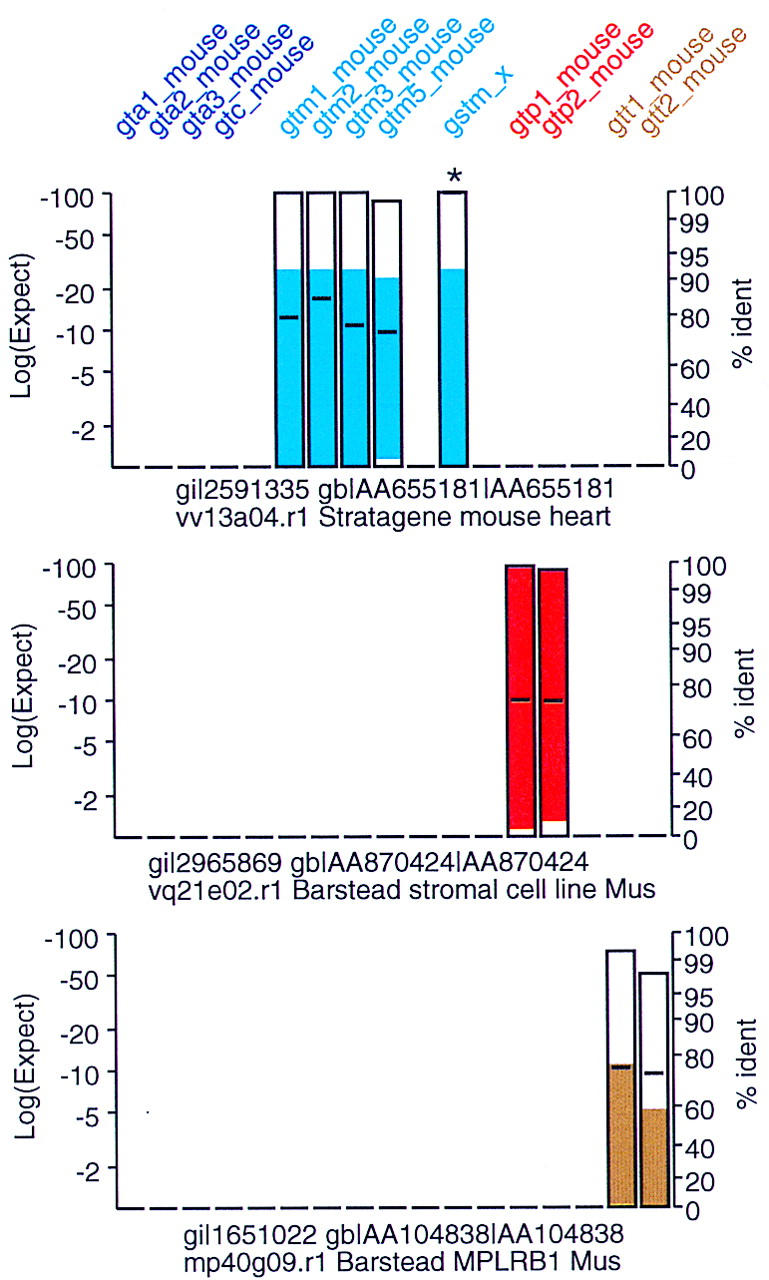
New glutathione transferase paralogs. The mouse EST database used in Fig. 3 was searched with mouse class-alpha, class-mu, class-pi, and class-theta protein sequences. Searches were performed with the tfasty3 program, using the MDM20 (Jones et al. 1992) substitution matrix. Gap penalties were set as in Fig. 3. Included in the plot, but not in the original search, is gstm_x, a novel mouse class-mu glutathione transferase that was assembled from EST sequences sharing less than 90% identity with any of the four known mouse class-mu GSTs. For this example the FAST_PAN program was set to not display sequences sharing 95% identity (or better) with any of the query sequences, except for gstm_x, which is highlighted as >95% identical with an asterisk (*).
Although the exact levels of identity differ from class to class, most of the glutathione transferases in the same color panel share >70% protein sequence identity; between panels sequence identities range from 30% to <20%. It is not necessary to search the EST and genomic DNA databases with each of the sequences in Figure 2; if two sequences are more than 80% identical over their entire length, either sequence will identify the same statistically significant similarities.
Searching for Novel Gene Families
A representative set of matches to known mammalian glutathione transferases in the NCBI/BLAST est_mouse database (ftp://ncbi.nlm.nih.gov/blast/db/est_mouse) from October 1998 is shown in Figure 3. Twenty-eight sequences from the tree in Figure 2 were used as the query sequence in 28 searches of the est_mouse database using tfasty3 with the default search parameters (BLOSUM50 matrix, −15 for the first residue in a gap, −3 for each additional residue, and −20 for frameshifts between or within codons; Pearson et al. 1997). Each of the histogram bars summarizes the similarity between the EST sequence and each of the 28 query sequences.
Each histogram bar provides four types of information about the similarity and alignment between the library EST or genomic DNA sequence and each protein query sequence (Fig. 4): (1) The height of the bar indicates the statistical significance of the translated DNA/protein alignment (left ordinate). (2) The shading of the bar indicates the portion of the protein query that is “covered” by the translated DNA alignment. (3) The position of the horizontal line in the bar reports the percent identity between the protein query and translated DNA sequence (right ordinate). (4) The color of the bar indicates the branch of the evolutionary tree that the protein query represents. Presenting the statistical significance, protein coverage, and percent identity in a compact format simplifies the interpretation of the relative similarities. For example, an EST encoding a known class-mu glutathione transferase may have a lower statistical significance (e.g., 10−40 rather than 10−80) but a higher percent identity (90%), because the EST sequence covers only a portion of the protein sequence. The histogram bars in Figures 3–5 allow one to distinguish at a glance lower statistical significance because of novelty from low significance with high identity because of partial coverage.
Figure 4.
Displaying similarity and identity. FAST_PAN summarizes the similarity of the query protein sequence with the DNA library sequence by plotting a bar with its height determined by the expectation value of the alignment score [left ordinate, log(Expect)]. The log(Expect) is plotted on a logarithmic scale to expand the log(Expect) resolution between −2 and −50. Alignments with expectation values better than 10−50 are typically well recognized already. The horizontal line within the bar indicates the percent identity of the alignment; percent identity is more informative when searching for new subfamily paralogs. The identity axis uses a nonlinear scale to expand the region from 70%–100%. The colored shading in the box is used both to group known families visually and to identify the boundaries of the DNA alignment on the protein query sequence. The bottom of the bar (Nt) indicates the location of the beginning (amino-terminal) of the alignment; the top of the bar (Ct) indicates the end (carboxy-terminal) of the alignment. In the example shown here, the EST sequence contains the amino-terminal two-thirds of the protein query sequences.
The panels in Figure 3 illustrate the profiles of similarities found between members of the classical mammalian glutathione transferase classes alpha, mu, pi, and theta. As expected from the evolutionary tree (Fig. 2) the class-mu EST sequence (Fig. 3A) shares the strongest similarity and the highest identity with query protein sequences in the same class, but also share strong similarity (but <30% identity) with class-alpha (Fig. 3B) and class-pi (Fig. 3C) sequences. Class-alpha and class-pi ESTs show similar cross-similarity. In contrast, the class-theta ESTs (Fig. 3D) share the strongest similarity with the mammalian class-theta query sequences and with insect class-theta and plant glutathione transferase queries. Consistent with the tree in Figure 2, the class-theta ESTs do not share significant similarity with class-alpha, -mu, or -pi sequences.
Figure 5 shows the similarity profiles for two recently recognized mammalian glutathione transferase gene families, class zeta (Board et al. 1997; EST gi|3448659) and an unnamed “class-x” EST (gi|2403980) represented in GenBank by HSU90313, accession no. U90313 (human), and locus MMU80819, accession no. U80819 (mouse, R. Kodym and M.D. Story, unpubl.; submitted to GenBank). The FAST_PAN program is a Perl script that performs the collation, sorting, and formats the histogram and alignment files. FAST_PAN results, as shown in Figures 3, 5, and 8, are actually presented as Adobe Acrobat portable document format (pdf) files that can be linked to the alignments when viewed through Netscape Communicator or Internet Explorer. The novel ESTs shown in Figure 5 were identified by looking at 500 EST hits on 100 pages of output from a scan of 368,464 EST sequences (149,626,398 residues) in October 1998. (In this scan ESTs were not shown if they shared more than 95% identity with one of the query protein sequences.) The first class-zeta EST was found on page 59 of 100; the EST shown in Figure 5A was seen on page 64 of the output. The EST in Figure 5B was the first from this class and was found on page 73.
By presenting the results of the FAST_PAN scan through an internet browser, it is straightforward to link to the supporting alignments on which the histogram plots are based. Figure 6A shows a portion of link from the histogram panel in Figure 5B. The alignments in Figure 6A show that the members of the glutathione transferase query protein sequence set that are most similar to the class-X EST gi|2403980 are plant and bacterial, rather than mammalian, glutathione transferases. In addition, the alignments show that the low sequence similarity is not due to poor EST sequence quality; there is only one frameshift (indicated with a \ or /) in the first alignment and none in any of the others. Alignments to poor-quality EST sequences typically have 5 or more frameshifts. Thus, we conclude based on statistically significant (E() < 10−6–10−10) sequence similarity that we have identified a glutathione transferase homolog. Based on the lack of significant similarity with mammalian class alpha, mu, pi, or theta, this EST is likely to belong to a novel mammalian class. That EST gi|2403980 is a novel plant-like mammalian glutathione transferase can be confirmed by selecting the FASTX search with gi|2403980 link in Figure 6A, which compares the gi|2403980 EST sequence to the SwissProt database using the fastx3 program (Pearson et al. 1997). The high-scoring sequences and two alignments from the fastx3 search are shown in Figure 6B; the fastx3 search confirms that the gi|2403980 EST shares significant similarity with many plant glutathione transferases.
A glutathione transferase domain is also found in the mammalian elongation factor EF1γ (Koonin et al. 1994). EF1γ proteins were not included in the query sequence set, but a small number of EF1γ ESTs were found in the search (Fig. 5C). EST gi|2332305 shares weak, but significant (E() < 10−5) similarity with a plant glutathione transferase sequence (GTH3_ARATH) and nonsignificant (E() < 4 × 10⁻⁴) similarity with a Drosophila class-theta sequence. (For single sequence searches, we consider E() < 0.01 statistically significant and have high confidence that sequences with E() < 0.001 are homologous in the absence of low complexity regions. As 28 similarity searches were performed to produce the results in Figs. 3 and 5, our threshold for statistical significance must be increased in stringency to 0.001/28 ≅ 2 × 10⁻⁵.) A re-search of the SwissProt database with EST gi|2332305 finds alignments with rabbit (EF1G_RABIT) and human (EF1G_HUMAN) elongation factor 1γ with E() < 10−90 and >90% amino acid sequence identity, confirming that this is a mouse EF1γ EST. With the thresholds that we use for displaying sequence similarities, 10−4 for the product of all E()-values and 10−2 for a pairwise (single-search) E()-value, all of the 600 ESTs displayed were either significantly similar to a glutathione transferase or to the EF1γ elongation factor.
Searching for Novel Orthologs and Paralogs
Figures 3–6 show how one can identify previously unrecognized gene subfamilies by searching with a comprehensive set of glutathione transferases. The FAST_PAN strategy can also be used to identify new orthologs of previously well-characterized gene subfamilies. For example, rather than finding a new glutathione transferase family, such as class zeta or class X (Fig. 5B), one might ask whether there are unrecognized class-mu glutathione transferases in the mouse. The motivation for this search can be seen by trying to identify the orthologs of human class-mu glutathione transferases in mice (Fig. 7). The evolutionary tree of mammalian class-mu enzymes strongly suggests that the human (GTM3_HUMAN) protein is orthologous with the mouse GTM5_MOUSE enzyme, and that GTM1_MOUSE/GTM1_RAT and GTM2_MOUSE/GTM2_RAT appear orthologous. (Orthologous protein sequences differ because of specific events, whereas paralogous sequences arise by gene duplication.) However, the orthologies between human GTM1, GTM2, GTM4, and GTM5 and mouse GTM1, GTM2, and GTM3 are unclear. More class-mu genes have been identified in humans (5) than in mouse (4 in SwissProt), and some human genes do not have clear rodent orthologs (Fig. 7). The difference in gene number and the lack of orthology suggests that additional mouse class-mu glutathione transferases (e.g., an ortholog to rat GTM3_RAT) may exist.
Figure 7.

Mammalian class-mu glutathione transferase paralogs and orthologs. An evolutionary tree of the mammalian class-mu glutathione transferases is shown. The indicated protein sequences were aligned and the alignments used to direct an alignment of the encoding cDNA open reading frames. These DNA sequences were then used to construct evolutionary trees using the PHYLIP DNAML program. Horizontal brackets indicate the three clear ortholog pairs in the tree.
The strategy for finding new class-mu (or class-alpha, -pi, or -theta) paralogs differs from the strategy for finding new protein subfamilies, because the evolutionary time scale is considerably shorter. The topology of the tree in Figure 2 suggests that classes alpha, mu, pi, and theta are >500 million yr (My) old but that within a class paralogs were duplicated in the last 100–300 My. Thus, the focus of the search shortens from 1.0–3.0 billion yr (as far back as possible) to <500 My, and, for the mammalian class-mu genes, <100 My.
We can shift the evolutionary look-back time for our searches by using a more stringent substitution matrix (Altschul 1991, 1993). To identify new mouse glutathione transferase paralogs, we used mouse class-alpha, -mu, -pi, and -theta protein query sequences against the est_mouse database using the MDM20 scoring matrix (Fig. 8; Jones et al. 1992). MDM20 is a modern version of a PAM20 scoring matrix (Schwartz and Dayhoff 1978) that is designed to identify proteins that are about 80% identical—the approximate level of identity that would be expected for protein sequences changing at 10%–20%/100 My (an average rate) that diverged in the last 100–200 My. Optionally, the FAST_PAN program will not show sequences that share more than a specified level of identity (typically 90%–95%); this excludes ESTs from likely known orthologs with sequencing errors.
Candidate novel paralogs to mouse class-mu, -pi, and -theta glutathione transferases are shown in Figure 8. The spectrum of similarities seen in Figure 8 is different from that in Figure 3. Using BLOSUM50 (Fig. 3), a mouse class-mu family member also shares significant similarity with class-pi and class-alpha queries; with MDM20 (Fig. 8), only class-mu query sequences share significant similarity with class-mu ESTs. A stringent scoring matrix also tends to exclude low-quality sequence data from the EST, which usually appears at the ends of the alignments.
EST sequences contain an average of 5% sequencing errors (Hillier et al. 1996) but can sometimes contain considerably more; thus, one cannot be certain that an EST sequence that is no more than 85% identical to known mouse proteins is a genuinely novel sequence. Fortunately, the sequences in est_mouse can be readily obtained from commercial sources and resequenced on both strands to confirm the novelty of an EST. This uncertainty should be reduced with genomic DNA sequences, which are expected to be of much higher quality.
DISCUSSION
We have developed a rapid method for visually summarizing large amounts of similarity score and alignment data that are routinely encountered in database scans for novel gene discovery. We are currently using this technique to scan for novel glutathione transferases and members of the G-protein-coupled receptor gene family. An alternative presentation of the histogram panel data has been implemented as a Java program for World Wide Web browsing.
The greatest strength of the approach is its presentation of four distinct kinds of information—statistical significance, alignment coverage, percent identity, and phylogenetic position—in a single histogram panel (Fig. 4). Whereas statistical significance is the single most critical feature to determine when evaluating a distantly related sequence, once homology has been established based on significant similarity, percent identity is a better overall measure of evolutionary distance. (Percent identity is a poor indicator of homology; unrelated sequences often share relatively high sequence identity over short regions, and general rules for significant identity, e.g., 25% identity over the length of the protein, can miss statistically significant relationships; Brenner et al. 1998.) Statistical significance is a poor surrogate for evolutionary distance because of its strong dependence on the length of the alignment; shorter partial EST sequences that are 100% identical will have lower expectation values than longer sequences that are 60%–70% identical.
In some ways, the FAST_PAN approach to identifying new protein family members by searching with multiple individual sequences is functionally similar to searches using multiple alignments, such as Hidden Markov Models (Eddy 1996), position-specific scoring matrices (Altschul et al. 1997), and other consensus pattern approaches (Grundy et al. 1997). Although both the FAST_PAN strategy and a multiple alignment approach are expected to identify efficiently new members of protein families, the pairwise alignment summaries provided by FAST_PAN make it much easier to determine whether an EST homolog is likely to represent a previously unrecognized subfamily. Moreover, it would be difficult to adjust the scoring matrix to identify novel gene paralogs with a single Hidden Markov Model or position specific scoring matrix. The FAST_PAN strategy is designed to provide an additional phylogenetic context that is difficult to achieve with conventional multiple sequence alignment methods.
The current FAST_PAN implementation allows the researcher to survey hundreds of EST and genomic DNA alignments rapidly. In the future, we hope to implement an accessory program that will take a selected sets of EST matches and alignment them together to produce assembled protein sequences; these sequences can then be rerun against the EST databases to identify ESTs that share very high identity (>95%). Additional improvements will seek to provide more accurate alignments between the EST and protein sequences, perhaps by using a different scoring matrix and gap penalties for the alignment than were used in the initial search (or by providing alternate alignments).
We have presented examples of gene discovery using complete protein sequences, but the evolutionary color-coding and selection of queries could be used in other ways as well. For example, one might search with a full-length query sequence and also with the different domains of a protein; such a search might highlight exon mosaics or allow one to focus on the less conserved amino- and carboxy-terminal domains of an ATPase-containing protein. In this case, one might use a “deeper” scoring matrix to search with the full-length sequence and a more stringent (shallower) scoring matrix to search with the subdomains of the protein (our current Perl program could be modified to provide this capability).
Although single searches with BLAST and FASTA can be very informative, establishing homology is only the first step towards establishing the biological role of a DNA or protein sequence. The FAST_PAN strategy seeks to extract more information from a potentially imperfect DNA sequence by providing a more complete evolutionary context.
METHODS
Sequence Databases
EST searches were performed on the ftp://ncbi.nlm.nih.gov/blast/db/est_mouse file of mouse ESTs obtained during September and October 1998 (the file is updated nightly) from the National Center for Biotechnology Information of the National Library of Medicine (NLM). Sequences were confirmed by searching the SwissProt and nonredundant protein databases obtained from the same location during that period.
Search Programs
Multiple alignments of glutathione transferase protein sequences were performed with ClustalW (Thompson et al. 1994). Evolutionary trees were constructed using programs from the PHYLIP (v. 3.2c) package (Felsenstein 1989). Similarity searches were performed with programs from the FASTA package (v. 31t; Pearson 1996). The tfasty3 program (Pearson et al. 1997) was used to compare protein sequences from the glutathione S-transferase family (Hayes and Pulford 1995) to the mouse EST database; tfasty3 compares a protein sequence to a DNA sequence library by translating the DNA sequences in the forward and reverse frames and calculating a similarity score that allows frameshifts, with fasty3, which compares a DNA sequence with a protein sequence database (Pearson et al. 1997). Sequence assembly was performed using programs from the Genetics Computer Group (Devereux et al. 1984).
Availability
The set of Perl scripts used to search an EST database with multiple query sequences, collate the results, and prepare the summary histograms are available from http://www.uvasoftware.org. The FASTA package of similarity searching and alignment programs is available from ftp://ftp.virginia.edu/pub/fasta.
Table.
Box 1. The FAST_PAN Strategy
| 1. A set of protein query sequences that reflects the evolutionary range of interest is assembled. To find entirely unrecognized families, a very diverse set of related sequences should be chosen. To fine new paralogs of known families, known paralogs from a specific organism (e.g., mouse or human) should be assembled. |
| 2. Each of these query sequences is used to search an EST or genomic DNA database using the tfastx3 or tfasty3 program. (The tfastx3 program is preferred for its speed when the alignment quality is not paramount; tfasty3 should be used when searching for new paralogs (Fig. 1A). |
| 3. The list of alignments from each search is parsed to extract the DNA library (EST) name, expectation value, percent identity, and boundaries of the alignment (Fig. 1B). |
| 4. The parsed table of alignment information is combined for all of the query sequences and sorted based on DNA library (EST) sequence identifier (Fig. 1C). |
| 5. The sorted table of library scores is rescanned to calculate a sum–score that combines the log (Expectation) scores for the alignments between the same library sequence and each of the query sequences that “found” the library sequence (Fig. 1D). |
| 6. The table of library scores is resorted by sum–score and sequence name, so that the library sequence that obtained the best total expectation value score is shown first, the next best second, etc. |
| 7. The final sorted list is used to produce (a) a postscript plot summarizing the expectation value, extent of alignment, and percent identity (Fig. 3); and (b) an html file that combines all of the alignments between the DNA library sequence and the different query sequences produced in step 1 (Fig. 6A). |
Acknowledgments
W.R.P. was supported by a grant from the NLM (LM04961). K.R.L. was supported by a research contract from Merck Research Laboratories, Merck & Co.
The publication costs of this article were defrayed in part by payment of page charges. This article must therefore be hereby marked “advertisement” in accordance with 18 USC section 1734 solely to indicate this fact.
Footnotes
E-MAIL wrp@virginia.edu; FAX (804) 924-5069.
REFERENCES
- Altschul SF. Amino acid substitution matrices from an information theoretic perspective. J Mol Biol. 1991;219:555–565. doi: 10.1016/0022-2836(91)90193-A. [DOI] [PMC free article] [PubMed] [Google Scholar]
- ————— A protein alignment scoring system sensitive at all evolutionary distances. J Mol Evol. 1993;36:290–300. doi: 10.1007/BF00160485. [DOI] [PubMed] [Google Scholar]
- Altschul SF, Gish W, Miller W, Myers EW, Lipman DJ. A basic local alignment search tool. J Mol Biol. 1990;215:403–410. doi: 10.1016/S0022-2836(05)80360-2. [DOI] [PubMed] [Google Scholar]
- Altschul SF, Madden TL, Schaffer AA, Zhang J, Zhang Z, Miller W, Lipman DJ. Gapped BLAST and PSI-BLAST: A new generation of protein database search programs. Nucleic Acids Res. 1997;25:3389–3402. doi: 10.1093/nar/25.17.3389. [DOI] [PMC free article] [PubMed] [Google Scholar]
- Board PG, Baker RT, Chelvanayagam G, Jermin LS. Zeta, a novel class of glutathione transferases in a range of species from plants to humans. Biochem J. 1997;328:929–935. doi: 10.1042/bj3280929. [DOI] [PMC free article] [PubMed] [Google Scholar]
- Brenner SE, Chothia C, Hubbard TJ. Assessing sequence comparison methods with reliable structurally identified distant evolutionary relationships. Proc Natl Acad Sci. 1998;95:6073–6078. doi: 10.1073/pnas.95.11.6073. [DOI] [PMC free article] [PubMed] [Google Scholar]
- Devereux J, Haeberli P, Smithies O. A comprehensive set of sequence analysis programs for the VAX. Nucleic Acids Res. 1984;12:387–395. doi: 10.1093/nar/12.1part1.387. [DOI] [PMC free article] [PubMed] [Google Scholar]
- Eddy SR. Hidden Markov models. Curr Opin Struct Biol. 1996;6:361–365. doi: 10.1016/s0959-440x(96)80056-x. [DOI] [PubMed] [Google Scholar]
- Felsenstein J. PHYLIP—Phylogeny Inference Package (Version 3.2) Cladistics. 1989;5:164–166. [Google Scholar]
- Grundy WN, Bailey TL, Elkan CP, Baker ME. Meta-MEME: Motif-based hidden Markov models of protein families. Comput Applic Biosci. 1997;13:397–406. doi: 10.1093/bioinformatics/13.4.397. [DOI] [PubMed] [Google Scholar]
- Hayes JD, Pulford DJ. The glutathione S-transferase supergene family—Regulation of GST and the contribution of the isoenzymes to cancer chemoprotection and drug resistance. Crit Rev Biochem Mol Biol. 1995;30:445–600. doi: 10.3109/10409239509083491. [DOI] [PubMed] [Google Scholar]
- Hillier L, Lennon G, Becker M, Bonaldo MF, Chiapelli B, Chissoe S, Dietrich N, DuBuque T, Favello A, Gish W, et al. Generation and analysis of 280,000 human expressed sequence tags. Genome Res. 1996;6:807–828. doi: 10.1101/gr.6.9.807. [DOI] [PubMed] [Google Scholar]
- Jones DT, Taylor WR, Thornton JM. The rapid generation of mutation data matrices from protein sequences. Comp Applic Biosci. 1992;8:275–282. doi: 10.1093/bioinformatics/8.3.275. [DOI] [PubMed] [Google Scholar]
- Koonin EV, Mushegian AR, Tatusov RL, Altschul SF, Bryant SH, Bork P, Valencia A. Eukaryotic translation elongation factor 1 gamma contains a glutathione transferase domain—study of a diverse, ancient protein superfamily using motif search and structural modeling. Protein Sci. 1994;3:2045–2054. doi: 10.1002/pro.5560031117. [DOI] [PMC free article] [PubMed] [Google Scholar]
- Mannervik B, Alin P, Guthenberg C, Jensson H, Tahir MK, Warholm M, Jornvall H. Identification of three classes of cytosolic glutathione transferase common to several mammalian species: Correlation between structural data and enzymatic properties. Proc Natl Acad Sci. 1985;82:7202–7206. doi: 10.1073/pnas.82.21.7202. [DOI] [PMC free article] [PubMed] [Google Scholar]
- Pearson WR. Effective protein sequence comparison. Methods Enzymol. 1996;266:227–258. doi: 10.1016/s0076-6879(96)66017-0. [DOI] [PubMed] [Google Scholar]
- Pearson WR, Wood T, Zhang Z, Miller W. Comparison of DNA sequences with protein sequences. Genomics. 1997;46:24–36. doi: 10.1006/geno.1997.4995. [DOI] [PubMed] [Google Scholar]
- Schwartz RM, Dayhoff M. Matrices for detecting distant relationships. In: Dayhoff M, editor. Atlas of protein sequence and structure. 5, suppl. 3. Silver Spring, MD: National Biomedical Research Foundation; 1978. pp. 353–358. [Google Scholar]
- Thompson JD, Higgins DG, Gibson TJ. CLUSTAL W: Improving the sensitivity of progressive multiple sequence alignment through sequence weighting, position-specific gap penalties and weight matrix choice. Nucleic Acids Res. 1994;22:4673–4680. doi: 10.1093/nar/22.22.4673. [DOI] [PMC free article] [PubMed] [Google Scholar]