

Abstract
The BAC-end sequencing, or sequence-tagged-connector (STC), approach to genome sequencing involves sequencing the ends of BAC inserts to scatter sequence tags (STCs) randomly across the genome. Once any BAC or other large segment of DNA is sequenced to completion by conventional shotgun approaches, these STC tags can be used to identify a minimum tiling path of BAC clones overlapping the nucleation sequence for sequence extension. Here, we explore the properties of STC-sequencing strategies within a mathematical model of a random target with homologous repeats and imperfect sequencing technology to understand the consequences of varying various parameters on the incidence of problem clones and the cost of the sequencing project. Problem clones are defined as clones for which either (A) there is no identifiable overlapping STC to extend the sequence in a particular direction or (B) the identified STC with minimum overlap comes from a nonoverlapping clone, either owing to random false matches or repeat-family homology. Based on the minimum overlap, we estimate the number of clones to be entirely sequenced and, then, using cost estimates, identify the decision rule (the degree of sequence similarity required before a match is declared between an STC and a clone) to minimize overall sequencing cost. A method to optimize the overlap decision rule is highly desirable, because both the total cost and the number of problem clones are shown to be highly sensitive to this choice. For a target of 3 Gb containing ∼800 Mb of repeats with 85%–90% identity, we expect <10 problem clones with 15 times coverage by 150-kb clones. We derive the optimal redundancy and insert sizes of clone libraries for sequencing genomes of various sizes, from microbial to human. We estimate that establishing the resource of STCs as a means of identifying minimally overlapping clones represents only 1%–3% of the total cost of sequencing the human genome, and, up to a point of diminishing returns, a larger STC resource is associated with a smaller total sequencing cost.
The BAC-end, or sequence-tagged-connector (STC), approach was proposed in 1996 as a new strategy for large-scale sequencing (Venter et al. 1996). The BAC-end sequencing strategy offers a potential solution to the growing disparity between the availability of sequence-ready maps of minimally overlapping clones and the community’s high-throughput sequencing capacity. In this scheme (Fig. 1), 400–500 bp of sequence is determined at the ends of the inserts of a large collection of BAC clones. As a result, sequence tags are randomly scattered across the genome. These BAC-end sequences, referred to as STCs, can be used to identify a minimum tiling path of BACs by computational procedures. Any “nucleation” sequence (the sequence of an entire BAC) can be compared electronically to the database of STCs to identify the next clones to be sequenced to maximally extend the contig. Groups at The Institute for Genomic Research (TIGR) and the University of Washington are currently collecting 900,000 STCs, representing the ends of >450,000 BACs. These clones are also being fingerprinted with a single restriction-enzyme digestion. To increase the likelihood that all regions of the genome are represented in this collection, the BACs are derived from at least two libraries created by digestion of the genome with different restriction enzymes.
Figure 1.

The STC resource and the STC sequencing strategy, as proposed by Venter et al. (1996).
At its completion, this effort will characterize sequences at an unprecedented density—a sequence read every 3.3 kb on average—across the human genome. At this STC density, any nucleation BAC (with an average insert size of 150 kb) will contain ∼45 STCs. The 45 BACs containing these STCs will be oriented 5′ to 3′ and aligned across the nucleation sequence by computer. The BACs minimally overlapping the 5′ and 3′ ends of the nucleation sequence are candidates for the next sequence extension. On average, 22 clones extend 3′ of the nucleation sequence and 22 clones extend 5′; hence, the average overlap in a particular direction will be ∼7 kb. Because the pairs of end sequences are used to identify and orient overlapping BACs, the STC strategy is akin to other implementations of double-ended strategies for sequence assembly and scaffolding (e.g., Edwards et al. 1990; Edwards and Caskey 1991; Chen et al. 1993; Smith et al. 1994; Richards et al. 1994; Roach et al. 1995; Weber and Myers 1997). The STC strategy combines a means to identify a BAC tiling path with a random shotgun approach to sequencing. The BAC tiling path permits compartmentalization of the sequencing and thus overcomes the drawbacks of whole-genome random shotgunning described by Green (1997). Thus, by using this centralized STC resource, contiguous human sequence could be obtained in distributed laboratories without the need for separate dedicated “mapping factories” (e.g., Wong et al. 1997).
One issue regarding this strategy is its cost. Intuitively, with more STCs scattered in the genome, one can identify clones with smaller average overlap with previously sequenced regions. This minimization of overlap leads to fewer clones completely sequenced and, hence, lower overall cost. But how do we trade-off the cost of establishing the STC resource of increasing density against the cost of sequencing an entire clone? A second issue is the impact of diverse repeats in the genome on the success of the strategy. The human genome is riddled with repeated sequence elements, ranging from the small, but very frequent, Alu elements to a variety of large, low-copy duplications. Clearly, STCs entirely contained within a repeat element can connect noncontiguous regions of the genome. Additional precautions, such as monitoring discrepancies among the restriction-digest fingerprints of overlapping BACs or checking chromosomal locations by fluorescence in situ hybridization (FISH), must be implemented to break these false connections.
In this paper we develop a tractable mathematical model to derive properties of the STC sequencing strategy. This work complements analytical and simulation models presented previously on related problems of large-scale mapping and sequencing (Roach et al. 1995; Myers and Weber 1997; Siegel et al. 1998b). Using this model, various parameters—such as the number of end sequences determined, the average insert size, the costs of various steps in the procedure—can be varied to assess the effect on overall costs or success of the approach. Success can be measured in terms of problem clones, from which continuation is not possible, owing either to the lack of identified matches in the database or to the possibility that a falsely matching STC will lead to sequencing of a nonoverlapping clone.
Here is an outline of the model. The target, for example, a model of the human genome, consists of bases independently chosen from a given nucleotide distribution. Clones of fixed length are assumed to be located independently and uniformly at random over the target. STCs at each clone end are sequenced with a specified error rate. A different, much lower error rate is used for completely sequenced clones, because this sequence is typically assembled from 8- to 10-fold overlapping sequence reads (i.e., a redundant shotgun approach), and each base is determined as the highest quality read from these overlapping sequences. A variety of repeat families is defined in the model. Each family is defined by its number of copies, the segment size, and percent similarity. We use a tractable, conservative decision rule for declaring a match between an STC and a sequenced clone. This decision rule is based on the number of matching bases found when comparing an STC aligned to a subregion of a sequenced clone. The problem-clone rate is derived, and the overall sequencing cost is estimated. Library parameters may then be changed to study their effect on the problem rate and on the overall cost of sequencing the target. The model can identify the optimum-cost parameters for which the incremental cost of increasing the STC resource reaches the point of diminishing returns, matching the corresponding decrease in the average cost of clone sequencing owing to smaller overlaps.
Box 1 presents our notation and assumptions in detail followed by an outline of the calculations for the expected number of problem clones (indicating the extent to which difficulties will be encountered while selecting successive clones to be sequenced in their entirety) and for the expected overlap for true STC extensions (indicating the overall extra cost owing to redundant sequencing, because with larger expected overlap, more clones will need to be sequenced to cover the target). Results for sequencing on the scale of the human genome then follow, using a variety of library sizes, clone lengths, and decision-rule criteria to identify low-cost strategies.
RESULTS
Sequencing on the Scale of the Human Genome
We have used the preceding methodology to investigate the properties of the STC strategy for sequencing a target of length T = 3 Gb, using libraries of clones of length C = 20 kb to 150 kb, with coverage S from 10 to 50. We used m = 400 bases in each STC, with the decision rule k chosen to minimize the total sequencing cost in each case. The base distribution used is set αA = αT = 30% and αC = αG = 20%, typical for the human genome. Base-sequencing errors were assumed to occur ε*STC = 4% of the time for STC end sequences and ε*clone = 1.5% of the time for clone sequencing.1 We included four nominal repeat families, with characteristics as shown in Table 1. Families are intended to model the types of repeats encountered in the human genome (A. Smit, pers. comm.).
Table 1.
Characteristics of Repeat Families Used in Calculation
| Name | Bases (Li) | Segments (Ri) | Average percent similarity (1 − ɛ*i,family) |
|---|---|---|---|
| ALU | 340 | 1 × 10⁶ | 85 |
| LINE | 5,000 | 100,000 | 85 |
| LG1a | 10,000 | 1,000 | 90 |
| LG2a | 100,000 | 20 | 90 |
LG1 and LG2 are hypothetical families used to simulate long, low-copy repeats.
Table 2 shows the results of our calculations for this target. The decision rule k must be set high to reject false matches owing to repeat families and can be set higher with larger libraries while improving cost performance. Some properties of the library improve as coverage increases, such as the expected number of gaps and expected number of missing bases from the target (computed using theorem 8 in Appendix B). The expected number of problem clones was computed by summing the results of theorems 1 and 2; these values fluctuate owing to discreteness of the decision rule k (see Fig. 3 and its discussion, below). The number of clones to sequence is from theorem 3 and has not been adjusted to reflect problem clones. Total cost in gigabases counts each STC base sequenced as 1 and each fully sequenced clone base as 7.5. Total cost in $millions assumes a cost of $0.03 per STC base sequenced (i.e., $24 per STC library clone and $33,750 per fully sequenced clone). Total costs have been adjusted by adding, for each problem clone, twice the cost of sequencing an entire clone. We also indicate the cost of the STC resource as a percentage of the total sequencing cost.
Table 2.
Results for a 3-Gb Target with Repeat Families, with Decision Rule k Chosen to Minimize the Total Cost in Each Case, Using Clones of Length C = 150 kb
| Coverage S | Decision rule k | Number of gaps | Bases missing | Problem clonesa | Clones to sequence | Total cost (Gb) | Total cost ($millions)b | Cost of STC resource (%)d |
|---|---|---|---|---|---|---|---|---|
| 10 | 369 | 9.08 | 136,200 | 24.8 | 22,336 | 25.343 | $760.30 | 0.6 |
| 15 | 370 | 0.09 | 918 | 9.5 | 21,539 | 24.492 | 734.77 | 1.0 |
| 20 | 370 | 0.00 | 6 | 12.5 | 21,147 | 24.138 | 724.15 | 1.3 |
| 25 | 371 | 0.00 | 0 | 7.1 | 20,935 | 23.967 | 719.02 | 1.7 |
| 30 | 371 | 0.00 | 0 | 8.5 | 20,782 | 23.879 | 716.38 | 2.0 |
| 35 | 371 | 0.00 | 0 | 9.9 | 20,675 | 23.842 | 715.25 | 2.3 |
| 38.83 | 371 | 0.00 | 0 | 11.0 | 20,612 | 23.834c | 715.03c | 2.6 |
| 40 | 371 | 0.00 | 0 | 11.3 | 20,595 | 23.835 | 715.05 | 2.7 |
| 45 | 372 | 0.00 | 0 | 5.6 | 20,546 | 23.847 | 715.40 | 3.0 |
| 50 | 372 | 0.00 | 0 | 6.2 | 20,496 | 23.872 | 716.15 | 3.4 |
See Fig. 3.
Computed for a cost unit of $0.03 (see text).
Minimum total cost, over all S.
As percent of total cost.
Figure 3.

The expected number of problem clones vs. coverage S for selected values of clone length C, with k chosen to minimize cost in each case. Discontinuities are attributable to the discrete nature of the decision rule k, which has been chosen to minimize cost, not the number of problem clones.
Note that the total cost decreases with larger STC libraries up to the optimal library size with 38.83-fold coverage and cost of 23.834 Gb. This decrease is attributable to the fact that, even though more clones need to be isolated and end-sequenced (at 800 bp of sequence per clone), fewer clones need to be completely sequenced (at 1.125 × 10⁶ bp of sequence per clone) because the expected overlap of sequenced clones is smaller.
We now examine the effect of library characteristics (clone length C and coverage S). Figure 2 shows the relationship between the optimal expected cost (minimized by choosing the decision rule k) and the library size (measured by the coverage S) for selected values of clone length C. Note the large cost savings obtained by choosing a clone length >20 kb. Although these savings continue with larger C, there are diminishing returns. Note also that the overall optimal coverage value (yielding smallest overall cost for a given C) increases with clone length.
Figure 2.

Expected cost vs. coverage S for selected values of clone length C, with k chosen to minimize cost in each case.
Figure 3 shows the relationship between the expected number of problem clones and the library size (measured by the coverage S) for selected values of clone length C (with k again chosen to minimize cost). For each fixed coverage, the expected number of problem clones decreases with the clone length, again showing diminishing returns as C grows. Discontinuities in the curves are owing to discrete changes in the decision rule k: For the critical S at a discontinuity, two consecutive values of k yield exactly the same expected cost but with a different expected number of problem clones. Smoothing these discontinuities, the overall impression is that the number of problem clones is decreasing with S for each fixed insert size C.
We then examine the effects of the decision rule k. Figure 4 shows how the total expected cost responds to the choice of decision rule k, shown here for the case C = 150 kb and S = 15. Cost is minimized with k = 370 and appears fairly flat for k near 370. However, if k = 368 is used instead of 370, then the additional estimated cost is equivalent to sequencing an additional 40 Mb; if k = 371 is used, then the additional cost is 20 Mb sequenced. The cost grows both for larger k (because there are fewer declared STC matches; hence, larger overlap and more clones to sequence) and for smaller k (because of the cost of false declared overlaps).
Figure 4.

The total cost expected as a function of the decision rule k, in the case C = 150 kb and S = 15. Large k values are costly because fewer true overlaps will be detected, and therefore, more clones must be sequenced. Small k values are costly because more false overlaps will be declared owing to repeat homologies.
Figure 5 shows that the expected number of problem clones is sensitive to the choice of decision rule k (shown here for the case C = 150 kb and S = 15). The problem clone rate is minimized by choosing k = 374 and grows steadily both for larger k (owing to nonextendable clones with no declared overlap) and for smaller k (owing to the declaration of false overlaps, primarily owing to repeat homology). Note that although problem clones are minimized here (at 1.2 problem clones) by using k = 374, total cost is minimized instead with k = 370 (at 9.4 problem clones, but at a cost savings of 222 Mb owing to the smaller average overlap obtained when more overlaps are declared).
Figure 5.

The expected number of problem clones vs. the decision rule k, in the case C = 150 kb and S = 15. When k is large, true overlaps are missed, leading to more problem I clones. When k is small, false overlaps are declared, leading to more problem II clones.
If the repeat families in a genome have greater homologies, there are more problem clones and the cost goes up. If, for example, similarities are increased by five percentage points in Table 1, the number of problem clones rises from 9.5 to 973.8 (and cost rises from 24.49 to 27.90Gb) at coverage S = 15 and problem clones rise from 7.1 to 631.4 (and cost rises from 23.97 to 26.83Gb) at coverage S = 25.
Until now, we have used 7.5 for the cost ratio (a conservative value for the redundancy needed to sequence an entire clone using a random shotgun strategy). Figure 6 shows how the optimal coverage S depends on the cost ratio in the case T = 3 Gb, C = 150 kb. As the cost ratio rises, the cost of sequencing an entire clone rises relative to the cost of the STC resource. For higher cost ratios, the optimal coverage is even higher than the 38.83 found in Table 2. It is therefore economical, with higher cost ratio, to enlarge the STC library to decrease total cost by detecting more STC matches and therefore, on average, decreasing the overlap between sequenced clones.
Figure 6.

As the cost ratio (the cost, per base, of sequencing an entire clone, compared with the cost, per base of sequencing an STC) rises, so does the optimal coverage S because the relative cost of the STC resource is lower. The small discontinuities are owing to the discrete nature of the decision rule k.
If a set of clones lying end to end across the entire genome were available, then the cost of sequencing the genome would only be T times the cost per base pair of sequencing an entire clone. Figure 7 shows the effect of target size on the extra cost of efforts to select clones for sequencing (i.e., developing the STC resource) and the extra cost of sequencing the redundant portions of two overlapping clones, for the case of C = 100 kb and S = 20 and 30. This extra cost is expressed in Figure 7 as a percentage of the cost of sequencing each base of the target at the per-base cost of sequencing an entire clone. This overhead cost is fairly constant across a wide range of target sizes.
Figure 7.

The “percent excess bp to sequence” compares total cost from the model to the cost of sequencing T/C clones (i.e., sequencing each base of the target at the per-base cost of sequencing an entire clone). The number of repeats in each family has been scaled in proportion to T. This linear scaling is conservative because the smaller microbial genomes contain few repeats and thus can be assembled with fewer problem clones and at lower cost than modeled here.
DISCUSSION
We have presented a mathematically tractable model for analyzing the process of sequencing a random target using the STC strategy. In this model, the target consists of bases independently chosen from a given nucleotide distribution. Clones of fixed length are located independently and uniformly at random over the target. STCs at each clone end are sequenced with known error rate. A lower error rate is used for finished BAC sequence. Each repeat family is defined by its number of segments, segment size, and percent similarity. The problem-clone rate is derived, and the overall sequencing cost is estimated. Library parameters may then be changed to study their effect on the problem rate and on the overall cost of sequencing the target.
We make a number of assumptions that ensure mathematical tractability of the analysis, greatly simplifying it but incorporating the essential features of the situation presented by the human genome into the model. For example, our chosen models for the randomness of the target, sequencing errors, repeat family similarity, and overlap decision rule work together to allow the use of a binomial distribution for the probability of a particular true or false match. When the assumptions do not correspond exactly to the reality of the laboratory situation, their effect is generally conservative; that is, the computed error rate is larger owing to the assumptions. For example, the overlap decision rule has been simplified to reflect only the number of matching bases, whereas the sequencing error rate has been inflated over currently achievable levels to accommodate insertion/deletion errors and polymorphism. Dynamic alignment algorithms make it possible to treat insertion and deletion errors as substitution errors for the purposes of this model. Our model assumes that the clones in the library randomly sample the human genome. This assumption may not be met by any single BAC library (although our recent data suggest that the BAC libraries now being used for DNA sequencing have good coverage). Therefore, efforts to ensure more uniform coverage, for example, through the use of additional BAC libraries constructed with other restriction enzymes, will be valuable to the genome project.
The mathematical model is conservative in the following ways: First, performance can only be improved by appropriately using a more complex decision rule (e.g., recognizing known repeat families within the STC and using alignment procedures that account for insertions and deletions). For example, Myers and Weber (1997) uses a simulation model for map-based shotgunning that handles repeat-family recognition by excluding clone ends that are in repeats from consideration for assembly, reducing both false and true overlaps. Additionally, they incorporate known mapping and EST data into their simulation; such data are useful for the assembly of any shotgun project both by increasing true matches and by reducing false matches. Second, sequencing error rates currently achievable are considerably lower than the values used here; we chose larger values in part to compensate for polymorphism and for not explicitly modeling the details of insertion and deletion errors. Third, the computed number of problem clones and its estimated effect on sequencing cost are larger than is likely to occur in practice because (1) relatively few clones will actually be selected for sequencing and extension (a problem clone, if not selected, is not a practical problem) and (2) an extension clone that is falsely connected to a problem clone may be rejected before costly sequencing if fluorescence in situ hybridization is used to confirm that the extension maps at the same chromosomal location as the previous clones.
The mathematical model is not conservative in the following ways: First, bases are not independently and identically distributed from a fixed nucleotide distribution, and although we have matched the average GC/AT ratio of the human genome, this value fluctuates locally across the genome (Saccone et al. 1993). Second, bases in repeat family segments are not conditionally independently and identically distributed given a prototype, although such a model can correctly express distinct similarity levels of different families. Third, repeat family segments are, in reality, not all contiguous.
Regarding repeat-family modeling, it is not clear whether this aspect of our model is conservative or not, because although a dispersed family will overlap more clones, each clone is affected to a lesser degree than if the segments were contiguous. Note that whether repeats are interspersed or contiguous, both the expected number of clones containing each base of repeat and the expected number of repeat-family bases in each clone remain unchanged. Thus, although modeling of interspersed repeats would add considerable complexity to the model, we would not expect to see large differences in the results.
Note that the number of problem clones is sensitive to the degree of similarity among repeat-family members. Thus, the STC strategy will benefit, as will any random sequencing project, from inclusion of methods to flag STCs that lie completely in repeats (e.g., by comparison to known repeated sequences) or to identify falsely joined clones (e.g., by FISH or through comparison of restriction-digest patterns). Our model assumes that no prior or dynamic knowledge of repeat families is used to aid recognition. This assumption permits us to demonstrate feasibility in a worst-case scenario. In an actual project, almost all repeats will be recognized as belonging to known families. Furthermore, initially unknown repeat families can be dynamically recognized by topological or clone-length incompatibilities (Myers and Weber 1997). Importantly, false joins caused by STCs in longer, unknown repeats can be detected through inconsistencies in restriction-digest patterns of overlapping clones. Long repeats are also almost certain to cause topological incompatibilities (e.g., chromosome jumping), which are easily detectable by FISH or by radiation-hybrid mapping of end sequences.
Based on this model, we conclude that a target of 3 Gb with repeat families may be sequenced at an estimated cost of 24.5 Gb sequence cost units ($735 million, at $0.03 per cost unit and a ratio of 7.5 cost units for each finished base sequenced by a redundant shotgun approach to 1 cost unit for each base in the STC ) using a library of 300,000 clones with inserts of 150-kb length, with <10 problem clones expected. In this case, the cost of the STC resource is ∼1% of the total sequencing cost. Larger clone insert sizes are associated with smaller cost. Lower cost is also associated, up to a point of diminishing returns, with greater coverage (i.e., a larger STC library resource). Both the cost and the number of problem clones are sensitive to the decision rule used to decide clone overlap. Given an insert size, an optimal library size exists that minimizes total cost. The cost of the BAC-end sequence STC resource at the optimal STC library size is ∼3% of the total sequencing cost. This approach therefore compares very favorably to other mapping approaches for selection of a minimally overlapping set of clones for sequencing (Siegel et al. 1998a,b).
Table.
Box 1. Theory
| Notation and Assumptions |
| We now outline model specifications for the target size, clone size, clone library size, STC length, the rule for declaring a match of an STC and a region of a sequenced clone, the probability distribution for randomness of nucleotides, sequencing-error rates, frequencies of true and false overlap declaration, repeat families, problem clones, and economic cost considerations. |
| • Target and library specifications are denoted as follows: |
| • T is the length of the genomic target to be sequenced in base pairs. For simplicity, we will ignore edge effects at the ends of the target. |
| • C is the clone insert length in base pairs. This length can be varied to find the optimal clone size for a target of size T. |
| • N is the number of clones to be analyzed to form the library of STCs and from which selected clones are to be sequenced in their entirety. The N clones of length C are assumed to be randomly and independently located along the target. Several tests (including FISH analyses of clones and the frequency of matches between the current set of STCs with known repeats and other sequences in the public databases) suggest that the clone inserts in the BAC libraries that are now in widespread use are fairly uniformly distributed across the genome (L. Hood, C. Venter, G. Mahairas, M.D. Adams, J. Young, and B.J. Trask, unpubl.). |
| • S = NC/T defines the coverage or redundancy as the total clone length divided by the target length, representing the expected number of clones covering each base of the target. |
| • STC length and decision rule are specified as follows: |
| • m is the number of bases that define an STC at each end of each clone. |
| • k specifies the rule used to decide overlap between an STC of one clone and a sequenced subregion of length m from another clone. If the STC sequence and the subregion sequence have k or more corresponding positions with the same base, they will be declared to overlap.1 This conservative rule was chosen for tractability; more complex rules might consider clustering of the matches and exclusion/adjustment for known frequent repeats, potentially improving performance by using additional information. |
| • Nucleotides are assumed to be drawn from the following probability distribution: |
| • αA, αC, αG, and αT specify the probabilities of choosing each base at random (so that αA + αC + αG + αT = 1). We assume that the target consists of T independently selected random bases from this distribution. |
| • α = α2A + α2C + α2G + α2T is then the probability that two independently selected bases are identical by coincidence. |
| • Errors in sequencing STC ends and entire clones are modeled as follows: |
| • ɛSTC denotes the STC sequencing problem rate (which will be used to define the observed sequencing error rate). We assume that bases are read independently. A base is read initially correctly with probability 1 − ɛSTC. With probability ɛSTC, the reading is instead an independently sampled random base (with distribution specified by αA, αC, αG, and αT) that may, by coincidence, be the correct base |
| • ɛ*STC denotes the STC sequencing error rate, that is, the probability that a given base in an STC sequence has been read incorrectly. Note that ɛ*STC = ɛSTC (1 − α), so the observed error rate is less than the problem rate ɛSTC. |
| • ɛclone denotes the clone sequencing problem rate, defined using the same process as for ɛSTC. We allow these problem rates to be different because the clone sequences are typically assembled as the consensus of many overlapping subclonal sequences [typically ≥7.5 (Rowen et al. 1997)], whereas the STC will result from a single end-sequence determination. |
| • ɛ*clone denotes the clone sequencing error rate, that is the probability that a given base in a sequenced clone has been read incorrectly. We again have the relationship ɛ*clone = ɛclone (1 − α). |
| • Probabilities and frequencies of true and false matches are as follows: |
| • ptrue denotes the probability that a particular STC is (correctly) declared to match an m-base portion of a sequenced clone when, in fact, both sequences refer to the same m-base region of the target. A formula for ptrue is given in theorem 4 of Appendix A. Whereas ptrue is expected to be close to 1, it may be beneficial to choose a high value for the decision rule k so that ptrue is slightly smaller to protect against the possibility of falsely matching a similar sequence from a repeat family. |
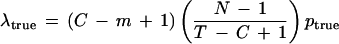
| • λtrue = (C − m + 1) [(N − 1)/(T − C + 1)] ptrue denotes the expected number of truly overlapping STCs detected within a particular sequenced clone that would extend that sequence in a particular direction (if the STC’s clone was selected and sequenced). This formula is justified in Appendix A, following the proof of theorem 4. Locations of such STCs within the clone will be assumed to follow a Poisson process. Note that if m is small compared with C and if C is small compared with T, then λtrue ≅ Sptrue. |
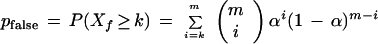
| • pfalse denotes the probability that a particular STC of one clone is (incorrectly) declared to match a particular m-base portion of a sequenced clone when, in fact, the two sequences represent distinct nonrepeat regions of the target (false matches owing to repeat regions are counted separately). A formula for pfalse is given in theorem 5 of Appendix A. |
| • λfalse = 2(C − m + 1)(N − 1)pfalse denotes the expected number of nonoverlapping STCs declared (incorrectly, even in the absence of repeat homology) to overlap within a particular sequenced clone extending in a particular direction. This formula is justified in Appendix A, following the proof of theorem 5. Locations of such STCs within the clone will be assumed to follow a Poisson process. |
| • Each repeat family will be modeled, to ensure tractability, as a group of contiguous segments with similar sequences, and these segments will be conditionally independent given a family-prototype segment. This specification model expresses both similarity and randomness in a tractable manner. Placing the members of a repeat family in a contiguous group is intended to model a worst-case scenario. In reality, most repeated elements are separated by unique-sequence DNA. For the ith family (i = 1, …, φ) where φ denotes the number of families, we define: |
| • Li is the length, in bases, of each segment of the family. |
| • Ri is the number of repeating segments in the family. |
| • We assume that the family has a prototype segment (not necessarily present in the genome) consisting of Li bases selected independently at random from the αA, αC, αG, αT distribution. We recognize that the AT/GC content of some repeats deviates from the genomic average (e.g., Alus are high in GC base pairs), but this assumption is made for tractability of the model. |
| • ɛi,family is the problem rate for the ith family (using the same terminology as earlier, even though these are not really “problems”). We assume that each segment’s bases are independently determined. A base is identical to the homologous prototype base with probability l − ɛi,family. With probability ɛi,family, the base is instead an independently sampled random base (with distribution specified by αA, αC, αG, and αT) that may, by coincidence, be the same base as in the prototype. | ||
• ɛ*i,family is the difference rate for the ith family, that is, the probability that a given base in one segment differs from the homologous base in another segment from the same family. Relationships are ɛ*i,family = [1 − (1 − ɛi,family)2](1 − α) and ɛi,family = 1 − √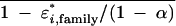 , because differences can occur whenever either (or both) segments differ from the prototype. , because differences can occur whenever either (or both) segments differ from the prototype. | ||
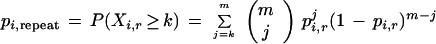
| • pi,repeat is the probability that a particular STC of one clone is (incorrectly) declared to match a particular homologous m-base portion of a sequenced clone (owing to repeat family homology) when, in fact, the two sequences refer to distinct, but homologous, regions of the target within the same repeat family. A formula for pi,repeat is given in theorem 6 of Appendix A. | ||
| • λi,repeat = (C − m + 1)[Ri(N − 1)/(T − C + 1)]pi,repeat is the expected number of homologous STCs declared (incorrectly) to overlap within a particular sequenced clone (for a clone that is entirely within the repeat family) extending in a particular direction. This formula is justified in Appendix A, following the proof of theorem 6. Locations of such STCs within the clone will be assumed to follow a Poisson process. | ||
| • Problems involving the selection of a clone to continue beyond a fully sequenced clone will be defined as follows: | ||
| • A problem I clone is one for which there is no clone in the library with a matching STC extending in a particular direction, either because this region is not represented in the library or because the STC match was not recognized owing to sequencing errors. Note that a problem I clone does not necessarily produce a gap, because the gap may be closed from the other direction, that is, the STC of the problem I clone may be declared to match the internal sequence of a clone being extended from another nucleation site. A general formula for the probability that a particular clone is a problem I clone is provided in theorem 7 of Appendix A. | ||
| • A problem II clone is one for which at least one declared STC match extending in a particular direction exists in the library, but, of these declared matches, the one with minimum overlap is actually a false STC match. Note that some problem II clones will not actually pose a problem, because the clone with the STC match will be identified as false before being sequenced by using its fingerprint to establish consistency among overlapping clones, by using FISH to confirm its chromosomal location, or by identifying known repeats in the STC. In such a case, there may be a true declared STC match with larger overlap of the nucleation clone that could be chosen instead. A general formula for the probability that a particular clone is a problem II clone is provided in theorem 7 of Appendix A. | ||
| • A problem clone is a clone that is either a problem I or a problem II clone extending in a particular direction. Note that a problem clone does not necessarily pose a problem in the sequencing effort because, in addition to the reasons cited in the two preceding paragraphs, a problem clone may never be selected for sequencing and extension (although it will be selected if it is identified as the minimally overlapping extension of a preceding clone that was sequenced). A general formula for the probability that a particular clone is a problem clone is provided in theorem 7 of Appendix A. | ||
| • Costs are modeled as follows, with the basic unit being the sequencing cost per base of the STC resource and other costs expressed as ratios to this basic unit: | ||
| • Cost is measured in units of sequencing operations per base and is set here at 1 per base for STC sequencing and at 7.5 per base for sequencing an entire clone, although other values may be substituted. The costs per sequenced base pair are higher for the completely sequenced clone because a random shotgun strategy is assumed and multiple overlapping subclones need to be sequenced to assemble large contiguous sequences. Although each base in a clone assembled by shotgun is typically sequenced 8–10 times, we have used the more conservative value of 7.5, which is also intended to reflect the cost of isolating and handling each clone in the STC library. If, for example, m = 400 and C = 150,000, then the cost per clone is 800 to sequence both STC ends and 150,000 × 7.5 = 1.125 × 10⁶ to sequence the entire clone. When converting to dollar values, these costs should include associated costs of clone isolation and storage. For example, if one cost unit is $0.03, then the cost per clone to sequence both STC ends would be $24, whereas the cost to sequence the entire clone would be $33,750. In the future, costs are expected to be lower. | ||
| • Cost per problem clone is set at twice the cost of sequencing an entire clone. This allows for the cost of sequencing an extra falsely matching clone, redundant sequencing of clones that have considerable overlap, and the cost of filling gaps in a directed fashion. Note that in practice the cost will often be much less, owing to rejection of the falsely matching clone before it is sequenced (e.g., based on fingerprinting and/or in situ hybridization). In addition, as previously noted, a problem clone may never even be selected for sequencing and extension. | ||
| The Expected Number of Problem Clones | ||
| An upper bound for the expected number of problem clones in the library, when extending in a particular direction, may be found by adding together the results of the following two theorems, which distinguish between clones that overlap a repeat region and those that do not. This result gives a conservative estimate of problem occurrences because a clone overlapping a repeat region is treated as though it is entirely contained within that region. | ||
| Theorem 1. The expected number of problem clones (for extension in a particular direction) that overlap repeat regions of the target is no larger than | ||
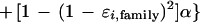
| ||
| Proof. This is the sum over repeat families of the expected number of clones that overlap that repeat region (first term within the summation) times the probability that a clone entirely within that repeat region is a problem (second term). A conservative bound results from applying the higher incidence of problems for clones entirely within the repeat family even to those that only partly overlap the repeat family. The probability has been obtained using theorem 7 in Appendix A but recognizing that false STC matches may occur either at random or owing to homology within the repeat region; hence λf = λfalse + λl,repeat. |

| Theorem 2. The expected number of problem clones (for extension in a particular direction) that do not overlap any repeat region of the target is | ||
| ||
| Proof. This is the expected number of clones that do not overlap any repeat region (first term in parentheses) times the probability that such a clone is a problem (second term). The probability has been obtained using theorem 7 in Appendix A, recognizing that false STC matches in this case may occur only at random. | ||
| The Expected Overlap for True STC Extensions | ||
| The overlap among clones selected for sequencing is costly because it increases the total number of clones that must be sequenced to cover the target. The size of this overlap is an indication of the amount of redundant effort because these bases in the target will have to be sequenced as part of the effort of sequencing both clones. When the minimally overlapping declared clone is selected for sequencing, it will overlap the clone being extended by at least m base pairs. Overlap (in addition to this minimal amount) will decrease as the number of STCs in the library increases. | ||
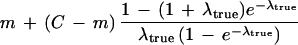
| Theorem 3. Given a clone with at least one true declared STC match for extension in a particular direction, the expected size of the smallest overlap (in bases) among all true declared STC matches for extension in that direction is | ||
| ||
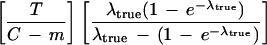
| If the entire target could be sequenced using clone extensions with this expected overlap size, then an estimate of the number of clones to be sequenced (ignoring problem clones for this calculation) is given by | ||
| ||
| Proof. In addition to the required m-base STC overlap, there will be an additional random overlap over the remaining C − m bases of the clone being extended. The probability distribution of the size of this random overlap is that of an exponential random variable (owing to the Poisson process) with mean (C − m)/λtrue, conditional on it being < C − m (i.e., there being a true STC event within this region). Adding the mean of this random variable to m, we have equation 3. The average extension is found by subtracting equation 3 from C. The estimated number of clones to sequence (equation 4) is then found by dividing the target length T by this average extension. |

Although this model includes only substitution errors in the equations, our high chosen error rate is intended to account for both substitution and insertion/deletion errors, counting the insertion/deletion errors as substitutions.
Acknowledgments
A.F.S. holds the Grant I. Butterbaugh Professorship at the University of Washington. J.C.R. is supported by the Medical Scientist Training Program (NIGMS). This work has been supported in part by U.S. Department of Energy grant DEFC03-96ER62299.
The publication costs of this article were defrayed in part by payment of page charges. This article must therefore be hereby marked “advertisement” in accordance with 18 USC section 1734 solely to indicate this fact.
Probabilities of Declared Matches and Problem Clones
Theorem 4
Given an STC of one clone and an m-base portion of another clone that corresponds to the same m bases of the target, the probability (in the presence of independent sequencing errors) that they are (correctly) declared to match is
 |
5 |
in which Xt has a binomial distribution with m trials and probability
 |
6 |
which represents the probability that two corresponding bases are read as identical.
Proof
A binomial distribution follows from independence of bases in the target and in the sequencing error processes. The probability pt may be found by calculating it for the case in which both reads are done correctly [with probability (1 − ɛSTC)(1 − ɛclone)] and combining it with the case in which one (or both) are incorrectly read (in which case the reads will be identical with probability α):
 |
7 |
 |
This result can be rearranged to give the result in the theorem.
To see that
 |
multiply the probability ptrue that a particular overlap is detected by the number of true STC overlap positions available in the clone and by the expected number of STCs in the library (other than this clone) that truly overlap a given position to extend in a specified direction. A detailed proof would begin by representing the number of such STCs as a sum of indicator functions.
Theorem 5
Given an STC of one clone and an m-base portion of another clone that corresponds to a nonoverlapping region of the target, the probability (in the presence of sequencing errors) that they are (incorrectly) declared to match (when neither sequence overlaps a repeat family) is
 |
8 |
in which Xf has a binomial distribution with m trials and probability α that two random bases are read to be identical.
Proof
A binomial distribution again follows from independence of bases in the target and in the sequencing error processes, with α previously defined as the probability that two randomly selected (or incorrectly read) bases are identical.
To see that λfalse = 2(C − m + 1)(N − 1)pfalse, start with the probability pfalse that a particular nonoverlapping STC and clone region are (wrongly) declared to overlap and multiply by the number of (false) STC overlap positions available in the clone and by the number of STCs in the library (other than this clone).
Theorem 6
Given a clone that has an STC entirely within the ith repeat family and a homologous m-base region of another clone, the probability (in the presence of sequencing errors) that they are (incorrectly) declared to match is
 |
9 |
in which Xi,r has a binomial distribution with m trials and probability
 |
10 |
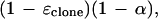 |
which represents the probability that two homologous bases are read as identical.
Proof
A binomial distribution again follows from conditional independence of bases in the two homologous regions (conditioning on the prototype segment), which are independent of the sequencing error processes, with α previously defined as the probability that two randomly selected (or incorrectly read or changed from the prototype segment) bases are identical. The probability pi,r may be found by calculating it for the case in which both bases are correctly read and combining it with the case in which one or both are incorrectly read (so that reads are identical with probability α):
 |
11 |
 |
 |
This result can be rearranged to give the result in the theorem.
To see that λi,repeat = (C − m + 1)[Ri(N − 1) / (T − C + 1)]pi,repeat, start with the probability pi,repeat that a particular homologous STC and clone region are (incorrectly) declared to overlap and multiply by the number of (false) STC overlap positions available in the clone and by the expected number of homologous STCs in the library (other than from this clone).
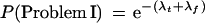
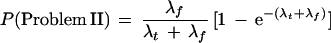
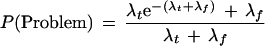
Theorem 7
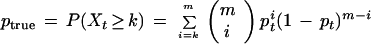
Suppose a clone is to be extended in a particular direction and that the true declared STC library matches are a Poisson process with mean λt occurrences and that the false declared STC matches are independently Poisson with mean λf. Then, the probabilities that this clone is a problem clone of each type are given as follows:
 |
 |
12 |
 |
Proof
To be a problem I clone requires that there be neither true nor false declared STC matches. Using independence, the result is the probability e−λt that there are no true matches times the probability e−λf that there are no false matches.
To be a problem II clone requires that there be a false STC match and that all true STC matches have greater overlap. Let the random variable X denote the distance to the first event of a Poisson process with mean λt occurrences per unit length. If X < 1, we may interpret m + (C − m + 1)X as the overlap, in base pairs, of the minimum-overlap true declared STC match, whereas if X ≥ 1, there are no true declared matches. Similarly, let Y denote the distance to the first event of a Poisson process with mean λf to represent the minimum-overlap false STC match, if any. Note that X and Y are independent and exponentially distributed with mean 1 / λt and 1 / λf, respectively. Because a problem II clone occurs whenever Y < 1 (so that there exists a false STC match) and Y < X (so that it has smallest overlap), we can calculate
 |
13 |
The probability of being a problem clone can be found by adding the probabilities of problem I and problem II because they are mutually exclusive.
Library Coverage
Using asymptotic results from geometrical probability (Siegel 1979), the number of gaps in the library itself (i.e., ignoring for now any matching errors) follows a Poisson distribution, and the size of each gap follows an exponential distribution.
Theorem 8
The (random) number of bases of the target that are not represented by any clone in the library asymptotically follows a noncentral χ2 distribution with zero degrees of freedom. The expected number of such bases is T[1 − C / T]N ≅ Te−s. These bases are grouped, asymptotically, into an expected number Ne−S of gaps, each containing an expected number T / N of bases per gap.
Proof
These follow directly from Siegel (1979) who derives the asymptotic distribution of the vacancy (i.e., the amount not covered by random arcs on a circle) as a noncentral χ2 distribution with zero degrees of freedom and represents it as the sum of a Poisson number of exponential random variables. The expected number of gaps is the mean of the underlying Poisson random variable.
Footnotes
These sequencing error rates are considerably higher than those currently achievable for substitution errors in single reads but were chosen to improve robsutness of the results to polymorphism (<1%) as well as to encompass insertion and deletion errors (1%–2%) in single reads.
E-MAIL asiegel@u.washington.edu; FAX (206) 685-9392.
REFERENCES
- Chen EY, Schlessinger D, Kere J. Ordered shotgun sequencing, a strategy for integrating mapping and sequencing of YAC clones. Genomics. 1993;17:651–656. doi: 10.1006/geno.1993.1385. [DOI] [PubMed] [Google Scholar]
- Edwards A, Caskey T. Closure strategies for random DNA sequencing. Methods: Companion Methods Enzymol. 1991;3:41–47. [Google Scholar]
- Edwards A, Voss H, Rice P, Civitello A, Stegemann J, Schwager C, Zimmerman J, Erfle H, Caskey T, Ansorge W. Automated DNA sequencing of the human HPRT locus. Genomics. 1990;6:593–608. doi: 10.1016/0888-7543(90)90493-e. [DOI] [PubMed] [Google Scholar]
- Green P. Against a whole-genome shotgun. Genome Res. 1997;7:410–417. doi: 10.1101/gr.7.5.410. [DOI] [PubMed] [Google Scholar]
- Myers E, Weber JL. Is whole genome sequencing feasible? In: Suhai S, editor. Theoretical and computational methods in genome research. New York, NY: Plenum Press; 1997. pp. 73–89. [Google Scholar]
- Richards S, Muzny DM, Civitello DM, Lu F, Gibbs RA. Sequence map gaps and directed reverse sequencing for the completion of large sequencing projects. In: Adams M, Fields C, Venter J, editors. Automated DNA sequencing and analysis. New York, NY: Academic Press; 1994. pp. 191–198. [Google Scholar]
- Roach JC, Boysen C, Wang K, Hood L. Pairwise end sequencing: A unified approach to genomic mapping and sequencing. Genomics. 1995;26:345–353. doi: 10.1016/0888-7543(95)80219-c. [DOI] [PubMed] [Google Scholar]
- Rowen L, Mahairas G, Hood L. Sequencing the human genome. Science. 1997;278:605–607. doi: 10.1126/science.278.5338.605. [DOI] [PubMed] [Google Scholar]
- Saccone S, De Sario A, Wiegant J, Raap AK, Della Valle G, Bernardi G. Correlations between isochores and chromosomal banks in the human genome. Proc Natl Acad Sci. 1993;90:11929–11933. doi: 10.1073/pnas.90.24.11929. [DOI] [PMC free article] [PubMed] [Google Scholar]
- Siegel AF. Asymptotic coverage distribution on the circle. Ann Probab. 1979;7:651–661. [Google Scholar]
- Siegel AF, Roach JC, Magness C, Thayer E, van den Engh G. Optimization of restriction fragment DNA mapping. J Comp Biol. 1998a;1:113–126. doi: 10.1089/cmb.1998.5.113. [DOI] [PubMed] [Google Scholar]
- Siegel AF, Roach JC, van den Engh G. Expectation and variance of true and false fragment matches in DNA restriction mapping. J Comp Biol. 1998b;1:101–111. doi: 10.1089/cmb.1998.5.101. [DOI] [PubMed] [Google Scholar]
- Smith MW, Holmsen AL, Wei YH, Peterson M, Evans GA. Genomic sequence sampling: A strategy for high-resolution sequence-based physical mapping of complex genomes. Nat Genet. 1994;7:40–47. doi: 10.1038/ng0594-40. [DOI] [PubMed] [Google Scholar]
- Venter JC, Smith HO, Hood L. A new strategy for genome sequencing. Nature. 1996;381:364–366. doi: 10.1038/381364a0. [DOI] [PubMed] [Google Scholar]
- Weber JL, Myers EW. Human whole-genome shotgun sequencing. Genome Res. 1997;7:401–409. doi: 10.1101/gr.7.5.401. [DOI] [PubMed] [Google Scholar]
- Wong GK, Yu J, Thayer EC, Olson MV. Multiple complete digest restriction fragment mapping: Generating sequence-ready maps for large-scale DNA sequencing. Proc Natl Acad Sci. 1997;94:5225–5230. doi: 10.1073/pnas.94.10.5225. [DOI] [PMC free article] [PubMed] [Google Scholar]