

Abstract
Defective miRNA biogenesis contributes to the development and progression of epithelial ovarian cancer (EOC). In this study, we examined the hypothesis that single nucleotide polymorphisms (SNPs) in miRNA biogenesis genes may influence EOC risk. In an initial investigation, 318 SNPs in 18 genes were evaluated among 1,815 EOC cases and 1,900 controls, followed up by a replicative joint meta-analysis of data from an additional 2,172 cases and 3,052 controls. Of 23 SNPs from 9 genes associated with risk (empirical P<0.05) in the initial investigation, the meta-analysis replicated 6 SNPs from the DROSHA, FMR1, LIN28, and LIN28B genes, including rs12194974 (G>A), a SNP in a putative transcription factor binding site in the LIN28B promoter region (summary OR=0.90, 95% CI: 0.82–0.98; P=0.015) which has been recently implicated in age of menarche and other phenotypes. Consistent with reports that LIN28B over-expression in EOC contributes to tumorigenesis by repressing tumor suppressor let-7 expression, we provide data from luciferase reporter assays and quantitative RT-PCR to suggest that the inverse association among rs12194974 A allele carriers may be due to reduced LIN28B expression. Our findings suggest that variants in LIN28B and possibly other miRNA biogenesis genes may influence EOC susceptibility.
Keywords: miRNA processing, inherited susceptibility, ovarian cancer, genetic variants
Introduction
Epithelial ovarian cancer (EOC) is an important cause of morbidity and mortality (1). Given that most cases present with advanced, incurable disease, high-risk women should be targeted for primary prevention and early detection. Identification of genetic susceptibility markers may help in this endeavor, and inter-individual differences impacting post-transcriptional regulation is largely unexplored.
MicroRNAs (miRNAs) are a class of evolutionarily conserved 19–25 nucleotide long non-protein encoding RNAs that function as post-transcriptional regulators by binding to the 3’ untranslated region (UTR) of target messenger RNA (mRNA), causing translational inhibition and/or mRNA degradation (2, 3). Ovarian tumors exhibit differential miRNA expression profiles compared to normal tissues (4), and defective miRNA biogenesis may influence miRNA expression, tumorigenesis, and clinical outcomes (2, 5). In EOC, down-regulation of DICER and DROSHA and up-regulation of LIN28 and LIN28B have been associated with altered miRNA levels and reduced patient survival (6–9). SNPs in miRNA biogenesis genes may influence cancer risk by altering miRNA expression (10), and associations between such SNPs and cancer risk have been reported (11–15). While this manuscript was under review, Liang et al. (15) published results on the association between EOC risk and 238 SNPs in 8 miRNA biogenesis genes (DDX20, DGCR8, DICER1, EIF2C1/AGO1, GEMIN4, RAN, RNASEN/DROSHA, and XP05) and miRNA binding sites of 134 cancer-related genes in 339 EOC cases and 349 controls. Six SNPs from 4 miRNA biogenesis genes (DDX20, DROSHA, GEMIN4, and XPO5) were found to be significantly associated with risk (P<0.05) (15).
In the current investigation, we used a two-stage approach to identify alleles in miRNA biogenesis genes that may be associated with EOC risk. In stage 1, the Illumina Infinium 610K array was used to genotype 336 SNPs in 1,815 EOC cases (59% with serous carcinomas) and 1,900 controls of European ancestry. To enhance power to detect true susceptibility loci, we conducted a joint meta-analysis of data from all evaluated SNPs in an additional 2,172 invasive EOC cases (49% with serous carcinomas) and 3,052 controls of European ancestry from 8 studies that are part of the international Ovarian Cancer Association Consortium (OCAC).
Materials and Methods
Participants
Characteristics of participating studies are summarized in Supplementary Table 1. Stage 1 was comprised of four case-control studies (MAY, NCO, TBO, TOR). Cases had incident, pathologically confirmed primary invasive EOC. Controls had at least one ovary intact when interviewed, and were frequency-matched to cases on age-group and race. To increase etiologic homogeneity, we excluded cases with non-epithelial or borderline tumors, non-whites, known BRCA1 and BRCA2 mutation carriers, women of Ashkenazi Jewish background, and women with a prior history of ovarian, breast, endometrial, or early-onset colorectal cancer. The stage 2 replication included eight additional studies from the OCAC whose eligibility criteria have been previously described (16–18). All studies had data on disease status, age at diagnosis/interview, self-reported ethnic group, and histologic subtype. The study protocol was approved by the institutional or ethics review board at each site, and all participants provided written informed consent.
Genotyping
Genomic DNA was extracted from blood, processed and stored using standard procedures. All stage 1 samples were genotyped with the Illumina Infinium 610K Array at the Mayo Clinic Genotyping Shared Resource Facility (Rochester, MN) by laboratory personnel blinded to case-control status. Each 96-well plate contained 375 ng DNA of random mixtures of case and control samples, two blind duplicates, and two replicates of a CEPH family trio (mother, father, child) from the Coriell Institute. A quality assurance (QA) panel of 96 SNPs was run on the Illumina Bead Express platform to test sample performance and ensure concordance of replicate samples. Illumina Genome Studio™ software was used to perform automated clustering and calling for over 550,000 beadtypes. SNPs were excluded from further analysis if a) the call rate was <95%, b) they were monomorphic upon manual clustering, or c) there were unresolved replicate errors. Among 81 pairs of replicate samples, the concordance rate was 99.93%. The overall genotype call rate was 99.7%.
Of 4,150 eligible unique subjects that we attempted to genotype in stage 1, we applied the following exclusions: generation of genotypes at fewer than 95% of loci (n=394), failure on the QA panel (n=15), ambiguous gender (n=7), unresolved identical genotypes (n=8), self-reported non-European ancestry (n=2), or less than 80% European ancestry (n=9) using STRUCTURE (19). This resulted in a final sample size of 3,715 subjects (1,815 cases and 1,900 controls).
As shown in Supplementary Table 1, the second stage replication included the New England Case-Control Study (NEC), the Polish Ovarian Cancer Study (POL), four UK-based collections of EOC cases, and two collections of controls from UK genome-wide association studies of other phenotypes. Genotyping for NEC was performed at the National Institute of Aging (Bethesda, Maryland) with the Illumina 317K and 370K Arrays, and genotyping for POL was performed at the Core Genotyping Facility, SAIC-Frederick, Inc (NCI-Frederick, Maryland) with the Illumina Human 660w-Quad Array. As described previously (16), genotyping for the UK cases was conducted using the Illumina Infinium 610K array at the Illumina Corporation. UK control data comes from the Wellcome Trust Case-Control Consortium 1958 Birth Cohort (20) and a national colorectal control study (21) that used the Illumina 550K array for genotyping. Genotyping quality control procedures for these studies have been described in detail (16).
Identification of candidate miRNA biogenesis genes and SNPs
Genes involved in miRNA biogenesis were identified through a comprehensive PubMed search. A total of 19 genes were selected for evaluation in this investigation: AGO1, AGO2, DCP1, DGCR8, DICER, DROSHA, FMR1, GEMIN3, GEMIN4, GW182, HIWI, LIN28, LIN28B, PACT, RAN, SMAD4, TRBP, TRIM32, and XPO5. A total of 357 SNPs in all but one gene of interest (TRBP) are included on the 610K array and of these 336 (94.1%) had call rates >95%. Three hundred and eighteen of the 336 SNPs had MAF of at least 1% and were included in statistical analyses.
Statistical analyses
Descriptive statistics were generated using frequencies and percents for categorical variables, and means and standard deviations (SD) for continuous variables. Distributions of covariates among cases and controls were compared within each study site using Χ2 tests and t-tests for categorical and continuous variables, respectively. Genotype frequencies among controls were tested for Hardy Weinberg Equilibrium (HWE) using Χ2 goodness-of-fit tests. Statistical analysis was performed using SAS Version 9.1 (SAS Inc., Cary, NC) and PLINK software (22).
To examine associations between each SNP and EOC risk, unconditional logistic regression was used to estimate odds ratios (OR) and 95% confidence intervals (CI). In stage 1, log-additive, dominant, and recessive genetic models were fit for each SNP; the major allele was considered to be the reference allele during modeling. All models were adjusted for age, study site, and a quantitative variable for the first principal component representing European ancestry. Wald Χ2 tests were used to obtain P values for dominant and recessive SNP effects, and the Cochran Armitage trend test was used to estimate P for trend for log-additive effects. For each SNP, the minimum P-value over genetic models was used to represent the best-fitting model. A P value< 0.05 was considered the threshold of significance (as opposed to a P-value ≤10−7 required for genome-wide significance) due to our a priori hypothesis that this subset of SNPs may be associated with EOC risk. Similar to other studies that investigated associations between individual SNPs in miRNA biogenesis genes and cancer risk (11, 12, 14), we did not adjust for multiple comparisons in an effort to minimize false-negatives. However, we permuted case-control status 100,000 times to generate point-wise empirical p-values (EMP1) using PLINK (22). EMP1 represents the proportion of permutations in which the minimum simulated P value was less than the observed P value. Due to the heterogeneous nature of EOC, exploratory subgroup analysis was conducted to estimate genotype-specific odds ratios for serous carcinomas (the most predominant histologic subtype).
For all SNPs evaluated in stage 1, a meta-analysis was performed in PLINK by combining results from log-additive models across studies using the Mantel-Haenszel method for combining raw data (23). Combined ORs, 95% CIs, and P values were generated using fixed-effect and random-effect models. The I2 test of heterogeneity (24) was estimated to quantify the proportion of total variation due to heterogeneity across studies. The R statistical package ‘r-meta’ was used to generate forest plots reporting associations between identified SNPs and EOC risk. Haploview software (v4.1) was used to infer the LD structure in regions containing risk-associated loci (25).
In silico functional assessment of SNPs
The SNPinfo (26) and FastSNP (27) in silico tools were used to predict the functional impact of risk-associated and strongly-correlated SNPs.
Plasmid construction
To evaluate the functional significance of LIN28B rs12194974 (G>A) located 727 bases upstream from the LIN28B transcriptional start site, we generated luciferase reporter constructs by amplifying the 5’ flanking region of LIN28B spanning −1,414 bases upstream of the transcriptional start site to +1,403 bases downstream using previously described methods (28). The amplified fragment was cloned into a pGL3 luciferase reporter vector to generate pGL3-Lin-28B-P2-IRES, which contained the wild-type allele (-727-G), and served as the template for generating the variant construct (-727-A) using the QuikChange site-directed mutagenesis (Agilent Technologies, Inc., Santa Clara, CA). The constructs were verified by DNA sequencing using BigDye Terminator V31.1 Cycle Sequencing Kits and the 3130X Genetic Analyzer (Applied Biosystems, Foster City, CA).
Cell lines and cultures
Ovarian adenocarcinoma (OV420, OV432, CAOV3, SKOV3, OV8, A2780CP, and A2780S) and T80 human immortalized surface epithelial (HIOSE) cells were obtained from ATCC and the University of Pennsylvania, and were cultured at 37°C and 5% CO2. OV8 cells were cultured in RPMI1640, A2780S and A2780CP cells were cultured in DMEM/F12, SKOV3 cells were cultured in McCoy's 5A, and OVCA420, OVCA432, CAOV3, and T80 HIOSE cells were cultured in M199/MCDB105. All the culture media were supplemented with 10% fetal bovine serum (Invitrogen Co., Grand Island, NY).
Reporter gene analysis
Cells were transiently transfected with wild-type and variant LIN28B constructs. The amount of DNA in each transfection was kept constant by the addition of empty vector. After 36 hours of transfection, relative luciferase activity (RLA) was measured using a luciferase assay reagent (Promega, Madison, WI). Transfection efficiency was normalized by co-transfection with a β-galactosidase expressing vector; β-galactosidase activity was measured using Galacto-Light (Tropix, Bedford, MA). RLA was expressed as relative light units or fold change. All experiments were repeated in triplicate. Differences between wild-type and variant LIN28B reporter activity were tested using Student’s t-tests. A two-sided P value of <0.05 was considered statistically significant.
Quantitative RT-PCR
To validate the results from reporter assays, qRT-PCR was used to evaluate mRNA expression of LIN28B exons 1–3 in the context of -727-G or -727-A promoters. Total RNA was isolated from transfected constructs in EOC cell lines A2780CP, and A2780S using Trizol reagents (Invitrogen, Carlsbad, CA). cDNA was prepared from total RNA samples using TaqMan RNA Reverse Transcription kit (Applied Biosystems, Foster City, CA). qRT-PCR was perfomed using TaqMan Universal Polymerase Chain Reaction (PCR) Master mix (Applied Biosystems, Foster City, CA) according to the manufacturer’s protocol. PCR cycling began with template denaturation and hot start Taq polymerase activation at 95°C for 1 min, then 40 cycles of 95°C for 5 sec, and 60°C for 30 sec performed on a 7900HT Fast Real-Time PCR System with data collected during each cycle at the 60°C extension step with 7900HT SDS v2.3 (Applied Biosystems, Foster City, CA). Threshold and baselines were manually determined with thresholds typically set between 0.05 to 0.1 paired with a baseline starting at 1–3 cycle thresholds (Cts) and finishing at 15–17 Cts. Relative LIN28B expression was determined by the delta-delta comparative threshold (ΔΔCt) method with actin. P-values were determined by a two-tailed Student's t test from Ct values for normalization to total RNA.
Results
Despite frequency-matching on age-group, cases were slightly older (60.0 ± 11.6 years) than controls (56.8 ± 12.0 years). As compared to controls, cases tended to have lower education levels, were less likely to have used oral contraceptives (OC), and had longer duration of hormone replacement therapy use (data not shown). The distributions of selected clinical and pathologic characteristics of stage 1 cases are summarized by study site in Supplementary Table 2. Most EOC were of serous histology, were diagnosed at stage III, and were high-grade.
In stage 1, 32 SNPs from 10 of the 18 genes were associated with EOC overall or with serous histology (n=1070) (Supplementary Table 3). Twenty-three SNPs from 9 genes retained statistical significance (point-wise empirical P-value, EMP1<0.05) after permutation testing (Table 1). SNPs within DCP1 (rs2240610 and rs6489338) and DROSHA (rs13186629, rs17404622, and rs2161006) are in linkage disequilibrium (LD) (r2 > 0.80). Of four SNPs in Table 1 that deviated from HWE, all are common (MAF > 0.10) and normal clustering was observed, suggesting genotyping errors were unlikely. Most statistically significant associations were based on a recessive or dominant model and/or the minor allele was inversely associated with risk. The most notable association (EMP1=0.004) with EOC overall was observed with AGO2 rs2176397 (AA genotype versus the AG/GG genotype, OR (95% CI) =0.72 (0.57–0.92)). Sub-group analysis of cases with serous histology revealed trends in association of similar direction and magnitude as the overall analysis (Table 1).
Table 1.
MiRNA Biogenesis SNPs Significantly Associated with Epithelial Ovarian Cancer Risk Overall and/or Serous Carcinoma after Permutation Testing among Stage 1 Participants
| Gene (locus) |
SNP Major*/ Minor Allele |
MAF | Modeld | All subtypes (1815 cases, 1900 controls) |
Serous Carcinomas (1070 cases, 1900 controls) |
||||
|---|---|---|---|---|---|---|---|---|---|
| OR (95% CI)e | Pf | EMP1g | OR (95% CI)e | Ph | EMP1i | ||||
| AGO2 (8q24.3) | rs11996715a(A/C) | 0.48 | R | 0.85 (0.73–0.99) | 0.043 | 0.027 | 0.80 (0.66–0.96) | 0.018 | 0.019 |
| rs2176397 (G/A) | 0.30 | R | 0.72 (0.57–0.92) | 0.008 | 0.004 | 0.80 (0.60–1.05) | 0.112 | 0.078 | |
| rs3864659 (A/C) | 0.11 | R | 2.53 (1.38–4.65) | 0.003 | 0.005 | 2.10 (1.04–4.21) | 0.038 | 0.037 | |
| DCP1 (12p13.33) | rs10505725 (G/A) | 0.28 | R | 1.24 (0.98–1.58) | 0.078 | 0.095 | 1.40 (1.07–1.83) | 0.015 | 0.013 |
| rs2240610b(A/G) | 0.49 | D | 0.83 (0.71–0.96) | 0.012 | 0.019 | 0.86 (0.72–1.02) | 0.090 | 0.149 | |
| rs6489338b(G/A) | 0.46 | R | 1.20 (1.02–1.40) | 0.025 | 0.022 | 1.11 (0.92–1.33) | 0.284 | 0.329 | |
| DICER (14q32.13) | rs1110386a(G/A) | 0.22 | R | 1.53 (1.12–2.09) | 0.008 | 0.017 | 1.31 (0.90–1.90) | 0.159 | 0.220 |
| rs11621737 (G/A) | 0.24 | R | 0.71 (0.53–0.95) | 0.022 | 0.017 | 0.65 (0.45–0.92) | 0.016 | 0.018 | |
| rs2353726a(G/A) | 0.43 | R | 0.85 (0.72–1.01) | 0.059 | 0.042 | 0.80 (0.65–0.98) | 0.028 | 0.037 | |
| DROSHA (5p13.3) | rs10067066 (A/G) | 0.07 | R | 2.57 (1.04–6.35) | 0.040 | 0.037 | 3.44 (1.34–8.82) | 0.010 | 0.002 |
| rs13186629c(G/A) | 0.40 | A | 0.90 (0.82–0.99) | 0.027 | 0.029 | 0.90 (0.80–1.00) | 0.058 | 0.189 | |
| rs17404622c(A/G) | 0.37 | A | 0.90 (0.82–0.99) | 0.034 | 0.036 | 0.90 (0.80–1.01) | 0.060 | 0.155 | |
| rs2161006c(G/A) | 0.37 | A | 0.90 (0.81–0.99) | 0.028 | 0.030 | 0.90 (0.80–1.01) | 0.062 | 0.158 | |
| rs6450839 (G/A) | 0.30 | D | 1.16 (1.01–1.32) | 0.032 | 0.031 | 1.20 (1.03–1.40) | 0.020 | 0.019 | |
| FMR1 (Xq27.3) | rs25704 (G/A) | 0.23 | A | 1.12 (1.01–1.25) | 0.041 | 0.026 | 1.05 (0.92–1.20) | 0.437 | 0.259 |
| LIN28 (1p36.11) | rs11247946 (A/G) | 0.34 | R | 1.25 (1.02–1.52) | 0.029 | 0.010 | 1.28 (1.02–1.60) | 0.037 | 0.005 |
| rs11581746 (A/G) | 0.19 | D | 0.87 (0.75–1.00) | 0.047 | 0.036 | 0.92 (0.78–1.08) | 0.294 | 0.170 | |
| rs12728900 (G/A) | 0.26 | A | 0.86 (0.77–0.96) | 0.008 | 0.007 | 0.85 (0.75–0.97) | 0.015 | 0.011 | |
| rs6598964 (G/A) | 0.36 | R | 1.26 (1.04–1.53) | 0.017 | 0.004 | 1.17 (0.93–1.46) | 0.179 | 0.026 | |
| LIN28B (6q16.3-q21) | rs12194974 (G/A) | 0.15 | A | 0.84 (0.74–0.97) | 0.015 | 0.015 | 0.84 (0.72–0.99) | 0.037 | 0.026 |
| rs17065417 (A/C) | 0.09 | D | 1.23 (1.04–1.46) | 0.018 | 0.016 | 1.24 (1.02–1.51) | 0.034 | 0.035 | |
| PACT (2q31.2) | rs2059691a(G/A) | 0.30 | R | 0.77 (0.61–0.97) | 0.028 | 0.044 | 0.77 (0.59–1.01) | 0.062 | 0.092 |
| SMAD4 (18q21.1) | rs948588 (G/A) | 0.08 | R | 2.80 (1.22–6.40) | 0.015 | 0.006 | 2.27 (0.88–5.91) | 0.092 | 0.055 |
Abbreviations: MAF=minor allele frequency in controls; OR (CI) = Odds ratio (confidence interval);
The major allele represents the most frequently-occurring allele and serves as the reference allele during modeling.
SNPs deviating from Hardy Weinberg Equilibrium among controls (PHWE <0.05), with PHWE values for AGO2 rs11996715, DICER rs1110386 and rs2353726, and PACT rs2059691 of 0.009, 0.007, 0.013, and 0.007, respectively.
SNP pair in linkage disequilibrium (LD) (r2=0.93);
SNP pair in LD (0.97≥r2≥0.99);
Best-fitting genetic model (A = Log-additive; D = Dominant; R = Recessive);
OR and 95% CI adjusted for age, study site, and the first principal component for European ancestry;
Wald test P-value for testing genetic effects related to overall ovarian cancer risk before permutation testing.
Empirical point-wise P-value for testing genetic effects related to overall ovarian cancer risk;
Wald test P-value for testing the genetic effects related to serous carcinoma risk before permutation testing.
Empirical point-wise P-value for testing the genetic effects related to serous carcinoma risk; Statistically significant P and EMP1-values (< 0.05) are in bold type. All P-values are two-sided.
The joint meta-analysis included data from a total of 3,987 EOC cases (2,135 serous carcinomas) and 4,952 controls (Supplementary Table 1). Point estimates and confidence intervals were similar under fixed-effects and random-effects models (data not shown), suggesting minimal between-study heterogeneity. Under a fixed-effects model, the association for 6 SNPs demonstrated evidence for replication (Figure 1). The strongest associations were observed for DROSHA rs13186629, rs2161006 and rs17404622, three SNPs in high LD (0.97≤r2≤0.99) that flank the 3’UTR of the gene and map to a 17kb region of LD within 5p13.3 (Supplementary Figure 1A). rs13186629 showed the strongest evidence of association in this region, with a summary OR of 1.09 (95% CI: 1.02–1.16, P =0.008, I2 =0%). The next strongest association was with LIN28B rs12194974 (summary OR=0.90, 95% CI: 0.82–0.98, P=0.015, I2 =21.8%), a SNP flanking the 5’UTR of LIN28B (Supplementary Figure 1B). We also observed statistically significant associations for rs25704, a SNP in the 3’UTR of the X-linked FMR1 gene (summary OR=1.12, 95% CI: 1.02–1.24, P =0.020, I2 =0%) (Supplementary Figure 1C), and for intronic SNP LIN28 rs12728900 (summary OR=0.93, 95% CI: 0.86–0.99, P =0.031, I2 =24.3%) (Supplementary Figure 1D).
Figure 1.
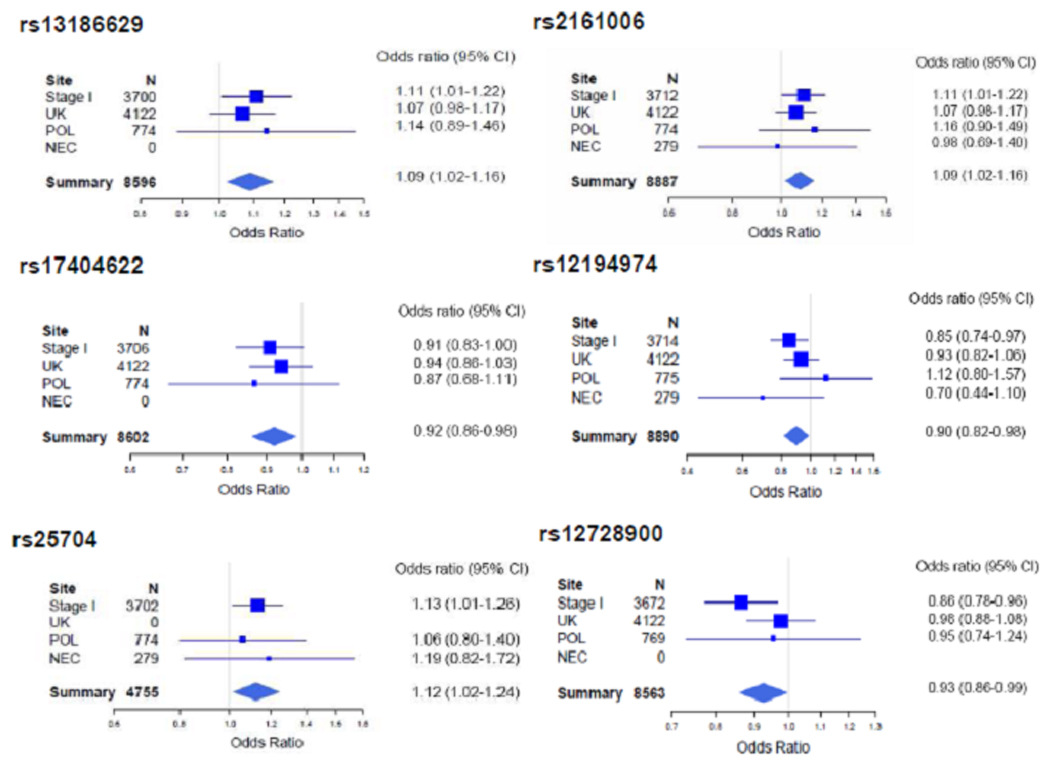
Forest Plots for the Six SNPs Associated with Epithelial Ovarian Cancer Risk in the Joint Meta-analysis. Boxes denote OR point estimates, their areas being proportional to the inverse variance weight of the estimate. Horizontal lines represent 95% CIs. The diamond represents the summary OR computed under a fixed-effects model. The vertical line is at the null value (OR=1.0).
To predict the possible functional relevance of risk-associated and strongly correlated SNPs (r2>0.80) listed in Supplementary Table 4, we used the SNPInfo (26) and FastSNP (27) in silico tools; results suggest that 29 of these 78 SNPs are predicted to influence gene expression. Of the SNPs with evidence for statistical significance in the replication stage, the DROSHA tagSNPs have no known function, rs12194974 is predicted by SNPinfo to reside in a transcription factor binding site (TFBS) in the highly conserved LIN28B promoter, FMR1 rs25704 is located in a putative miRNA-binding site according to SNPinfo, and LIN28 rs12728900 is predicted by FastSNP to be an intronic enhancer. Of particular interest is the LIN28B rs12194974 SNP because transcription factors (TF) predicted to bind there include PPARG (peroxisome proliferator-activated receptor gamma), YY1 (yin yang 1), and PAX2 (paired box gene 2), each of which have been implicated in ovarian carcinogenesis (29–31). Based on evidence that LIN28B/LIN28 over-expression negatively regulates biogenesis of let-7, a known tumor suppressor miRNA family frequently down-regulated in EOC and other malignancies (8, 28, 32), we hypothesized that variation in the promoter may affect how TFs activate or repress LIN28B activity, ultimately affecting the level or timing of LIN28B and let-7 expression.
We explored the functional significance of rs12194974 by constructing LIN28B G>A reporters, which contain the first 3 exons of LIN28B following IRES and the luciferase gene (Figure 2A). Luciferase reporter assay was used to measure promoter activities of wild-type (-727-G) and variant (-727-A) constructs in eight cell lines. EOC cells transfected with -727-A had 30–84% lower relative luciferase activity (RLA) than the common -727-G reporter (P<0.05); Figure 2B). Real time RT-PCR of exons 1–3 of LIN28B confirmed 24–29% reduced relative mRNA LIN28B expression of -727-A compared to -727-G (Figure 2C). These results suggest the A allele has lower promoter activity which leads to downregulation of LIN28B.
Figure 2.
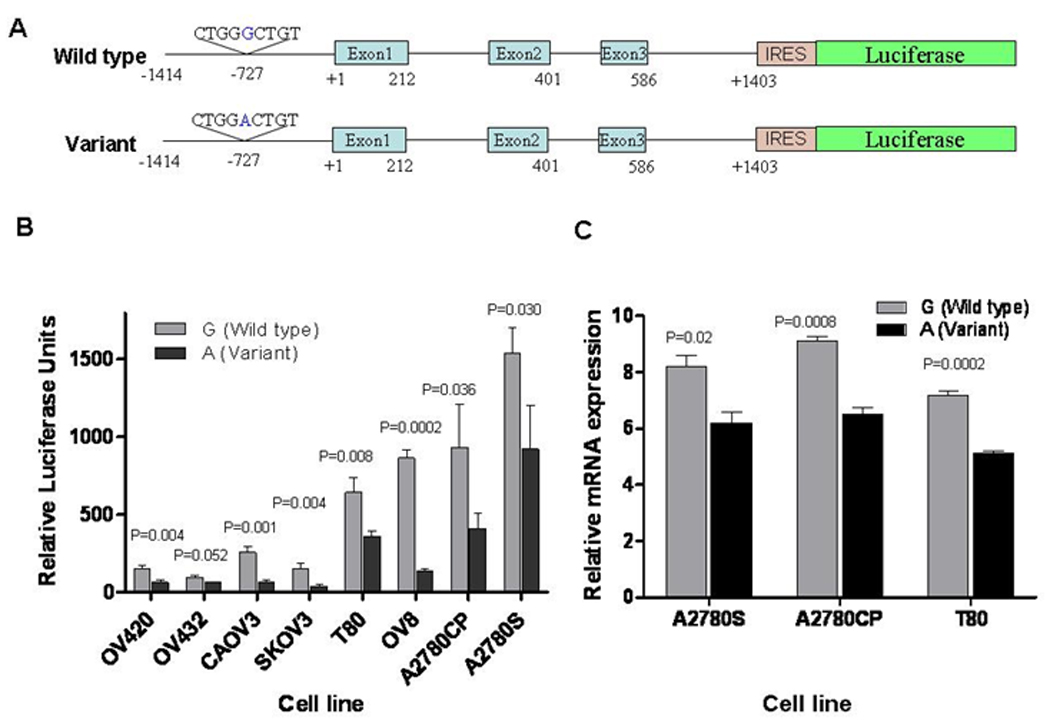
Functional Analysis of the LIN28B rs12194974 (-727 G/A) Polymorphism in vitro. A. Schematic representation of the LIN28B luciferase Reporter which contains an 1.4-kb promoter and 3 exons of LIN28B following IRES and luciferase gene. B. LIN28B SNP Promoter Activity in Ovarian Cancer Cell Lines. The -727-G and -727-A allele constructs were transfected into OV420, OV432, CAOV3, SKOV3, OV8, A2780CP, and A2780S ovarian adenonocarcinoma cell lines and T80 human immortalized ovarian surface epithelial cell line (HIOSE). β-galactosidase was used to standardize transfection efficiency. Relative luciferase activity (RLA) was measured. RLA units are presented as means, and the T bars represent standard deviations (SD). Mean ± SD from triplicates. Statistical analysis was conducted using Student’s t test. C. LIN28B SNP mRNA Expression in Ovarian Cancer Cell Lines and Immortalized Cell Line. The -727-G and -727-A allele constructs were transfected into A2780CP and A2780S and the T80 human cells. LIN28B SNP mRNA expression was determined by real-time PCR, and normalized with β-actin.
Discussion
This study examined whether inherited variants in miRNA biogenesis genes contribute to EOC risk by integrating multiple lines of evidence, including statistical, in silico, biological, and functional data. Consistent with results from Liang et al (15), we identified SNPs within or near DROSHA as being associated with EOC risk, but we did not identify SNPs in genes evaluated in both studies (AGO1, DGCR8, GEMIN4, RAN, and XPO5) as risk-associated in our much larger study population. Our findings are noteworthy because several candidate genes highlighted here (LIN28, LIN28B, DROSHA, DICER, AGO2) have been implicated in ovarian carcinogenesis (6–9, 33, 34). Importantly, associations identified with LIN28/LIN28B have biologic relevance because these genes are over-expressed in advanced stage EOC and may contribute to tumorigenesis by repressing let-7 and upregulating let-7 target oncogenes KRAS and MYC (8, 28). Indeed, a study of 211 EOC tumors showed high LIN28B expression, low let-7a, and high IGF-II were correlated with a poorer prognosis compared to tumors with low LIN28B expression (9), consistent with a role for LIN28B in tumor growth (35).
Our meta-analytic results, which were largely influenced by stage 1, provided evidence of a reduced risk of EOC with the A allele of rs12194974, a variant that we demonstrated experimentally reduces LIN28B transcriptional activity and LIN28B mRNA expression. Due to the low frequency of the rs12194974 A allele, we have not been able to identify human cancer cell lines that harbor this variant, limiting functional analyses. As such, future studies involving knock-in of the rs12194974 A allele into the LIN28B gene may be warranted to evaluate LIN28B expression. Taken together, SNPs in LIN28B may serve as biomarkers of risk, and given the role of LIN28B in stem cell renewal, disrupting its function in tumors where it is over-expressed may promote let-7 expression and therapeutic benefit (8, 9). Interestingly, polymorphisms within LIN28B may also influence the reproductive lifespan and human growth, as SNPs residing in the same LD block as rs12194974 (Supplementary Figure 1B) have been associated with age at menarche, timing of puberty, height, and finger-length ratio (36–40).
Major strengths of our study include the large sample size, the quality control measures put into place to generate high quality genotype data, and the procedures used to ensure a genetically homogeneous study population of women with European ancestry (i.e. strict inclusion/exclusion criteria and assessment of population substructure). Furthermore, this represents the first report involving miRNA biogenesis SNPs and cancer risk to follow-up on observed associations by conducting a joint meta-analysis and incorporating functional data. Since we did not adjust for multiple comparisons, our findings should be considered suggestive that inherited variants in miRNA biogenesis genes, particularly LIN28B, affect EOC risk. Future studies may involve fine mapping of the highlighted regions of interest using data from the 1000 Genomes Project. Efforts are also underway to replicate the most promising associations reported herein in the OCAC, and to evaluate variants that may impact miRNA primary transcripts or miRNA-target interactions. Knowledge of inherited variation in miRNA-related genes may help to identify high-risk populations and aid in the development of diagnostic, prognostic, and therapeutic strategies for EOC and likely other cancers.
Supplementary Material
Acknowledgements and Grant Support
We thank all of the individuals who participated in this research along with all of the researchers, clinicians, and staff who have contributed to the participating studies. The genotyping, bioinformatic and biostatistical data analysis for stage 1 was supported by R01-CA-114343 and R01-CA114343-S1 and the Moffitt Cancer Center/University of South Florida Anna Valentine Fund and Cancer Center Support Grant P30-CA0762-92. The MAY study is supported by R01-CA-122443 and P50-CA-136393 and funding from the Mayo Foundation. The NCO study is supported by R01-CA-76016. The TBO study is supported by R01-CA-106414, the American Cancer Society (CRTG-00-196-01-CCE), and the Advanced Cancer Detection Center Grant, Department of Defense (DAMD-17-98-1-8659). The TOR study is supported by grants from the Canadian Cancer Society and the National Institutes of Health (R01-CA-63682 and R01-CA-63678). The Mayo Clinic Genotyping Shared Resource is supported by the National Cancer Institute (P30-CA-15083).
Of studies that participated in stage 2, the NEC study is supported by grants CA-54419 and P50 CA105009. The POL study was supported by the Intramural Research Program of the NIH, National Cancer Institute, Division of Cancer Epidemiology and Genetics, and the Center for Cancer Research. The SEA study is funded by a program grant from Cancer Research UK. The UKO study is supported by funding from Cancer Research UK, the Eve Appeal, and the OAK Foundation; some of this work was undertaken at UCLH/UCL who received some funding from the Department of Health's NIHR Biomedical Research Centre funding scheme. UK genotyping and data analysis was supported by a project grant from Cancer Research UK. UK studies also make use of data generated by the Wellcome Trust Case-Control consortium. A list of investigators who contributed to the generation of data is available at www.wtccc.org.uk.
Footnotes
REFERENCES
- 1.American Cancer Society. Cancer Facts and Figures 2010. Atlanta: American Cancer Society; 2010. [Google Scholar]
- 2.Calin GA, Croce CM. MicroRNA signatures in human cancers. Nat Rev Cancer. 2006;6:857–866. doi: 10.1038/nrc1997. [DOI] [PubMed] [Google Scholar]
- 3.Winter J, Jung S, Keller S, Gregory RI, Diederichs S. Many roads to maturity: microRNA biogenesis pathways and their regulation. Nat Cell Biol. 2009;11:228–234. doi: 10.1038/ncb0309-228. [DOI] [PubMed] [Google Scholar]
- 4.Li SD, Zhang JR, Wang YQ, Wan XP. The role of microRNAs in ovarian cancer initiation and progression. J Cell Mol Med. 2010 doi: 10.1111/j.1582-4934.2010.01058.x. [DOI] [PMC free article] [PubMed] [Google Scholar]
- 5.Kumar MS, Lu J, Mercer KL, Golub TR, Jacks T. Impaired microRNA processing enhances cellular transformation and tumorigenesis. Nat Genet. 2007;39:673–677. doi: 10.1038/ng2003. [DOI] [PubMed] [Google Scholar]
- 6.Faggad A, Budczies J, Tchernitsa O, Darb-Esfahani S, Sehouli J, Muller BM, et al. Prognostic significance of Dicer expression in ovarian cancer-link to global microRNA changes and oestrogen receptor expression. J Pathol. 2009 doi: 10.1002/path.2658. [DOI] [PubMed] [Google Scholar]
- 7.Merritt WM, Lin YG, Han LY, Kamat AA, Spannuth WA, Schmandt R, et al. Dicer, Drosha, and outcomes in patients with ovarian cancer. N Engl J Med. 2008;359:2641–2650. doi: 10.1056/NEJMoa0803785. [DOI] [PMC free article] [PubMed] [Google Scholar]
- 8.Viswanathan SR, Powers JT, Einhorn W, Hoshida Y, Ng TL, Toffanin S, et al. Lin28 promotes transformation and is associated with advanced human malignancies. Nat Genet. 2009;41:843–848. doi: 10.1038/ng.392. [DOI] [PMC free article] [PubMed] [Google Scholar]
- 9.Lu L, Katsaros D, Shaverdashvili K, Qian B, Wu Y, de la Longrais IA, et al. Pluripotent factor lin-28 and its homologue lin-28b in epithelial ovarian cancer and their associations with disease outcomes and expression of let-7a and IGF-II. Eur J Cancer. 2009;45:2212–2218. doi: 10.1016/j.ejca.2009.05.003. [DOI] [PubMed] [Google Scholar]
- 10.Ryan BM, Robles AI, Harris CC. Genetic variation in microRNA networks: the implications for cancer research. Nat Rev Cancer. 2010;10:389–402. doi: 10.1038/nrc2867. [DOI] [PMC free article] [PubMed] [Google Scholar]
- 11.Clague J, Lippman SM, Yang H, Hildebrandt MA, Ye Y, Lee JJ, et al. Genetic variation in MicroRNA genes and risk of oral premalignant lesions. Mol Carcinog. 2009 doi: 10.1002/mc.20588. [DOI] [PMC free article] [PubMed] [Google Scholar]
- 12.Horikawa Y, Wood CG, Yang H, Zhao H, Ye Y, Gu J, et al. Single Nucleotide Polymorphisms of microRNA Machinery Genes Modify the Risk of Renal Cell Carcinoma. Clin Cancer Res. 2008;14:7956–7962. doi: 10.1158/1078-0432.CCR-08-1199. [DOI] [PMC free article] [PubMed] [Google Scholar]
- 13.Yang H, Dinney CP, Ye Y, Zhu Y, Grossman HB, Wu X. Evaluation of genetic variants in microRNA-related genes and risk of bladder cancer. Cancer Res. 2008;68:2530–2537. doi: 10.1158/0008-5472.CAN-07-5991. [DOI] [PubMed] [Google Scholar]
- 14.Ye Y, Wang K, Gu J, Yang H, Lin J, Ajani J, Wu X. Genetic variations in MicroRNA-Related Genes are Novel Susceptibility Loci for Esophageal Cancer Risk. Cancer Prev Res. 2008;1:460–469. doi: 10.1158/1940-6207.CAPR-08-0135. [DOI] [PMC free article] [PubMed] [Google Scholar]
- 15.Liang D, Meyer L, Chang DW, Lin J, Pu X, Ye Y, et al. Genetic variants in MicroRNA biosynthesis pathways and binding sites modify ovarian cancer risk, survival, and treatment response. Cancer Res. 2010;70:9765–9776. doi: 10.1158/0008-5472.CAN-10-0130. [DOI] [PMC free article] [PubMed] [Google Scholar]
- 16.Song H, Ramus SJ, Tyrer J, Bolton KL, Gentry-Maharaj A, Wozniak E, et al. A genome-wide association study identifies a new ovarian cancer susceptibility locus on 9p22.2. Nat Genet. 2009;41:996–1000. doi: 10.1038/ng.424. [DOI] [PMC free article] [PubMed] [Google Scholar]
- 17.Terry KL, De Vivo I, Titus-Ernstoff L, Sluss PM, Cramer DW. Genetic variation in the progesterone receptor gene and ovarian cancer risk. Am J Epidemiol. 2005;161:442–451. doi: 10.1093/aje/kwi064. [DOI] [PMC free article] [PubMed] [Google Scholar]
- 18.Garcia-Closas M, Brinton LA, Lissowska J, Richesson D, Sherman ME, Szeszenia-Dabrowska N, et al. Ovarian cancer risk and common variation in the sex hormone-binding globulin gene: a population-based case-control study. BMC Cancer. 2007;7:60. doi: 10.1186/1471-2407-7-60. [DOI] [PMC free article] [PubMed] [Google Scholar]
- 19.Price AL, Patterson NJ, Plenge RM, Weinblatt ME, Shadick NA, Reich D. Principal components analysis corrects for stratification in genome-wide association studies. Nat Genet. 2006;38:904–909. doi: 10.1038/ng1847. [DOI] [PubMed] [Google Scholar]
- 20.Genome-wide association study of 14,000 cases of seven common diseases and 3,000 shared controls. Nature. 2007;447:661–678. doi: 10.1038/nature05911. [DOI] [PMC free article] [PubMed] [Google Scholar]
- 21.Houlston RS, Webb E, Broderick P, Pittman AM, Di Bernardo MC, Lubbe S, et al. Meta-analysis of genome-wide association data identifies four new susceptibility loci for colorectal cancer. Nat Genet. 2008;40:1426–1435. doi: 10.1038/ng.262. [DOI] [PMC free article] [PubMed] [Google Scholar]
- 22.Purcell S, Neale B, Todd-Brown K, Thomas L, Ferreira MA, Bender D, et al. PLINK: a tool set for whole-genome association and population-based linkage analyses. Am J Hum Genet. 2007;81:559–575. doi: 10.1086/519795. Available at: http://pngu.mgh.harvard.edu/~purcell/plink/ [DOI] [PMC free article] [PubMed] [Google Scholar]
- 23.Petitti D. Meta-analysis Decision Analysis and Cost-Effectiveness Analysis. Oxford, New York, Oxford: 1994. [Google Scholar]
- 24.Higgins JP, Thompson SG. Quantifying heterogeneity in a meta-analysis. Stat Med. 2002;21:1539–1558. doi: 10.1002/sim.1186. [DOI] [PubMed] [Google Scholar]
- 25.Barrett JC, Fry B, Maller J, Daly MJ. Haploview: analysis and visualization of LD and haplotype maps. Bioinformatics. 2005;21:263–265. doi: 10.1093/bioinformatics/bth457. Avaliable at: http://www.broad.mit.edu/personal/jcbarret/haploview/ [DOI] [PubMed] [Google Scholar]
- 26.Xu Z, Taylor JA. SNPinfo: integrating GWAS and candidate gene information into functional SNP selection for genetic association studies. Nucleic Acids Res. 2009;37:W600–W605. doi: 10.1093/nar/gkp290. Available at: http://manticore.niehs.nih.gov/ [DOI] [PMC free article] [PubMed] [Google Scholar]
- 27.Yuan HY, Chiou JJ, Tseng WH, Liu CH, Liu CK, Lin YJ, et al. FASTSNP: an always up-to-date and extendable service for SNP function analysis and prioritization. Nucleic Acids Res. 2006;34:W635–W641. doi: 10.1093/nar/gkl236. Available at: http://fastsnp.ibms.sinica.edu/tw/ [DOI] [PMC free article] [PubMed] [Google Scholar]
- 28.Chang TC, Zeitels LR, Hwang HW, Chivukula RR, Wentzel EA, Dews M, et al. Lin-28B transactivation is necessary for Myc-mediated let-7 repression and proliferation. Proc Natl Acad Sci U S A. 2009;106:3384–3389. doi: 10.1073/pnas.0808300106. [DOI] [PMC free article] [PubMed] [Google Scholar]
- 29.Yang YC, Tsao YP, Ho TC, Choung IP. Peroxisome proliferator-activated receptor-gamma agonists cause growth arrest and apoptosis in human ovarian carcinoma cell lines. Int J Gynecol Cancer. 2007;17:418–425. doi: 10.1111/j.1525-1438.2006.00866.x. [DOI] [PubMed] [Google Scholar]
- 30.Matsumura N, Huang Z, Baba T, Lee PS, Barnett JC, Mori S, et al. Yin yang 1 modulates taxane response in epithelial ovarian cancer. Mol Cancer Res. 2009;7:210–220. doi: 10.1158/1541-7786.MCR-08-0255. [DOI] [PMC free article] [PubMed] [Google Scholar]
- 31.Muratovska A, Zhou C, He S, Goodyer P, Eccles MR. Paired-Box genes are frequently expressed in cancer and often required for cancer cell survival. Oncogene. 2003;22:7989–7997. doi: 10.1038/sj.onc.1206766. [DOI] [PubMed] [Google Scholar]
- 32.Yang N, Kaur S, Volinia S, Greshock J, Lassus H, Hasegawa K, et al. MicroRNA microarray identifies Let-7i as a novel biomarker and therapeutic target in human epithelial ovarian cancer. Cancer Res. 2008;68:10307–10314. doi: 10.1158/0008-5472.CAN-08-1954. [DOI] [PMC free article] [PubMed] [Google Scholar]
- 33.Nowee ME, Snijders AM, Rockx DA, de Wit RM, Kosma VM, Hamalainen K, et al. DNA profiling of primary serous ovarian and fallopian tube carcinomas with array comparative genomic hybridization and multiplex ligation-dependent probe amplification. J Pathol. 2007;213:46–55. doi: 10.1002/path.2217. [DOI] [PubMed] [Google Scholar]
- 34.Pampalakis G, Diamandis EP, Katsaros D, Sotiropoulou G. Down-regulation of dicer expression in ovarian cancer tissues. Clin Biochem. 2010;43:324–327. doi: 10.1016/j.clinbiochem.2009.09.014. [DOI] [PubMed] [Google Scholar]
- 35.Guo Y, Chen Y, Ito H, Watanabe A, Ge X, Kodama T, et al. Identification and characterization of lin-28 homolog B (LIN28B) in human hepatocellular carcinoma. Gene. 2006;384:51–61. doi: 10.1016/j.gene.2006.07.011. [DOI] [PubMed] [Google Scholar]
- 36.Ong KK, Elks CE, Li S, Zhao JH, Luan J, Andersen LB, et al. Genetic variation in LIN28B is associated with the timing of puberty. Nat Genet. 2009;41:729–733. doi: 10.1038/ng.382. [DOI] [PMC free article] [PubMed] [Google Scholar]
- 37.He C, Kraft P, Chen C, Buring JE, Pare G, Hankinson SE, et al. Genome-wide association studies identify loci associated with age at menarche and age at natural menopause. Nat Genet. 2009;41:724–728. doi: 10.1038/ng.385. [DOI] [PMC free article] [PubMed] [Google Scholar]
- 38.Lettre G, Jackson AU, Gieger C, Schumacher FR, Berndt SI, Sanna S, et al. Identification of ten loci associated with height highlights new biological pathways in human growth. Nat Genet. 2008;40:584–591. doi: 10.1038/ng.125. [DOI] [PMC free article] [PubMed] [Google Scholar]
- 39.Medland SE, Zayats T, Glaser B, Nyholt DR, Gordon SD, Wright MJ, et al. A variant in LIN28B is associated with 2D:4D finger-length ratio, a putative retrospective biomarker of prenatal testosterone exposure. Am J Hum Genet. 2010;86:519–525. doi: 10.1016/j.ajhg.2010.02.017. [DOI] [PMC free article] [PubMed] [Google Scholar]
- 40.Sulem P, Gudbjartsson DF, Rafnar T, Holm H, Olafsdottir EJ, Olafsdottir GH, et al. Genome-wide association study identifies sequence variants on 6q21 associated with age at menarche. Nat Genet. 2009;41:734–738. doi: 10.1038/ng.383. [DOI] [PubMed] [Google Scholar]
Associated Data
This section collects any data citations, data availability statements, or supplementary materials included in this article.