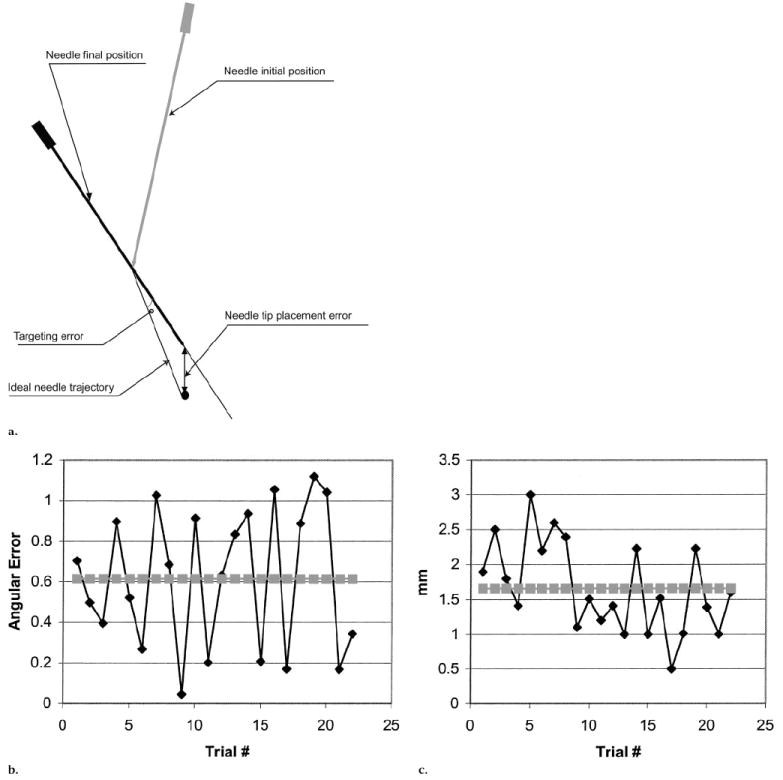
Figure 2.

(a)Diagram shows the needle at its initial position and at its final position. The error in trajectory is given by the angle, in degrees, from the ideal trajectory to the final trajectory. The overall error is the distance from the needle tip at the final position to the target. (b) The angular error (◆), which indicates the difference between the ideal trajectory and the robot-chosen trajectory, is given for each of the 22 individual attempts. An average error (■) is then plotted. (c) The distance between the final needle tip position and the target (tip-target error [◆]) is plotted for each of the 22 individual attempts. The tip-target average error (■) is also graphed.
