

Abstract
We present the Human Muscle Gene Map (HMGM), the first comprehensive and updated high-resolution expression map of human skeletal muscle. The 1078 entries of the map were obtained by merging data retrieved from UniGene with the RH mapping information on 46 novel muscle transcripts, which showed no similarity to any known sequence. In the map, distances are expressed in megabase pairs. About one-quarter of the map entries represents putative novel genes. Genes known to be specifically expressed in muscle account for <4% of the total. The genomic distribution of the map entries confirmed the previous finding that muscle genes are selectively concentrated in chromosomes 17, 19, and X. Five chromosomal regions are suspected to have a significant excess of muscle genes. Present data support the hypothesis that the biochemical and functional properties of differentiated muscle cells may result from the transcription of a very limited number of muscle-specific genes along with the activity of a large number of genes, shared with other tissues, but showing different levels of expression in muscle.
[The sequence data described in this paper have been submitted to the EMBL data library under accession nos. F23198–F23242.]
In the last few years the identification of ESTs has resulted in an unprecedented development of human molecular genetics. However, little attention has so far been paid to the building of single-tissue expression maps, if we exclude a few tissue-specific ESTs databases: LENS (Linking ESTs and their associated Name Space, http://agave.humgen.upenn.edu/lens), Human Gene Index at TIGR (http://www.tigr.org/tdb/hgi/searching/hgi_xpress_search.html), BodyMap (http://www.imcb.osaka-u.ac.jp/bodymap/welcome.html), and sporadic attempts to construct low-resolution genomic maps (Polymeropoulos et al. 1993; Hwang et al. 1997) or transcript maps of individual chromosomal regions (Callen et al. 1995; Yaspo et al. 1995; Jensen et al. 1997).
Tissue-specific genomic transcript maps are needed, because they might reveal the existence of chromosomal regions characterized by specific transcriptional activity, thus shedding light on the rules governing tissue differentiation. In addition, these maps may provide powerful tools for a variety of studies, ranging from the “cyberscreening” of cDNA libraries to the positional cloning of disease-genes. In particular, 44 inherited disorders of skeletal muscle might benefit from this new approach, because their map position has been defined, but the corresponding DNA sequence is still unknown.
We recently produced a preliminary transcript map of human skeletal muscle, based on 509 different transcripts from a cDNA library produced in our laboratory, showing that some chromosomes might be richer in muscle genes than expected (Pallavicini et al. 1997).
With the present work we have built a second-generation, high-resolution expression map, by integration of data from UniGene (Boguski and Schuler 1995) with additional data recently obtained from our skeletal muscle cDNA library. This map, anchored on the framework of markers provided by the Location Data Base (LDB) (Collins et al. 1996), should enable the investigation of the possible nonrandom chromosomal and subchromosomal distribution of genes expressed in skeletal muscle.
RESULTS
Among the adult muscle libraries available in UniGene, we selected the three most abundant in sequences (no. 500, no. 272, and no. 24). Fetal muscle and rhabdomyosarcoma libraries were excluded from this study. The library referred to as no. 500 in UniGene corresponds to a part of a larger skeletal muscle cDNA library available in our laboratory. The entries of this local library reported in UniGene can be found in the EMBL database under the acronym HSPD (Human Sequence of Padua Database). The database including all the sequences produced in our laboratory is accessible on-line at the Web site GRUP (http://eos.bio.unipd.it).
The total number of nonredundant individual transcripts obtained from libraries no. 500, no. 272, and no. 24 was 1778. Among them, 1032 showed a precise, unique map localization (58% of the total). Three hundred and fifty-one transcripts were obtained from library no. 500, accounting for 34% of the mapped entries.
Forty-six additional transcripts showing no match with any of the known sequences were recently obtained from our human skeletal muscle cDNA library. They were mapped by the radiation hybrid (RH) method. Table 1 reports the list of the corresponding ESTs, along with their relative PCR primers and their resulting map positions. The mapping information on ESTs corresponding to these novel transcripts was then added to the mapping data of the 1032 retrieved UniGene clusters, giving rise to a final set of 1078 map entries.
Table 1.
List of 46 Novel HSPD Transcript
| EST | Forward primer sequence | Reverse primer sequence | Ampl. product length (bp) | Chr. | Mb from p-tel |
|---|---|---|---|---|---|
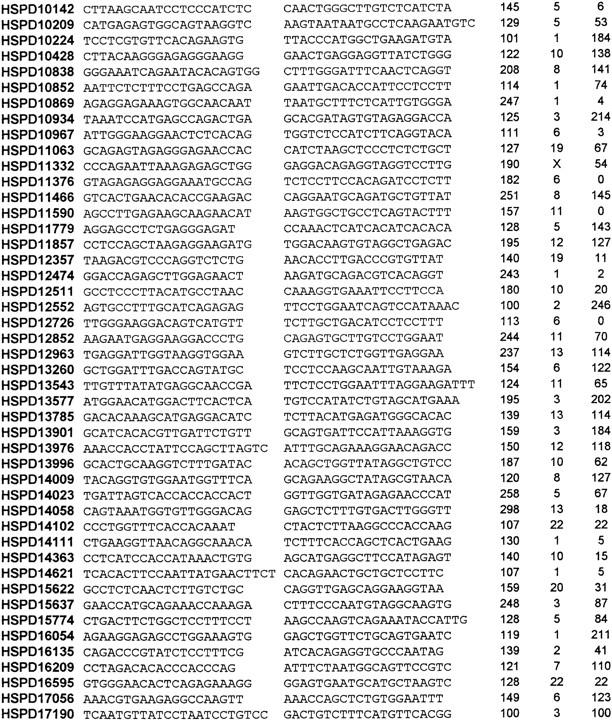 | |||||
These ESTs were obtained from skeletal muscle cDNA library No. 500 and showed no match with any DNA sequence so far reported. They are listed together with their forward and reverse amplification primers, the length of the amplification product (in bp), and their respective map position (chromosome no. and Mb distance from the top).
From this new data set, we produced a transcript map of the human skeletal muscle tissue, named HMGM (Human Muscle Gene Map). Each gene was assigned to its chromosomal location according to the available map information on the two closest DNA markers, obtained from the LDB. The localization was defined in megabase distance units from the short-arm telomere of each chromosome. The confidence limits of each localization, corresponding to half of the average length of the mapping intervals for the entire series of entries, are 2.5 Mb.
The HMGM is available on-line (http://bio.unipd.it/∼telethon). An example of this map is shown in Figure 1.
Figure 1.
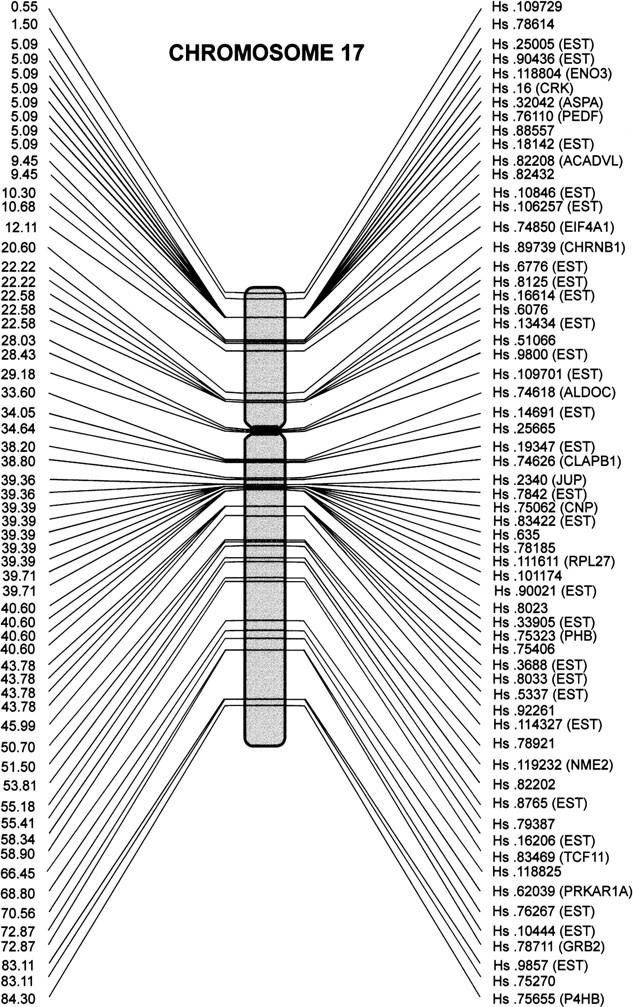
The HMGM of chromosome 17. The distance from the short-arm telomere, expressed in Mb, is shown in correspondence of each entry specified by the UniGene catalog number.
At the present time, the HMGM set includes 592 known human genes and 486 ESTs, including the 46 novel HSPDs that show no similarity to any known sequence; in total, 298 ESTSs (27.6% of the entire set) correspond to putative novel genes.
Less than 3% of the 1778 muscle transcripts considered in this study appear to be expressed exclusively in this tissue, because all the sequences included in the corresponding UniGene clusters were obtained exclusively from human skeletal muscle cDNA libraries. Only four of them showed a precise map localization (Hs.101337: uncoupling protein 3 mitochondrial, 11q14; Hs.85358: protein phosphatase 1, regulatory inhibitor, subunit 3, 7q31.31; Hs.89739: cholinergic receptor, nicotinic β polypeptide 1, 17p11.2; Hs.66735: ectodermal dysplasia protein, Xq13).
In addition, the 46 HSPD novel transcripts should be considered putative muscle-specific genes, as they were found only in the skeletal muscle cDNA library obtained in our laboratory. Therefore, in total, HMGM contains 50 putative muscle-specific genes. This number is possibly overestimated, because in the future some transcripts might be detected in other tissues.
Table 2 reports the distribution of transcripts by chromosome in the HMGM data set and the proportion of known genes and putative novel genes per chromosome.
Table 2.
Muscle Gene Distribution by Chromosome in the HMGM Data Set
| Chr. | Entries in HMGM | Genes | ESTs | HSPDs | ||||
|---|---|---|---|---|---|---|---|---|
| similar to | ||||||||
| new | highly | moderately | weakly | total | ||||
| 1 | 115 | 54 | 35 | 5 | 3 | 11 | 54 | 7 |
| 2 | 79 | 41 | 17 | 7 | 3 | 9 | 36 | 2 |
| 3 | 82 | 46 | 15 | 7 | 3 | 6 | 31 | 5 |
| 4 | 36 | 20 | 10 | 3 | 2 | 1 | 16 | 0 |
| 5 | 47 | 20 | 13 | 4 | 1 | 4 | 22 | 5 |
| 6 | 50 | 25 | 12 | 4 | 1 | 3 | 20 | 5 |
| 7 | 40 | 22 | 9 | 4 | 0 | 4 | 17 | 1 |
| 8 | 49 | 25 | 16 | 2 | 1 | 2 | 21 | 3 |
| 9 | 40 | 19 | 11 | 3 | 3 | 4 | 21 | 0 |
| 10 | 51 | 25 | 11 | 2 | 5 | 4 | 22 | 4 |
| 11 | 63 | 42 | 8 | 4 | 2 | 4 | 18 | 3 |
| 12 | 51 | 33 | 9 | 3 | 0 | 4 | 16 | 2 |
| 13 | 16 | 9 | 4 | 0 | 0 | 0 | 4 | 3 |
| 14 | 40 | 22 | 11 | 3 | 1 | 3 | 18 | 0 |
| 15 | 38 | 19 | 14 | 1 | 0 | 4 | 19 | 0 |
| 16 | 41 | 25 | 5 | 4 | 0 | 7 | 16 | 0 |
| 17 | 62 | 36 | 15 | 4 | 2 | 5 | 26 | 0 |
| 18 | 17 | 12 | 2 | 2 | 0 | 1 | 5 | 0 |
| 19 | 54 | 35 | 8 | 4 | 2 | 3 | 17 | 2 |
| 20 | 35 | 16 | 10 | 3 | 3 | 2 | 18 | 1 |
| 21 | 7 | 5 | 2 | 0 | 0 | 0 | 2 | 0 |
| 22 | 24 | 16 | 5 | 0 | 1 | 0 | 6 | 2 |
| X | 41 | 25 | 10 | 1 | 1 | 3 | 15 | 1 |
| 1078 | 592 | 252 | 70 | 34 | 84 | 440 | 46 | |
In columns, from left to right: (1) total number of transcripts included in the map; (2) the number of transcripts corresponding to already known human genes, (3) the number of ESTs corresponding to putative new genes and (4) to already known genes, with different degrees of similarity; (5) the total number of ESTs per chromosome, and (6) the number of HSPDs.
Table 3 reports the distribution by chromosome of genes expressed in muscle reported in the HMGM data set. The distribution is compared with the expectation according to the Human Gene Map database. In the same table, the distribution of genes by chromosome is reported for the three skeletal muscle libraries (no. 500, no. 272, and no. 24) considered in the present study.
Table 3.
Summary of Statistics
| Chr. | Human gene map | HMGM (skeletal muscle) | Library 500 (skeletal muscle) | Library 24 (skeletal muscle) | Library 272 (skeletal muscle) | Library 245 (uterus) | Library 241 (heart) | ||||||||||||
|---|---|---|---|---|---|---|---|---|---|---|---|---|---|---|---|---|---|---|---|
| obs | exp | χ2 | obs | exp | χ2 | obs | exp | χ2 | obs | exp | χ2 | obs | exp | χ2 | obs | exp | χ2 | ||
| 1 | 2162 | 115 | 116.3 | 0.0 | 34 | 37.9 | 0.4 | 58 | 53.3 | 0.4 | 59 | 55.2 | 0.3 | 318 | 306.7 | 0.4 | 44 | 51.6 | 1.1 |
| 2 | 1600 | 79 | 86.1 | 0.6 | 19 | 28.0 | 2.9 | 38 | 39.4 | 0.1 | 42 | 40.9 | 0.0 | 211 | 227.0 | 1.1 | 34 | 38.2 | 0.5 |
| 3 | 1388 | 82 | 74.7 | 0.7 | 21 | 24.3 | 0.5 | 38 | 34.2 | 0.4 | 43 | 35.5 | 1.6 | 187 | 196.9 | 0.5 | 37 | 33.1 | 0.5 |
| 4 | 1013 | 36 | 54.5 | 0.3 | 9 | 17.7 | 4.3 | 22 | 25.0 | 0.4 | 15 | 25.9 | 4.6 | 122 | 143.7 | 3.3 | 21 | 24.2 | 0.4 |
| 5 | 974 | 47 | 52.4 | 0.6 | 10 | 17.1 | 2.9 | 29 | 24.0 | 1.0 | 20 | 24.9 | 1.0 | 140 | 138.2 | 0.0 | 29 | 23.2 | 1.4 |
| 6 | 1034 | 50 | 55.6 | 0.6 | 18 | 18.1 | 0.0 | 26 | 25.5 | 0.0 | 16 | 26.4 | 4.1 | 150 | 146.7 | 0.1 | 17 | 24.7 | 2.4 |
| 7 | 1111 | 40 | 59.8 | 0.3 | 11 | 19.5 | 3.7 | 19 | 27.4 | 2.6 | 25 | 28.4 | 0.4 | 140 | 157.6 | 2.0 | 25 | 26.5 | 0.1 |
| 8 | 865 | 49 | 46.5 | 0.1 | 13 | 15.2 | 0.3 | 19 | 21.3 | 0.3 | 23 | 22.1 | 0.0 | 106 | 122.7 | 2.3 | 16 | 20.6 | 1.0 |
| 9 | 852 | 40 | 45.8 | 0.7 | 20 | 14.9 | 1.7 | 17 | 21.0 | 0.8 | 14 | 21.8 | 2.8 | 116 | 120.9 | 0.2 | 22 | 20.3 | 0.1 |
| 10 | 887 | 51 | 47.7 | 0.2 | 14 | 15.5 | 0.2 | 23 | 21.9 | 0.1 | 22 | 22.7 | 0.0 | 130 | 125.8 | 0.1 | 18 | 21.2 | 0.5 |
| 11 | 1344 | 63 | 72.3 | 1.2 | 28 | 23.5 | 0.8 | 19 | 33.1 | 6.0 | 27 | 34.3 | 1.6 | 171 | 190.6 | 2.0 | 34 | 32.1 | 0.1 |
| 12 | 958 | 51 | 51.5 | 0.0 | 15 | 16.8 | 0.2 | 25 | 23.6 | 0.1 | 24 | 24.5 | 0.0 | 144 | 135.9 | 0.5 | 28 | 22.9 | 1.2 |
| 13 | 377 | 16 | 20.3 | 0.9 | 5 | 6.6 | 0.4 | 9 | 9.3 | 0.0 | 4 | 9.6 | 3.3 | 52 | 53.5 | 0.0 | 3 | 9.0 | 4.0 |
| 14 | 713 | 40 | 38.4 | 0.1 | 11 | 12.5 | 0.2 | 21 | 17.6 | 0.7 | 21 | 18.2 | 0.4 | 108 | 101.1 | 0.5 | 22 | 17.0 | 1.5 |
| 15 | 626 | 38 | 33.7 | 0.6 | 17 | 11.0 | 3.3 | 20 | 15.4 | 1.4 | 19 | 16.0 | 0.6 | 94 | 88.8 | 0.3 | 17 | 14.9 | 0.3 |
| 16 | 573 | 41 | 30.8 | 3.4 | 10 | 10.0 | 0.0 | 21 | 14.1 | 3.3 | 21 | 14.6 | 2.8 | 93 | 81.3 | 1.7 | 13 | 13.7 | 0.0 |
| 17 | 790 | 62 | 42.5 | 8.9** | 22 | 13.8 | 4.8* | 21 | 19.5 | 0.1 | 30 | 20.2 | 4.8* | 145 | 112.1 | 9.7** | 27 | 18.8 | 3.5 |
| 18 | 415 | 17 | 22.3 | 1.3 | 8 | 7.3 | 0.1 | 7 | 10.2 | 1.0 | 11 | 10.6 | 0.0 | 41 | 58.9 | 5.4 | 5 | 9.9 | 2.4 |
| 19 | 644 | 54 | 34.6 | 10.8*** | 28 | 11.3 | 24.8*** | 23 | 15.9 | 3.2 | 27 | 16.5 | 6.8** | 107 | 91.3 | 2.7 | 17 | 15.4 | 0.2 |
| 20 | 567 | 35 | 30.5 | 0.7 | 14 | 9.9 | 1.7 | 16 | 14.0 | 0.3 | 11 | 14.5 | 0.8 | 88 | 80.4 | 0.7 | 12 | 13.5 | 0.2 |
| 21 | 163 | 7 | 8.8 | 0.4 | 1 | 2.9 | 1.2 | 2 | 4.0 | 1.0 | 5 | 4.2 | 0.2 | 28 | 23.1 | 1.0 | 4 | 3.9 | 0.0 |
| 22 | 432 | 24 | 23.2 | 0.0 | 10 | 7.6 | 0.8 | 10 | 10.7 | 0.0 | 7 | 11.0 | 1.5 | 61 | 61.3 | 0.0 | 15 | 10.3 | 2.1 |
| X | 548 | 41 | 29.5 | 4.5* | 13 | 9.6 | 1.2 | 11 | 13.5 | 0.5 | 26 | 14.0 | 10.3*** | 90 | 77.7 | 1.9 | 18 | 13.1 | 1.9 |
| 20036 | 1078 | 1078.0 | 49.0 | 351 | 351.0 | 56.3 | 494 | 494.0 | 23.6 | 512.0 | 512 | 47.7 | 2842 | 2842.0 | 36.5 | 478 | 478.0 | 25.3 | |
First column: The number of genes by chromosome, reported in The Human Gene Map database. For each library, the number of observed data, the expectations and the associated χ2 are reported, both by chromosome (in columns) and for the total distribution (in the bottom line). Highly significant values of χ2 for single chromosomes (df = 1) are indicated, respectively, with one (P = 0.05), two (P = 0.01), or three (P = 0.001) asterisks (*). The statistically significant (P < 0.002) distributions are reported in bold. Library no. 500, no. 272, and no. 24 are from human adult skeletal muscle. Library no. 245 is from human uterus, and library no. 241 from adult human heart. HMGM corresponds to the set obtained by pooling the three skeletal muscle libraries, including the HSPDs.
The observed genomic distribution in the HMGM data set significantly deviates from the expectations (χ2 = 49.0, df = 22, P = 0.0008). Also the distributions in library no. 500 and in library no. 272 show significant deviations (χ2 = 56.3, df = 22, P = 0.0001 and χ2 = 47.7, df = 22, P = 0.0012, respectively). The deviation is also significant for specific chromosomes that appear to contain a higher than expected number of muscle genes. In particular, chromosome 17 consistently shows an excess of genes in all the skeletal muscle libraries considered by this study and in the HMGM data set, which corresponds to the nonredundant pool of the three libraries. In Table 3, data from library no. 245 (adult human pregnant uterus) and no. 241 (human heart), obtained from UniGene, are reported for comparison. A significant deviation from the expected distribution is only observed for chromosome 17 in library no. 245 (χ2 = 9.7, df = 1, P = 0.0018), whereas the overall distributions are not significantly different from the expectation.
An attempt was made to analyze the subchromosomal distribution of mapped ESTs. In this case, the expected distribution by the cytogenetic band of the 1078 muscle genes was calculated. The map location of each band boundary was obtained from the LDB. In total, 290 bands were considered (data not shown), but the analysis was restricted to the ones in which the presence of five or more genes was expected. Five bands (1.7% of the total) showed a significant excess of genes expressed in muscle: 6p21 (22 observed, 10.5 expected, χ2 = 12.6, df = 1, P = 0.0004), 10q22 (17 observed, 8.4 expected, χ2 = 8.7, df = 1, P = 0.0032), 12q24 (23 observed, 10.8 expected, χ2 = 13.8, df = 1, P = 0.0002), 14q31 (14 observed, 6.4 expected, χ2 = 9.0, df = 1, P = 0.0027), and 19p13 (20 observed, 11.4 expected, χ2 = 6.5, df = 1, P = 0.0108).
DISCUSSION
The aim of the present work was the construction of a comprehensive and updated map of human skeletal muscle genes.
The present version of the HMGM includes all of the transcripts from the most abundant cDNA libraries from adult skeletal muscle reported in UniGene, plus 46 newly mapped transcripts, presumably corresponding to novel genes, derived from the skeletal muscle cDNA library no. 500, produced in our laboratory.
The pooling of the different libraries was arbitrary, but it was essential to give the best possible inventory of the genes expressed in the selected tissue. Because the UniGene database is regularly updated by the integration of GenBank, EMBL, and dbEST, the HMGM data set is likely to be the most advanced and complete representation of the transcriptional activity of skeletal muscle tissue.
In this data set, 54.9% of the entries are represented by already known human genes, 17.4% by ESTs showing similarity with known genes, and 27.6% by ESTs corresponding to putative new genes.
The genomic distribution of the entries in the present map confirmed the previous finding of a selective gene concentration in chromosomes 17, 19, and X (Pallavicini et al. 1997). However, the overall deviation from the expectation in the HMGM (1078 mapped entries) appeared less pronounced than in the sample of 509 ESTs reported previously (χ2 = 49.0 vs. χ2 = 140). This difference may be partially explained by the pooling of different libraries (see Table 3). On the other hand, the discrepancy might also be owing to the fact that the release of UniGene used in the present study did not include all of the transcripts from library no. 500, used for building the previous muscle transcript map.
The Human Gene Map was selected as the reference database, because it is the most complete collection of genes available so far, accounting in total for up to 20,000 entries obtained from numerous libraries and from different tissues. This database is probably the best possible source for calculating the expected genomic and chromosomal distribution of genes. Therefore, the observed relative abundance of muscle genes in specific chromosomes may really reflect a chromosomal concentration of genes strongly expressed in muscle.
Although the HMGM shows the presence of several regions in which the genes appear to be densely concentrated, only five bands were found to be significantly enriched for muscle genes. This may be owing to the relatively poor ratio between the total number of genes on the map and the number of genomic segments considered by the study. Because of the relatively limited number of available map entries, we were forced to use a rather large window. We selected as intervals the cytogenetic bands, because, in spite of their variability in length and the relative imprecision in the mapping of their boundaries, euchromatic and heterochromatic regions have definitely a functional significance.
On the other hand, it is possible that the concentration of muscle genes in specific chromosomal regions might reflect, with a few exceptions, the overall distribution of genes along the chromosomes. If this were the case, the transcriptional pattern of the adult skeletal muscle could not correspond to the selective activity of muscle-specific gene clusters but rather to a quantitatively different expression of genes within the chromosomal regions available for transcription. Hence, the biochemical and functional properties of differentiated muscle cells may result from the transcription of a very limited number of muscle-specific genes plus the activity of a large number of genes that are also transcribed in other tissues but at quantitatively different expression levels. Our data show that the proportion of muscle-specific transcripts is very low, thus apparently supporting this hypothesis.
METHODS
Muscle Libraries
The library, which is reported in UniGene [National Center for Biotechnology Instruction (NCBI)] as no. 500, was produced in our laboratory from human female pectoralis major muscle, as described previously (Lanfranchi et al. 1996). Presently, this library accounts for 13,192 ESTs that resulted from the quality control screening (minimum length 50 bp, after trimming and masking for SINEs, LINEs, mitochondrial genome, and retroviral sequences). Masking was performed by PHRED software and by CROSSMATCH (Phil Green and Arian Smith at NCBI), both integrated in the software ESTRAI, developed in our laboratory.
The 13,192 sequences were grouped by similarity and produced 3209 individual transcripts. These were compared by BLAST 2.5 with EMBL no. 51, UniGene no. 18, and Swiss-Prot no. 34 to investigate their similarity with any DNA sequence reported so far (cut off for similarity P = e−20 − e−40 for Swiss-Prot and P = e−30 − e−60 for the others). Four hundred and thirty-two transcripts showed no match and corresponded presumably to novel genes.
Among the muscle libraries available in UniGene (Boguski and Schuler 1995), for the present study we selected the most abundant libraries obtained from adult skeletal muscle (no. 500, including 2666 sequences; no. 272, including 5609 sequences; and no. 24, including 2835 sequences) to construct the HMGM data set.
RH Mapping—Primer Design
Primers, synthesized by Genset (France), were specifically designed on the original DNA sequence of ESTs representative of novel transcripts, using the software PRIMER3 (Rozen and Skaletsky 1996). Primers were generally 18–22 bp long with a GC content between 40% and 60%. The Tm range was 57–61°C. In the primers selection, we excluded as target sequences regions very close to the poly(A) tract, where signals of polyadenylation could be present.
Amplification of Radiation Hybrids and Electrophoresis
The radiation hybrid mapping was performed by the GeneBridge4 whole-genome Radiation Hybrid Panel (Research Genetics) consisting of 93 genomic DNAs from the same number of human-on-hamster somatic cell lines, plus the two control DNAs (HFL donor and A23 recipient) (Walter et al. 1994).
Twenty nanograms of genomic DNA were used for amplification in 10 μl of PCR buffer [16.6 mm (NH4)2SO4; 67 mm Tris-HCl (pH 8.3), 0.01% Tween 20, and 1.5 mm MgCl2] containing 800 nm of each of the forward and reverse primers, 0.2 units of DNA polymerase (RTB polymerase; Bioline, Italy), and 25 μm each of the four dNTPs. The mix was overlaid with 5 μl of mineral oil.
After primer optimization, the reactions were performed in 96-well plates (93 GeneBridge lines, plus three controls). The preparation of the reaction mixtures and the delivery of the DNA samples on the plates were performed using a Beckman Biomek 2000 robotic station. The PCR reactions were performed in a PTC-225 Peltier Thermal Cycler (MJ Research).
Cycling conditions were 75 sec at 94°C, followed by 35 cycles for 15 sec at 94°C, 25 sec at the working annealing temperature, and 30 sec at 72°C, and a final extension step for 90 sec at 72°C.
The PCR products were mixed with 5 μl of loading buffer (30% glycerol; 0.25% Orange G; 25 mm EDTA) and separated on 2.5% horizontal agarose gel in TAE buffer (40 mm Tris-acetate and 1 mm EDTA) stained with ethidium bromide. The gel was electrophoresed in the same buffer at 100 V for 1 hr.
Analysis of the Retention Profiles
The retention profiles, deduced from the results of the electrophoretic separations, were submitted to the Whitehead Institute/MIT Center for Genome Research (USA). They were processed by the program RHMAPPER (Slonim et al. 1998) and placed in the Whitehead framework of markers.
One centiRay (cR) corresponds to a 1% frequency of breakage between the involved markers, at a given dose of radiation, used for the chromosome fragmentation. The GeneBridge panel was obtained with a dosage of 3000 rad, and 1 cR roughly corresponded to 300 kb (Hudson et al. 1995).
Databases and Data Retrieval
Data on transcripts used in the present work were retrieved from the UniGene database (release no. 37).
This release contains the information on 673,533 sequences, corresponding to all the known genes included in GenBank no. 106 (May 10, 1998) and to all the ESTs included in dbEST (release May 17, 1998). In UniGene, sequence data are automatically processed to cluster the overlapping sequences and to produce the so-called “UniGene clusters.” Presently, the database includes 41,944 UniGene clusters, with a 98.7% coverage of known genes by ESTs.
Each UniGene cluster is identified by an individual entry and characterized by sequence, expression pattern (the libraries in which the transcript was found), map position, and best protein hit information.
The UniGene database can be searched by library, by chromosome, or by keyword.
A dedicated software, named UGS (UniGeneScan), was specifically designed in our laboratory to collect automatically complete sets of UniGene data and to analyze them by an independent query engine that uses the Boolean operators “not” and “or,” besides the operator “and,” originally available in UniGene. In particular, the operator “or” allows the function “union without redundancy” of different but partially overlapping data sets. We applied this method to the three libraries considered in this study.
The LDB (Collins et al. 1996) provides a very rich framework of markers of the human genome and the integration between genetic and physical maps.
The number of genes by chromosome or by chromosomal band, used for the statistical analysis, was obtained from The Human Gene Map at NCBI. This is still the richest collection of mapped genes, accounting for 20,036 entries. The information on the number of genes reported to map in a given chromosome was obtained by using the option “select markers” set “from p-tel to q-tel.” Similarly, the information on gene content per chromosomal band was obtained by specifying in the same option of Human Gene Map the markers bordering on the given band, as reported in the LDB.
Map Construction
For each UniGene library, data were collected and matched to avoid redundancy; the transcripts were then sorted by chromosome, excluding the Y. An index of UniGene entries for each chromosome was thus generated. Each entry, along with its identification number, included the information on the two closest markers. By retrieving from the LDB the position of each marker, expressed in megabase pairs (Mb) from the top of the chromosome, we were able to place each UniGene entry to the center of the interval defined by the two closest markers.
In a limited number of cases, the UniGene database reported the mapping information as cytogenetic interval. These entries were included in this study if the interval’s size was comparable with the average one obtained when the positions of the two flanking markers were available.
ESTs obtained from library no. 500, corresponding to putative novel genes and RH-mapped in our laboratory, were placed in the same linear map, by locating the flanking markers according to the LDB. The cR distance from the closest marker was then converted in Mb distance from the chromosome telomere.
A text file was prepared for each chromosome, in which the entries and their map position in Mb were listed.
These text files were used as input for the program IDX2HTML, developed in our laboratory, to produce the pictorial representation of the maps of different chromosomes. The maps are available on-line at the Web site MUSCLENET (www.bio.unipd.it/∼telethon).
Statistical Treatment of Data
Data from The Human Gene Map database were used to calculate the expected distribution of genes by chromosome and, within each chromosome, by chromosomal band.
When analyzing the genomic distribution of genes, the statistical significance of the deviation of the observed distribution from the expectation was tested by a χ2 goodness-of-fit test, with 22 degrees of freedom and the level of significance established at 0.002 (i.e., 0.05/23), according to the Bonferroni correction (Simes et al. 1986).
When considering single chromosomes, the statistical significance of the deviation was tested both by a χ2 test (obs/exp) with 22/23 degrees of freedom and by a χ2 test in which the deviation for that specific chromosome was compared with the deviation observed for the whole genome (excluding the chromosome involved), with 1 degree of freedom.
Also in these tests, the level of statistical significance was established as specified above.
On the other hand, when analyzing the subchromosomal distribution of genes, the observed number of ESTs per cytogenetic band was compared with the expected gene density in that given band, according to The Human Gene Map data base. The statistical significance of the deviation from the expectation was tested by a χ2 test with one degree of freedom. Classes in which the expected number was less than five were not considered. The threshold of significance was established at P = 0.01 with one degree of freedom.
Collection of Data from Remote Databases
Data were collected from different databases: dbEST (http://www3.ncbi.nlm.nih.gov/dbEST); EMBL (http://www.ebi.ac.uk/ebi_home.html); GenBank (http://www3.ncbi.nlm.nih/Entrez); The Human Gene Map (http://www.ncbi.nlm.nih.gov/SCIENCE96/); LDB (http://cedar.genetics.soton.ac.uk/public_html); and UniGene (http://www.ncbi.nlm.nih.gov/UniGene).
Acknowledgments
We thank TELETHON-Italy for having entirely supported this work (grant B30 to G.L. and G.V.). The Web site MUSCLENET (http://www.bio.unipd.it/∼telethon) is also financially supported by TELETHON-Italy. S.B., L.R., A.P., and N.T. are Ph.D. students of “Dottorato in Scienze Genetiche,” University of Ferrara, Italy. We are grateful to Drs. G. Faulkner and P. Downey for revising the manuscript.
The publication costs of this article were defrayed in part by payment of page charges. This article must therefore be hereby marked “advertisement” in accordance with 18 USC section 1734 solely to indicate this fact.
Footnotes
E-MAIL danieli@civ.bio.unipd.it; FAX 39 49 8276209.
REFERENCES
- Boguski MS, Schuler GD. ESTablishing a human transcript map. Nature Genet. 1995;10:369–371. doi: 10.1038/ng0895-369. [DOI] [PubMed] [Google Scholar]
- Callen DF, Lane SA, Kozman H, Kremmidiotis G, Witmore SA, Lowenstein M, Doggett NA, Kenmochi N, Page DC, Maglott DR, et al. Integration of transcript and genetic maps of chromosome 16 at near-1-Mb resolution: Demonstration of a “hot spot” for recombination at 16p12. Genomics. 1995;29:503–511. doi: 10.1006/geno.1995.9005. [DOI] [PubMed] [Google Scholar]
- Collins A, Frezal J, Teague J, Morton NE. A metric map of humans: 23,500 loci in 850 bands. Proc Natl Acad Sci. 1996;93:14771–14775. doi: 10.1073/pnas.93.25.14771. [DOI] [PMC free article] [PubMed] [Google Scholar]
- Hudson TJ, Stein LD, Gerety SS, Ma JL, Castle AB, Silva J, Slonim DK, Baptista R, Kruglyak L, Xu SH, Hu XT, Colbert AMF, Rosenberg C, Reevedaly MP, Rozen S, Hui L, Wu XY, Vestergaard C, Wilson KM, Bae JS, Maitra S, Ganiatsas S, Evans CA, Deangelis MM, Ingalls KM, Nahf RW, Horton LT, Anderson MO, Collymore AJ, Ye WJ, Kouyoumjian V, Zemsteva IS, Tam J, Devine R, Courtney DF, Renaud MT, Nguyen H, Oconnor TJ, Fizames C, Faure S, Gyapay G, Dib C, Morissette J, Orlin JB, Birren BW, Goodman N, Weissenbach J, Hawkins TL, Foote S, Page DC, Lander ES. An STS-based map of the human genome. Science. 1995;270:1945–1954. doi: 10.1126/science.270.5244.1945. [DOI] [PubMed] [Google Scholar]
- Hwang DM, Dempsey AA, Wang RX, Rezvani M, Barrans JD, Dai KS, Wang HY, Ma H, Cuckerman E, Liu JK, Gu JR, Zhang JH, Tsui SKW, Waye MMY, Fung KP, Lee CY, Liew CC. A genome-based resource for molecular cardiovascular medicine. Toward a compendium of cardiovascular genes. Circulation. 1997;96:4146–4203. doi: 10.1161/01.cir.96.12.4146. [DOI] [PubMed] [Google Scholar]
- Jensen SJ, Sulman EP, Maris JM, Matise TC, Vojta PJ, Barrett JC, Brodeur GM, White PS. An integrated transcript map of human chromosome 1p35-p36. Mol Biol & Genet. 1997;42:126–136. doi: 10.1006/geno.1997.4714. [DOI] [PubMed] [Google Scholar]
- Lanfranchi G, Muraro T, Caldara F, Pacchioni B, Pallavicini A, Pandolfo D, Toppo S, Trevisan S, Scarso S, Valle G. Identification of 4370 expressed sequence tags from a 3′ end specific cDNA library of human skeletal muscle by DNA sequencing and filter hybridization. Genome Res. 1996;6:35–42. doi: 10.1101/gr.6.1.35. [DOI] [PubMed] [Google Scholar]
- Pallavicini A, Zimbello R, Tiso N, Muraro T, Rampoldi L, Bortoluzzi S, Valle G, Lanfranchi G, Danieli GA. The preliminary transcript map of a human skeletal muscle. Hum Mol Genet. 1997;6:1445–1450. doi: 10.1093/hmg/6.9.1445. [DOI] [PubMed] [Google Scholar]
- Polymeropoulos MH, Xiao H, Sikela JM, Adams M, Venter JC, Merril CR. Chromosomal distribution of 320 genes from a brain cDNA library. Nature Genet. 1993;4:381–386. doi: 10.1038/ng0893-381. [DOI] [PubMed] [Google Scholar]
- Rozen S, Skaletsky HJ. PRIMER: A computer program for automatically selecting PCR primers. 1996. http://www-genome.wi.mit.edu/genome_software/other/primer3.html ( http://www-genome.wi.mit.edu/genome_software/other/primer3.html). ). [Google Scholar]
- Simes RJ. An improved Bonferroni procedure for multiple tests of significance. Biometrika. 1986;73:751–754. [Google Scholar]
- Slonim D, Stein L, Kruglyak L, Lander E. RHMAPPER: An interactive computer package for constructing radiation hybrid maps. 1998. http://www-genome.wi.mit.edu/ftp/pub ( http://www-genome.wi.mit.edu/ftp/pub). ). [Google Scholar]
- van der Hoeven F, Zakany J, Duboule D. Gene transpositions in the HoxD complex reveal a hierarchy of regulatory controls. Cell. 1996;85:1025–1035. doi: 10.1016/s0092-8674(00)81303-3. [DOI] [PubMed] [Google Scholar]
- Walter MA, Spillet DJ, Thomas P, Weissenbach J, Goodfellow PN. A method for constructing radiation hybrid maps of whole genomes. Nature Genet. 1994;7:22–28. doi: 10.1038/ng0594-22. [DOI] [PubMed] [Google Scholar]
- Yaspo ML, Gellen L, Mott R, Korn B, Nizetic B, Poustka AN, Lehrach H. Model for a transcript map of human chromosome 21: Isolation of new coding sequences from exon end enriched cDNA libraries. Hum Mol Genet. 1995;4:1291–1304. doi: 10.1093/hmg/4.8.1291. [DOI] [PubMed] [Google Scholar]