Abstract
An automated, inexpensive, easy-to-use, and reproducible technique for controlled, random DNA fragmentation has been developed. The technique is based on point–sink hydrodynamics that result when a DNA sample is forced through a small hole by a syringe pump. Commercially available components are used to reduce the cost and complexity of the instrument. The design is optimized to reduce the volume of sample required and to speed processing time. Shearing of the samples can be completely automated by computer control. Ninety percent of sheared DNA fragments fall within a twofold size distribution that is highly reproducible. Three parameters are critical: the flow geometry, the flow rate, and a minimum number of iterations. Shearing is reproducible over a wide range of temperatures, DNA concentrations, and initial DNA size. The cloning efficiency of the sheared DNA is very good even without end repair, the distribution of assembled sequences is random, and there is no sequence bias at the ends of sheared fragments that have been cloned. The instrument, called the Point–sink Shearer (PtS), has already been exported successfully to many other laboratories.
As full-scale sequencing and analysis of large genomes has begun, it is clear that creation of DNA libraries suitable for shotgun sequencing is a critical but often neglected step in automated processing. Many large sequencing facilities currently have sequencing rates of 10,000 to 30,000 raw bases per day, roughly one cosmid library daily. Once full-scale sequencing of the human genome begins, sequencing rates will climb to 5 × 10⁶ raw bases per day, requiring ∼10 BAC clone libraries daily. At this rate, library construction can be a rate-limiting step in the entire sequencing process unless significant resources are devoted to it. Owing to the complexity of library creation, the chief resource required is the skill of an advanced biochemist or molecular biologist, something that is difficult to provide in a production environment. An important part of reducing this requirement is the automation of source DNA fragmentation.
There are several methods available to create the random breakage necessary for subcloning. One class involves enzymatic digestion, either partial digestion with a restriction endonuclease (Maniatis et al. 1982) or controlled degradation with DNase I (Anderson 1981). Another class involves physical stresses induced by sonication (Deininger 1983), atomization (Cavalieri and Rosenberg 1959), nebulization (Bodenteich et al. 1994), or point–sink shearing (Oefner et al. 1996).
All of these methods have been used to make sequencing libraries, but each of them has its disadvantages. For example, enzymatic digestion with restriction endonucleases yields fragments very easy to clone but introduces a level of nonrandomness to the libraries that is unacceptable for the shotgun sequencing approach. In contrast, the remaining techniques are acceptably random, but in all except shearing, the resulting fragments have a very wide size range that must be narrowed by careful size selection before cloning. Finally, none of the techniques except shearing can be easily automated.
The hydrodynamic point–sink shearing method developed by Oefner et al. (1996) is the best of the current technologies for further automation. “Point–sink” refers to a theoretical model of the hydrodynamic flow in this system. Strictly speaking, it is the rate-of-strain tensor that describes the force on a molecule and hence its breakage. Historically, DNA breakage was attributed to the “shearing” terms of this tensor, and hence this class of method was referred to as shearing. In the present application, the breakage is caused by both the shearing terms (when the fluid is inside the narrow tube or orifice) and the extensional strain terms (when the fluid approaches the orifice). Point–sink shearing is accomplished by forcing DNA through a very small diameter tubing by applying pressure with an HPLC pump. The resulting DNA fragments have a tight size range: The largest fragments are only about twice as long as the smallest fragments. The main disadvantages of the HPLC shearing method are the cost of the pump and the requirement to dilute the sample 10-fold in the process.
The new instrument reported here, the Point–sink Shearer (PtS), is based on an inexpensive syringe pump. It retains the attractive features of the HPLC device but is less expensive, can process sample volumes as small as 50 μl without dilution, and is easier to use.
RESULTS
Instrument Setup
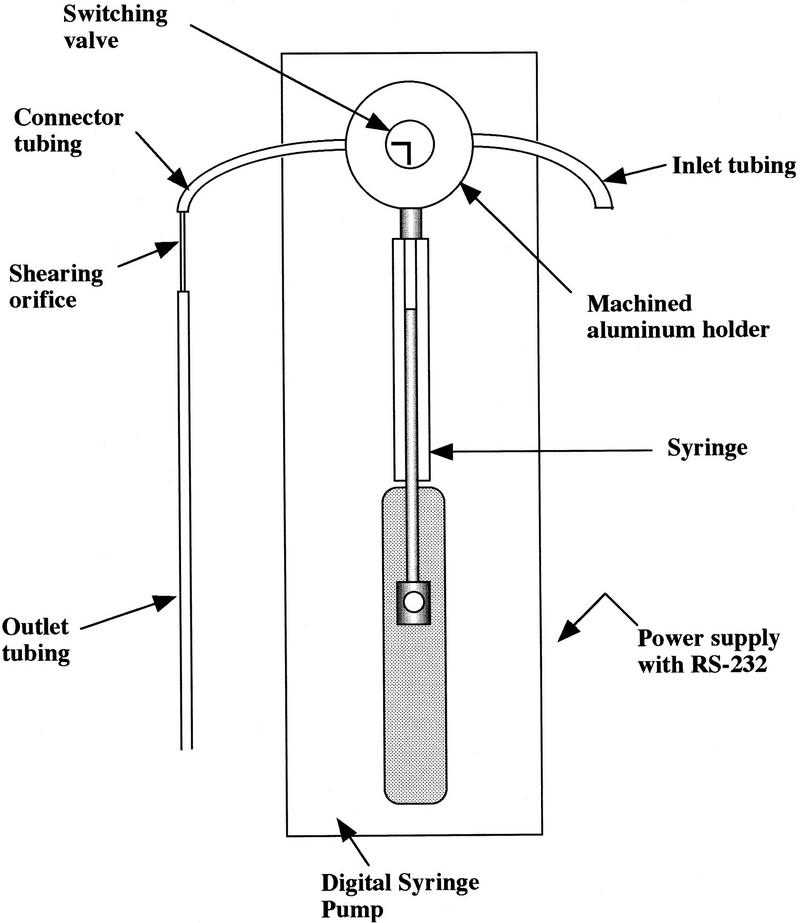
The PtS is composed of a fluid driver with a power supply and controlling software. The syringe pump is fitted with a 500-μl glass syringe that is attached to the pump driver arm. A sketch of the instrument is shown in Figure 1.
Figure 1.
Sketch of the PtS. Basic parts of the PtS are diagramed. The specific part numbers are listed in the text.
A variety of flow configurations were tested to explore their effects on shearing. Every leak-free geometry that included a hole with a diameter between 0.0016 inch and 0.0030 inch generated sheared DNA. Therefore, the simplest configuration was chosen to orient a laser-drilled ruby jewel or a short length of small-bore tubing in the flow path. Flangeless fittings with ferrules on Teflon tubing screwed into a union held the aligned orifice slightly inside both ferrules.
The void volume was minimized to process samples as small as 50 μl. This was accomplished by first minimizing the length of tubing required in the flow path between the syringe and the orifice and, second, by using a small (0.02 in.) inner diameter (iod) tubing at that position.
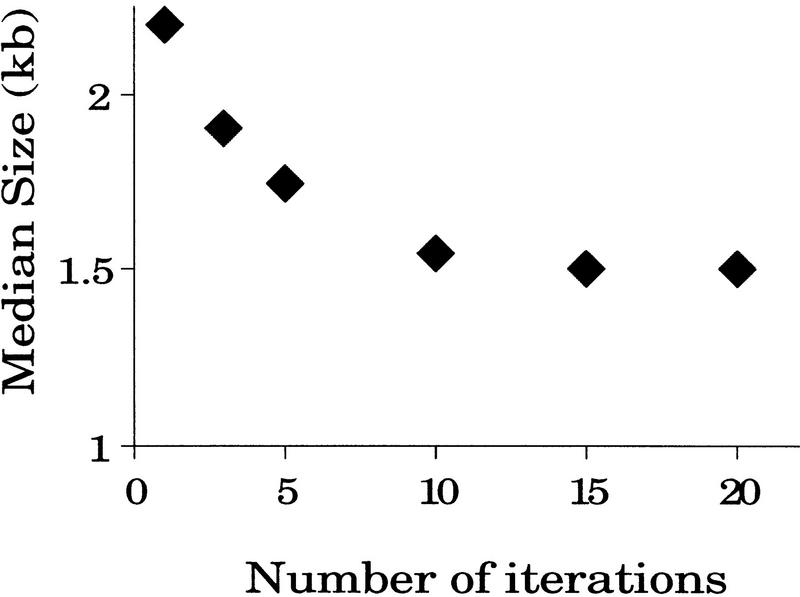
In the HPLC-based device, DNA was passed through a small orifice multiple times by recirculating the sample volume through a loop. In the PtS device, recirculation was simulated with multiple iterations through the small orifice. As with the HPLC device, the DNA size distribution decreased with each iteration until it reached a minimum (Fig. 2). About 15–20 iterations were sufficient to achieve the smallest size.
Figure 2.
Relationship between mean size of sheared DNA and number of passes through the shearing device. λ DNA was sheared by passing it through the orifice at 6.7 ml/min for 1, 3, 5, 10, 15, or 20 iterations. Each aliquot (0.5 μg) was separated by agarose gel electrophoresis and stained with ethidium bromide. The median size was determined by the darkest staining position on the gel.
Samples were sheared in increasingly smaller volumes to determine the practical lower limit for sample size. The sample volume was important because the entire sample did not pass through the orifice during each iteration. In shearing assemblies with a void volume of 25 μl, samples could be consistently sheared in volumes down to 50 μl. The median fragment size was ∼10% larger than that produced by a volume of 200 μl, presumably because the effective flow rate was slightly less in the smaller volume. In practice, this minor difference can be corrected by calibrating the instrument using the same volume as the sample to be sheared.
Reproducibility of Shearing
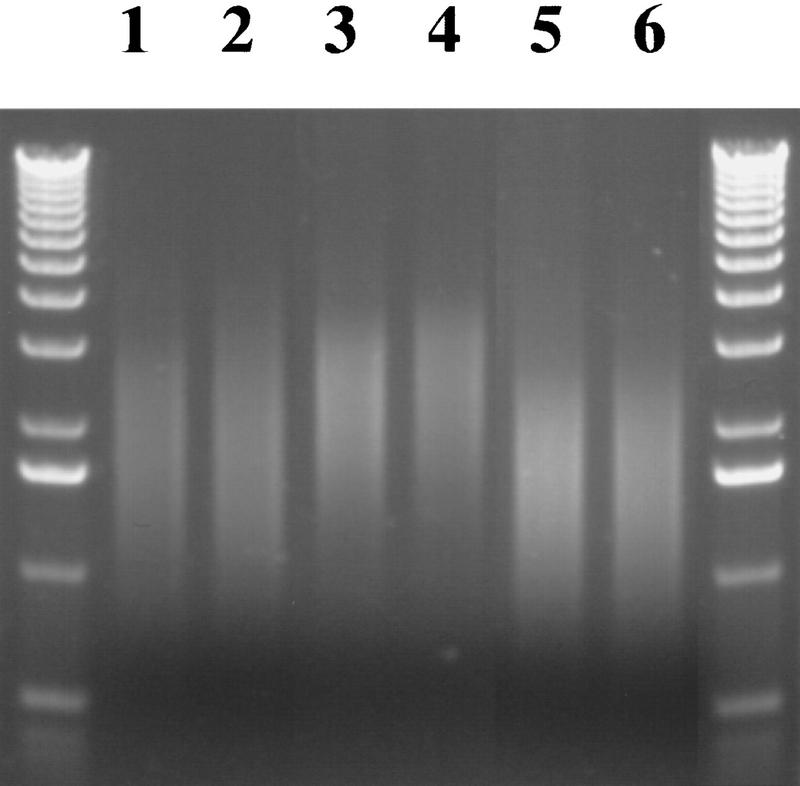
The size distribution of DNAs sheared in the PtS was extremely repeatable for a given shearing geometry and flow rate. Figure 3 shows two sets of experiments conducted on two different days. In each set of experiments, both the pump speed and the shearing geometry were varied. The median DNA size produced under the same conditions on two different days (lanes 1 vs. 2, 3 vs. 4, and 5 vs. 6) varied by no more than 10%.
Figure 3.
Agarose gel electrophoresis of λ DNA sheared on two different days with varying geometries and flow rates. λ DNA (0.5 μg) was sheared under different conditions, separated by gel electrophoresis, and stained with ethidium bromide. The samples in lanes 1, 3, and 5 were sheared on one day, and those in lanes 2, 4, and 6 were sheared 3 days later. All samples were sheared by 20 passages through a length of small-bore tubing (0.0025 in.). (Lanes 1,2) The tubing was 6 mm long; (lanes 3–6, the tubing was 3 mm long. The flow rate for samples in lanes 1–4 was 5.8 ml/min, and in lanes 5 and 6, it was 8.7 ml/min. Five micrograms of a kilobase molecular mass marker was loaded in each of the outside lanes.
In contrast, when the geometry of the shearing assembly or the flow rate were changed, the mean size of the sheared DNA changed. For example, increasing the flow rate resulted in a smaller size range, from a midrange of 2.5 kb to a midrange of 1.7 kb (Fig. 3, lanes 3,4 to 5,6, respectively). In addition, decreasing the length of the small-bore tubing increased the mean sheared size from 1.9 to 2.5 kb (lanes 1,2 to 3,4, respectively). The effect of tubing length may be explained by a convergence of flow in the longer tubing that would reduce the effective diameter of the constriction.
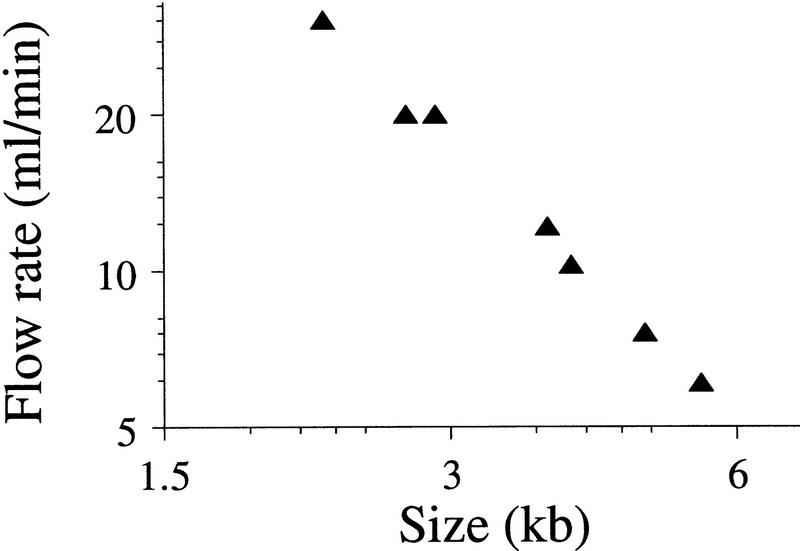
The size of the DNA fragments generated by hydrodynamic shearing was observed to be inversely proportional to the flow rate, and the relationship was reproducible for any given shearing assembly. In addition, the relationship between flow rate, and the median sample size had a power function (Figure 4) similar to that observed for the HPLC (Oefner et al. 1996). The slope of the line in Figure 4 was −0.56, compared with −1.14 for samples sheared with the HPLC. This difference might be due to the difference in salt concentration (0 vs. 5 mm) between them (see Discussion, below). Another difference was that the HPLC consistently produced smaller fragments at the same flow rates. A partial explanation for this effect is that the HPLC had a much longer length of tubing that reduced the effective diameter of the orifice by the hydrodynamic convergence of flow, as described above.
Figure 4.
Relationship between flow rate and mean size of the sheared DNA fragments. Seven different samples of λ DNA were sheared at different velocities and separated by agarose gel electrophoresis to determine the average size of the sheared fragments. The fitted curve (r2 = 0.981) corresponds to the equation Size = 12.3*Flow rate−0.58.
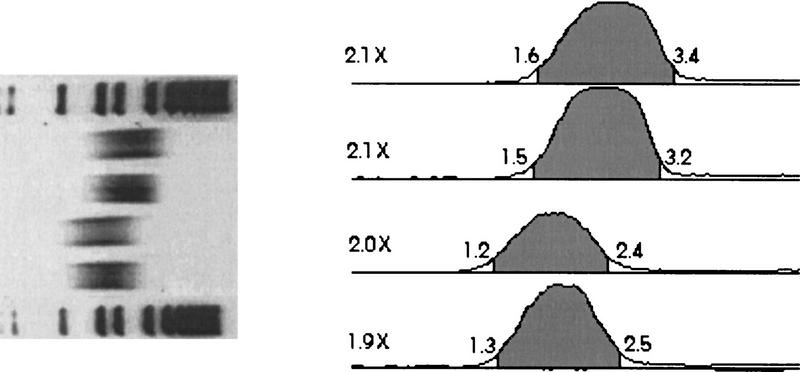
A key advantage of the point–sink flow generated by the HPLC method was the resulting tight size distribution of the sheared DNA fragments (Oefner et al. 1996). To determine whether the twofold size range could be reproduced with the PtS instrument, duplicate DNA samples were sheared at two different flow rates. Then, the fragments were separated by agarose gel electrophoresis, and the gel image was scanned to generate a densitometer trace for each lane (Fig. 5). The results indicated that the tight size distribution was duplicated in the PtS. Ninety percent of the area under the curve fell within a size range that was 2.0 ± 0.1-fold.
Figure 5.
Reverse image of ethidium bromide-stained agarose gel electrophoretograph and a densitometer trace of each lane. λ DNA was sheared in duplicate at two different flow rates for 20 iterations. Sheared DNA (0.5 μg) was loaded in each sample lane, and 5 μg of a kilobase molecular mass marker was loaded in the outside lanes and separated by gel electrophoresis. The gel photographic image was scanned on a Hewlett-Packard ScanJet IIcx scanner and imported into NIH Image 1.60ppc. The lanes were marked, and an annotated densitometer trace was created with a modified version of the “Gel Plotting” macro. The densitometer traces were not corrected for DNA size/intensity effects. The annotated trace marked the region that represented 90% of the area under the curve (shaded regions). The numbers outside of each shaded region are the bounds of the region in kb. The numbers at left of each densitometer trace (2.1×, 2.0×, etc.) represent the ratio of the upper limit over the lower limit of the size range indicated.
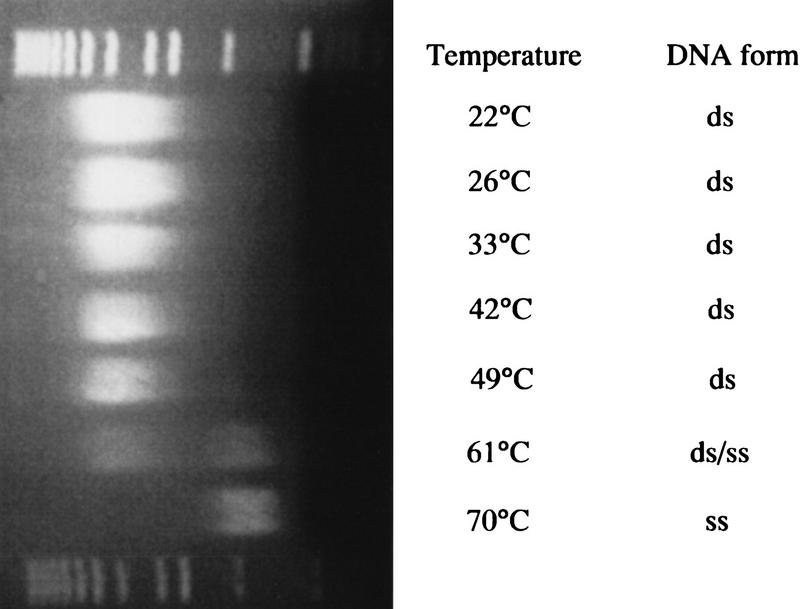
A number of additional conditions were tested to determine what effect, if any, they would have on the sheared fragment size. For example, different source DNAs (total genomic DNA from Escherichia coli, bacteriophage λ DNA, a cosmid clone, and two λ clones) were sheared, and the resulting sheared products were assayed by separation by agarose gel electrophoresis. Regardless of source, the mean fragment size differed by no more than 15%. Other parameters tested included temperatures ranging from 20 to 70°C, DNA concentrations from 0.0125 to 1.0 mg/ml, and buffers containing from 0 to 0.5 m NaCl. None of these conditions had any effect on the sheared DNA size except when shearing was performed above 60°C, in the denaturing temperature zone (Fig. 6). The difference in sheared size after denaturation was probably because single-stranded DNA sheared more readily than double-stranded DNA (Oefner et al. 1996; data not shown).
Figure 6.
Agarose gel electrophoresis of DNA samples sheared at different temperatures. λ DNA was sheared for 20 iterations with the PtS and separated by agarose gel electrophoresis. The samples in every lane were handled under the same conditions in each case except that the temperature at the point of shearing was as indicated. The temperature was controlled with a rectangular silicone rubber heater that was wound around the syringe, valve, and tubing. The temperature was measured with a thermocouple that was in direct contact with the tubing between the valve and the shearing assembly. (ds) Double stranded; (ss) single stranded.
The absence of an effect from differing salt concentrations contrasts with an observation made by Oefner et al. (1996). They found that increasing salt concentration resulted in larger DNA fragments, especially at slow flow rates (1–2 ml/min). At the fastest flow rates (8–9 ml/min), the size difference was very small. In the PtS, DNA samples did not shear at all until flow rates approached those of the fastest rates possible in the HPLC device (8.7 ml/min), so the two systems could not be compared under the conditions that produced the greatest difference. Therefore, it is not surprising that DNA sheared in the PtS in buffers containing 0, 100, or 500 mm NaCl had identical size distributions (data not shown).
In summary, the significant factors that influenced the size range of DNA produced in the PtS shearing device were the flow rate and the size of the orifice. The number of iterations and the volume of the sample were only significant if they fell below a minimum value. Factors that did not affect the fragment size were the salt concentration in the buffer, the DNA concentration, nondenaturing temperatures, and the length of the DNA before shearing.
Library Construction
To test whether the sheared DNA could be used to create an acceptable sequencing library, genomic DNA from Candida albicans was sheared to a fragment size of 3–6 kb. Then, the inserts were ligated, without size selection, into the HindIII site of pUC118 using the adaptor-linker strategy (http://www-sequence.stanford.edu/protocols/library.html; R.W. Hyman, J. Mulligan, E. Fung, K. Davis, M. Duncan, and R.W. Davis, in prep.). A second library was made to assess the importance of treating any nonblunt ends with the Klenow fragment of DNA polymerase. The untreated library produced 300,000 inserts (fourfold coverage for the entire Candida genome) and the treated library produced 500,000 inserts (sevenfold coverage).
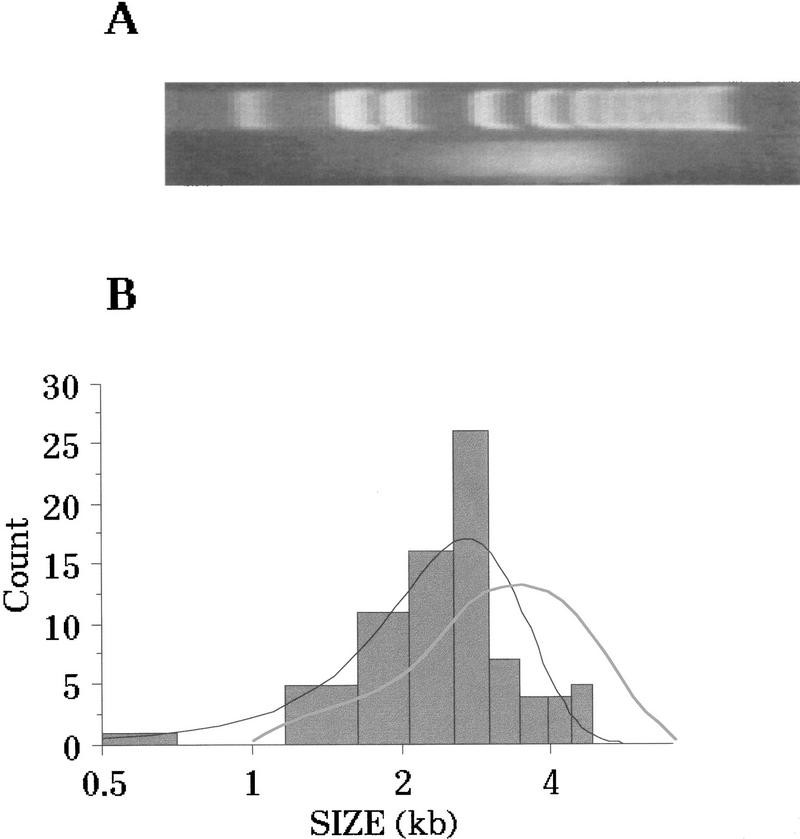
The insert sizes were quantitated in one library and compared with the distribution observed by gel electrophoresis and ethidium bromide staining. To compare the actual cloned insert sizes with the expected sizes based on gel electrophoresis, it was first necessary to adjust for the different staining intensities of large versus small fragments. A first approximation of the number average based on ethidium bromide staining was obtained by normalizing for molecular weight. The results of this comparison are shown in Figure 7. The ethidium bromide-stained gel image of the sheared DNA, separated by gel electrophoresis, is shown in Figure 7A. A densitometer scan of the gel was adjusted for molecular weight and superimposed on the graph as a lightly shaded line in Figure 7B. The predicted median fragment size was ∼3.6 kb. The average size of 84 fragments amplified from the library was ∼2.7 kb. The difference between the expected and the observed distributions is probably attributable to a bias for cloning smaller fragments.
Figure 7.
Analysis of size distribution of cloned fragments and comparison to agarose gel image. Candida albicans genomic DNA was sheared to an apparent size range of 2.5–5 kb and separated by agarose gel electrophoresis. (A) The gel image was digitized as described in Fig. 5 and imported into StatView 4.5. After shearing, the DNA was ligated into pUC118 to form a library. Eighty-four inserts from the library were measured by PCR amplification and analysis of product size on an agarose gel. (B) A frequency distribution of the insert size. The dark line shows the normal curve that was calculated as the best fit for the data. The shaded line shows a densitometer trace of the electrophoretogram in A. The data in B are plotted such that the tick marks on the x-axis line up approximately with the DNA size markers in A.
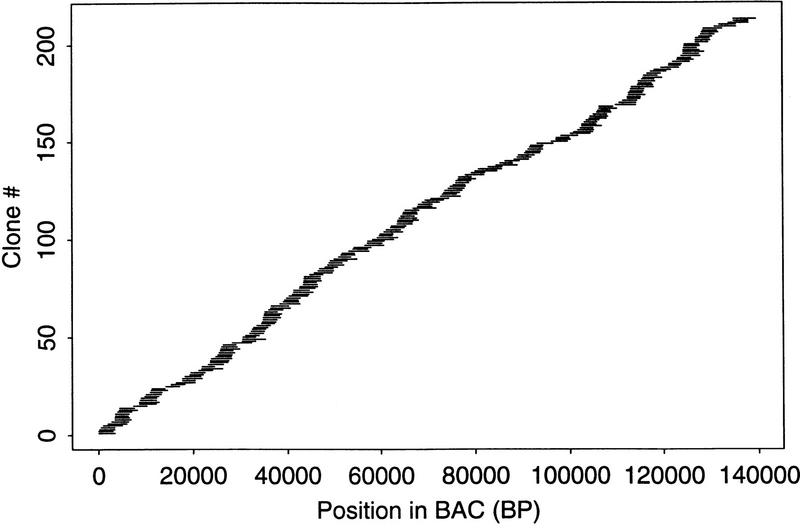
To obtain one measure of the randomness of a library constructed from sheared DNA fragments, assembled sequences from BAC clone B277H22 (human chromosome 4) were examined for coverage. Figure 8 shows the assembled distribution of clones in the library. A simulation was developed to determine a statistic for the degree of randomness in the clone distribution (A. Olshen, pers. comm.). Drawing from a hypothetical pool of clones with lengths equal to those observed in the actual library, 1000 simulations were performed and the distribution of coverage was computed for each. The χ2 statistic was used to measure the difference between the observed and the expected coverage. Comparing the χ2 statistic of the real data with the distribution of the χ2 statistics of the real data with the distribution of the χ2 statistics from the simulations leads to a test of the null hypothesis that the real clones were positioned randomly. The P value was 0.138, so we do not reject the null hypothesis that the clones were randomly distributed.
Figure 8.
Clone distribution of sheared inserts sequenced and assembled from human BAC B227H22. Sheared DNA from the 140-kb BAC clone was cloned into a plasmid vector, and both ends were sequenced. The sequences were assembled, and the position of each insert in the assembly was determined by aligning the forward and reverse reads from each clone. Each horizontal line represents one insert and its position in the assembly relative to the others.
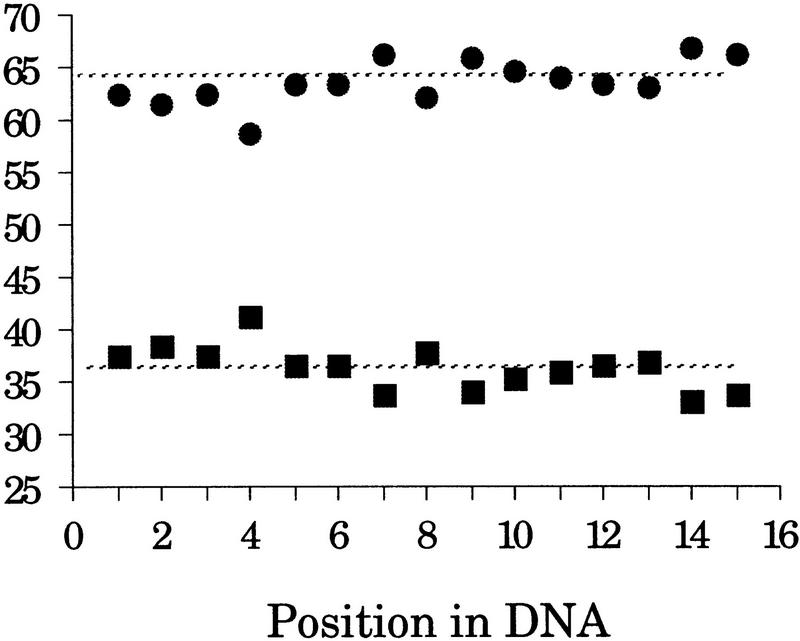
Given the number of downstream cloning steps where bias may be introduced in a library, a measure of clone distribution cannot be used reliably as a measure of randomness for the sheared inserts. A better measure of randomness may be obtained by examining the sequence at the ends of the sheared inserts for bias. Specifically, the average GC and AT content at positions 1–15 (relative to the end of the insert) was calculated and compared with the average AT and GC content of all the inserts (Fig. 9). For example, at position 1, there were 339 adenine or thymine in 544 inserts, or 62%. In comparison, the average AT content across all the inserts at all positions, shown as a broken line in Figure 9, was 64%.
Figure 9.
Percent AT (•) and GC (▪) content at the last 15 bp of sheared inserts. Sheared genomic DNA was cloned into a plasmid vector and sequenced by Dye Primer chemistry on ABI 373 or 377 instruments. The first 15 bases of 544 insert sequences were imported into StatView 4.5 (Abacus, Berkeley, CA). The percent AT and GC content was determined for each position from the end of the insert and compared to the overall AT and GC content, and the results were displayed graphically.
Carryover contamination from one sample to the next was controlled by use of an acid/base wash protocol developed by P. Oefner (Oefner et al. 1996). After each sample, first dilute acid (0.2 m HCl) was introduced to hasten DNA depurination; then dilute base (0.2 m NaOH) was added to denature it; then, the base was washed away thoroughly with several volumes of buffer or water. In theory, any contaminating DNA remaining in the system would consist of merely single-stranded stretches of pyrimidines that would not be clonable. Because we used total λ genomic DNA as a size standard to define shearing conditions, existence of λ DNA sequences in a library would be indicative of carryover contamination. In a FASTA analysis (Pearson and Lipman 1988) of three different libraries representing ∼46,000 different clones, there were no sequences with a significant match to λ. Therefore, no measurable amount of carryover contamination was observed.
DISCUSSION
The PtS is a simple instrument that produces randomly sheared fragments of DNA suitable for shotgun sequencing and related applications. The instrument can be assembled from commercially available parts with minor modifications and some machined parts for about $1500, or it can be purchased fully assembled and supported from GeneMachines (http://www.genemachines.com).
The instrument was created to improve on an idea developed by Oefner et al. (1996). They modified an HPLC pump to shear DNA by recirculating it through a length of tubing with a very small diameter (0.0025 in. or 64 μm). The resulting DNA fragments were randomly sheared, readily clonable, and tightly distributed in size. Unfortunately, the procedure was time consuming, and sample recovery was low.
The greatly simplified procedure and improved recovery reported here were obtained by substituting a computer-controlled syringe pump for an HPLC pump. Recirculation was simulated by passing the sample back and forth through the orifice for 20 iterations. Washing steps were performed much more quickly, and automation of shearing reduced hands-on time. In addition, small samples (50–450 μl) were quantitatively recovered without dilution. The attractive features of the HPLC-based device were retained with the minor exception that 500–1000 bp was the smallest size range observed, compared with 300–600 bp in the HPLC.
DNA fragmentation in the PtS was very reproducible day to day. The sheared size was directly proportional to orifice size and inversely proportional to flow rate. Single-stranded DNA sheared more readily than double-stranded DNA in most cases, and the size distribution of sheared DNA was very tight. Ninety percent of the sheared fragments fell within a two-fold size range.
Conditions for instrument operation were very flexible. Shearing was not altered over a wide range of temperatures, DNA concentrations, salt concentration in the sample buffer, or most sample volumes. If the sample volume was <100 μl, the final sheared size could be determined accurately by calibration at the desired volume.
In addition, the size of the starting material did not affect the final sheared size. Any two DNAs sheared under the same conditions, be they cosmid or YAC or total genomic DNA, yielded fragments with the same size range. This is consistent with the idea that the velocity gradient at the orifice causes the DNA to stretch past its breaking point when one part of a molecule moves faster than another. In this scenario, the distance between the ends of the DNA is irrelevant because the force is generated locally on each molecule.
There are several advantages to using sheared DNA for a shotgun sequencing approach. (1) Sheared DNA fragments may be obtained in ∼15 min; (2) almost the entire undiluted sample may be recovered after shearing in volumes down to 50 μl; (3) neither size selection nor end repair is necessary to obtain an acceptable number of clones for a sequencing project; and (4) the sheared inserts show no bias, either at the level of sequence or at the level of contig assembly. The amount of crossover contamination from one library to the next was <1/104 when an appropriate wash protocol was used.
The instrument has been used mainly to produce DNA fragments for sequencing libraries, but there are many other possible applications. Any other type of library or any application that requires random DNA fragments could be improved by using sheared DNA. For example, in vitro DNA binding assays often use partial restriction enzyme digestion to generate target fragments with maximum binding activity. Such assays suffer disadvantages (nonrandomness, uncontrollable size range) that are obviated with shearing.
METHODS
Instrument Design
The PtS was composed of a fluid driver (Cavro XL3000 syringe pump, 724020 or 724026, Sunnyvale, CA), RS-232 power supply (Cavro 723914), and controlling software. The syringe pump was fitted with a 500-μl glass syringe with a ¼-inch no. 28 flat-bottomed screw fitting (Hamilton Company, Reno, NV). The syringe was attached to the pump driver arm with a small custom fitting. A sketch of the instrument is shown in Figure 1. Images of the shearing device and a movie of the instrument in operation are available at http://sequence-www.stanford.edu/group/techdev/shear.html.
The syringe pump could be driven from 600 to 1.2 sec per stroke (0.05–25 ml/min with the 500-μl syringe). Flow rates were determined empirically and were found to be very similar, but not identical, to the rates reported by the manufacturer, Cavro (Appendix A of Operator’s Manual). The flow rates reported here are the experimentally derived values. In practice, the DNA sheared when subjected to flow rates from 3 to 22 ml/min. At higher flow rates, the motor that drives the syringe piston was often overloaded by too much backpressure. This limitation restricted the maximum flow rate for any given shearing assembly.
The controlling software was based on the Tool Command Language, TCL, which has been used for other instrumentation controls in this laboratory (S.P. Hunicke-Smith and D. Mosedale, unpubl.). The software allowed full control over the pump velocity, acceleration and deceleration, as well as grouping of commands for repeated operations. Its open software architecture can easily be changed for further automation.
The Teflon tubing in the system was generally 0.030 in. i.d., 0.0625 in. outer diameter (o.d.) (part 1520XL, Upchurch Scientific) except for the small length used between the output port of the switching valve and the shearing assembly. For that connector piece, a tubing with a smaller inner diameter (0.020 in. i.d., part 1548, Upchurch Scientific) was used to minimize the void volume in the system. In addition, it was useful to use a larger diameter tubing at the outlet when sample volumes were >200 μl.
The flow constriction that created the point–sink sheer stress was formed by either a ruby jewel (RB-22114, RB-22021, or RB-22029, Bird Precision) or a small-bore tubing of 2–4 mm in length (0.0025 in. i.d. PEEK, part 1560, Upchurch Scientific). The orifice was oriented and held in the flow path by compression between Teflon tubing in a Tefzel Union with PEEK nuts and flangeless ferrules (parts P-603, P-204X, and P-200NX, Upchurch Scientific).
Sample processing through the system was facilitated by the use of a right-angle bulkhead mount switching valve (model V-101L, 500 psi, Upchurch Scientific, Oak Harbor, WA). One valve port was used for sample input, and another for flow into the point–sink pathway. The switching valve was mounted on the syringe pump with a custom-made bracket. Alternatively, a more robust, custom-built, switching valve is also available (HSA-05-V, GeneMachines, Redwood City, CA).
For experiments involving elevated temperature, a rectangular silicone rubber heater (model SRFG-136, Omega Engineering, Stamford, CT) was wound around the syringe, valve, and tubing. A BK precision model 2706 multimeter was used to read a K-type thermocouple placed in direct contact with the tubing between the valve and the shearing assembly. After loading a sample, the temperature was allowed to stabilize for a few minutes before beginning a run.
Instrument Operation
Operation of the PtS was very simple. The basic protocol required five steps that are described in more detail below.
Calibrate the shearing assembly to determine the relationship between pump speed and DNA size (only required for the initial setup).
Wash the system to remove contaminating nucleic acids.
Set the appropriate parameters for shearing.
Start the automated shearing program.
Collect the sample.
Wash again.
All of the operations except the initialization of the instrument and calling the shearing program were prompted to the user by the DOS-based software. This feature made it very easy to instruct newcomers in the protocol.
Calibration of the instrument was achieved by shearing a test sample in the instrument at a minimum of three different flow rates to obtain a curve describing the relationship between flow rate and size. The typical test sample used was a solution of phage λ genomic DNA at a concentration of 50 μg/ml. Any test sample could have been used because the size of the starting material does not affect the final size of the sheared DNA.
The entire system was carefully washed between samples to prevent contamination from one sample to the next. This was accomplished by the sequential flushing of 1 ml of 0.2 m HCl, 1.5 ml of 0.2 m NaOH, and 2.5 ml of buffer immediately before and after each shearing run.
Typically, the only parameters that needed to be set by the user were the sample volume, the pump speed, and the total number of iterations (passes) through the system. About 20 iterations were necessary to achieve the maximum shearing for any given shearing assembly at any given flow rate.
The automated part of the program performed the steps necessary to process the DNA sample through the shearing assembly at the appropriate flow rate and for the appropriate number of iterations. Once started, the program required no monitoring and took ∼15 min. Sample collection was achieved by two operations that were prompted to the user at the end of the run.
Molecular Biology Techniques
Shearing of double-stranded DNA was assayed by separation of fragments in a 1% agarose gel by electrophoresis at 10 V/cm of gel. DNA molecular weight markers were either λ cleaved with HindIII or a kilobase molecular weight marker purchased from GIBCO BRL (15615-016). Single-stranded DNA was assayed for size by separation on a 1.0% denaturing agarose–formaldehyde gel prepared as described in Ausubel et al. (1995). RNA Millenium markers (no. 7150, Ambion, Inc., Austin, TX) corrected for the average RNA/DNA size difference, were used as molecular weight standards for single-stranded DNA.
Sequencing libraries were prepared in either M13 or pUC118 vectors by standard cloning methods (Maniatis, et al. 1982). Briefly, DNA to be sequenced was purified, resuspended in 10 mm Tris buffer (pH 8.0), and sheared as described above. Where indicated, the sheared DNA was treated with T4 DNA polymerase to fill in any nonblunt ends. The sheared DNA was ligated to the adaptor created by annealing the two oligonucleotides 5′ pTGAGTCACCAAAC and 5′ GTGACTCA. The HindIII-digested vector DNA was ligated to the linker 5′ pAGCTGTTTG, and both the insert–adaptor and the vector–linker pairs were gel purified. The DNA concentrations were determined by UV absorbance at 260 nm using a Beckman DU640B spectrophotometer. Finally, they were ligated at an insert/vector ratio of 1:1 to 10:1 and transformed by electroporation into E. coli DH12-S Electromax competent cells (Life Technologies 18312-017). More details can be found on the Stanford Genome Center web site: www-sequence.stanford.edu/protocols/library.html.
Acknowledgments
We thank the members of the Stanford DNA Sequencing and Technology Center, particularly Sue Kalman, Melinda Au, and Vesna Bivolarevic, for their help with sequencing and other protocols. Thank you also to Elisa Leberis at Genemachines, Rob Lagace at Incyte Pharmaceuticals, Jin Shang, Jeremy Schmutz, John Quackenbush, Jian-Bing Fan, and Annu Maratukulam at the Stanford Human Genome Center for helpful discussions. Adam Olshen at the Stanford Human Genome Center generously designed and performed a simulation for statistical analysis of sheared insert distribution. Finally, we would like to thank Gladys Range at the Institute for Genomic Research for suggesting that the ruby jewel orifice could be press-fit into plastic before being mounted into a shearing assembly. The part can be ordered from GeneMachines (HSA-03-025) or directly from Bird Precision (RB-82206-0025). This work was supported by a grant from the National Institutes of Health (HG00205).
The publication costs of this article were defrayed in part by payment of page charges. This article must therefore be hereby marked “advertisement” in accordance with 18 USC section 1734 solely to indicate this fact.
Footnotes
E-MAIL yvonne@sequence.stanford.edu; FAX (650) 812-1975.
REFERENCES
- Anderson S. Shotgun DNA sequencing using DNase I-generated fragments. Nucleic Acids Res. 1981;9:3015–3027. doi: 10.1093/nar/9.13.3015. [DOI] [PMC free article] [PubMed] [Google Scholar]
- Ausubel FM, Brent R, Kingston RE, Moore DD, Seidman JG, Smith JA, Struhl K, editors. Current protocols in molecular biology. New York, NY: John Wiley and Sons; 1995. [Google Scholar]
- Bodenteich A, Chissoe S, Wang Y-F, Roe BA. Shotgun cloning as the strategy of choice to generate templates for high throughput dideoxynucleotide sequencing. In: Adams MD, Fields C, Venter C, editors. Automated DNA sequencing and analysis techniques. London, UK: Academic Press; 1994. pp. 42–50. [Google Scholar]
- Cavalieri LF, Rosenberg BH. Shear degradation of deoxyribonucleic acid. J Am Chem Soc. 1959;81:5136–5139. [Google Scholar]
- Deininger PL. Random subcloning of sonicated DNA: Application to shotgun DNA sequence analysis. Anal Biochem. 1983;129:216–223. doi: 10.1016/0003-2697(83)90072-6. [DOI] [PubMed] [Google Scholar]
- Maniatis T, Fritsch EF, Sambrook J. Molecular cloning: A laboratory manual. Cold Spring Harbor, NY: Cold Spring Harbor Laboratory; 1982. [Google Scholar]
- Oefner PJ, Hunicke-Smith SP, Chiang L, Dietrich F, Mulligan J, Davis RW. Efficient random subcloning of DNA sheared in a recirculating point–sink flow system. Nucleic Acids Res. 1996;24:3879–3886. doi: 10.1093/nar/24.20.3879. [DOI] [PMC free article] [PubMed] [Google Scholar]
- Pearson WR, Lipman DJ. Improved tools for biological sequence comparison. Proc Natl Acad Sci. 1988;85:2444–2448. doi: 10.1073/pnas.85.8.2444. [DOI] [PMC free article] [PubMed] [Google Scholar]


