

Abstract
We have established a collection of strong molecular cytogenetic markers that span the mouse autosomes and X chromosome at an average spacing of one per 19 Mb and identify 127 distinct band landmarks. In addition, this Mouse Molecular Cytogenetic Resource relates the ends of the genetic maps to their chromosomal locations. The resource consists of 157 bacterial artificial chromosome (BAC) clones, each of which identifies specific mouse chromosome bands or band borders, and 42 of which are linked to genetic markers that define the centromeric and telomeric ends of the Whitehead/MIT recombinational maps. In addition, 108 randomly selected and 6 STS-linked BACs have been assigned to single chromosome bands. We have also developed a high-resolution fluorescent reverse-banding technique for mouse chromosomes that allows simultaneous localization of probes by fluorescence in situ hybridization (FISH) with respect to the cytogenetic landmarks. This approach integrates studies of the entire mouse genome. Moreover, these reagents will simplify gene mapping and analyses of genomic fragments in fetal and adult mouse models. As shown with the MMU16 telomeric marker for the trisomy 16 mouse model of Down syndrome, these clones can obviate the need for metaphase analyses. The potential contribution of this resource and associated methods extends well beyond mapping and includes clues to understanding mouse chromosomes and their rearrangements in cancers and evolution. Finally it will facilitate the development of an integrated view of the mouse genome by providing anchor points from the genetic to the cytogenetic and functional maps of the mouse as we attempt to understand mutations, their biological consequences, and gene function.
The achievements of the human and mouse genome projects provide increasing numbers of genes and phenotype-associated mutations (DeBry and Seldin 1996; Schuler et al. 1996). Linking the normal and mutant forms of the genes with their functions remains one of biology’s great challenges. To do this the DNA sequence must be defined ultimately with respect to the chromosomal location of the genes, a task that is facilitated by the many disease models available for study in the mouse. Although the genetic map of the mouse provides a powerful tool to link mutations and diseases with the genes (Dietrich et al. 1996), cytogenetic analysis is essential to define genes associated with chromosomal rearrangements. Molecular cytogenetic analysis, which has been exploited widely for localizing cloned genes, genomic sequences, and disease-related chromosomal rearrangements in the human, has not proven as useful in murine genetics. Whereas human genes and breakpoints can be rapidly and accurately mapped cytogenetically (X.-N. Chen, S. Mitchell, Z.-G. Sun, D. Noya, S. Ma, G.S. Sekhon, K. Thompson, W.T. Hsu, P. Wong, N. Wang et al., unpubl.), the common morphology and less distinct landmarks of mouse chromosomes have combined with the lack of molecular cytogenetic markers to hamper similar analyses in the mouse.
To bridge the gap between molecular and cytological methods, previous studies have developed a number of reagents for mouse chromosome identification. These include whole-chromosome reagents (Breneman et al. 1993; Weier et al. 1994; Rabbitts et al. 1995; Liyanage et al. 1996; Xiao et al. 1996) and cosmid or P1 clones used with repeat-sequence-based alternatives to dye-based banding techniques (Boyle et al. 1990). Additionally, mouse yeast artificial chromosome (YAC) and P1 clones have been used to generate chromosome-specific probes through FISH and DAPI counterstaining (Mongelard et al. 1996; Shi et al. 1997).
This report combines the products of the mouse genome project with molecular cytogenetic techniques to generate a new set of reagents, bacterial artificial chromosome (BAC) clones with a subset linked to centromeric and telomeric genetic markers. These serve to identify mouse chromosomes 1–19 and X, to fluorescently tag the ends of their genetic maps, and to define multiple band landmarks on each chromosome with unique BACs. The stability of BAC clones, the ease of BAC DNA purification, and the strong fluorescence in situ hybridization (FISH) signals resulting from the large insert size, make them superior molecular cytogenetic reagents (Korenberg and Chen 1995; X-.N. Chen, S. Mitchell, Z.-G. Sun, D. Noya, S. Ma, G.S. Sekhon, K. Thompson, W.T. Hsu, P. Wong, N. Wang et al., unpubl.). By including BAC clones that span each chromosome and contain markers from the ends of the genetic maps, the collection serves to integrate cytogenetic, genetic, and physical maps. The availability of such probes extends mouse analysis to interphase, and facilitates the rapid definition of chromosomal rearrangements and their associated candidate genes.
RESULTS
Mouse Chromosome Reverse Banding
We have developed methods for high-resolution R banding of mouse chromosomes that are compatible with FISH and are a modification of methods developed for human chromosomes (Korenberg and Chen 1995). The technique employs chromomycin A3 and distamycin staining combined with high-resolution mouse chromosome preparations to generate reproducible patterns defining each chromosome. These are illustrated in Figure 1 and compared to the standard mouse Giemsa banding patterns. There is a clear inverse relationship between R and G banding patterns, seen most readily in chromosomes 1, 2, 4, 5, 9, 10, 12, 15, 16, 17, and 19, just as when these methods are used with human chromosomes. However, in contrast to G banding, this fluorescent method is compatible with FISH (Korenberg and Chen 1995). This is shown in Figure 2, in which mouse R-banding patterns and FISH signals are concurrently seen clearly.
Figure 1.

Mouse reverse-banded haploid karyotype produced from a single cell using chromomycin A3/distamycin A. For each chromosome pair, the left one shows the fluorescent R-band pattern; the right shows the typical Giemsa band pattern.
Figure 2.
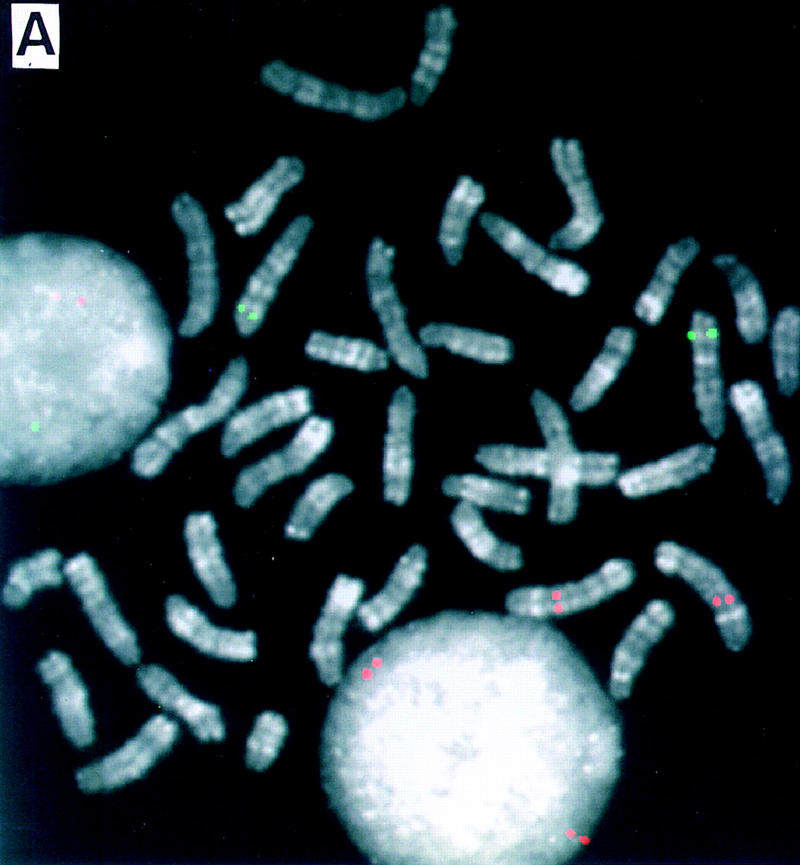
Dual-color FISH mapping of BACs on high-resolution reverse-banded mouse chromosomes. Two differently labeled BACs (biotin and digoxigenin) were cohybridized and detected simultaneously on R-banded chromosomes. (A) BAC 412F6 (green) maps on MMU6F2-3; BAC 412E19 (red) maps on MMU2C2. (B) BAC 412G6 (green) maps on MMU2H4; 412F19 (red) maps on MMU1C2.
Mouse FISH
Using these methods we employed FISH to assign mouse BACs to mouse banding landmarks. To decrease background, hybridization conditions were modified to include both human and mouse Cot1 unlabeled DNA. Using these conditions, signals were observed on two chromatids of each chromosome in an average of >80% of cells with a minimum of 20 cells examined. Band assignments were made independently by at least two individuals according to the banding patterns on photographs for each BAC. Questions of assignment were resolved by using centromere- and/or telomere-specific BACs in further experiments.
Building a Collection of FISH-Mapped BACs
Our technique for R banding mouse chromosomes provides a simple method for establishing a molecular cytogenetic reference system to facilitate the analysis of mouse chromosomes. We therefore undertook establishment of a set of FISH-mapped BACs, in part linked to the genetic map, that would provide reagents for mouse mapping and chromosome analysis. One hundred sixty-seven BAC clones were analyzed, of which 157 gave detectable signals on mouse chromosomes. Of these, 108 were selected at random and 49 were obtained by library screening with genetic markers, 43 from the ends of the genetic maps, and 6 to fill gaps in the distribution of randomly selected clones. In each case individual colonies were isolated prior to DNA preparation to avoid confusion arising from potential cross-well contamination of clones.
Identification of BAC Clones Associated with the Ends of Each Chromosome
PCR-based screening was performed on BAC DNA library pools representing 0.1–1.0× genome equivalents. Up to 15 markers located close to the end of the genetic maps were used in the screening, allowing us to identify from one to four BACs for at least one marker at each chromosome end. Single colonies were confirmed using PCR to contain each marker prior to FISH testing. From these clones, 43 BACs with an average insert size of 135 kb have been selected as containing genetic markers defining the centromeric and telomeric ends of mouse chromosomes 1–19 and X as listed in Table 1. FISH mapping these clones on R-banded metaphase chromosomes demonstrated that all except one from the chromosome 3 telomeric region hybridized only to the region corresponding to the location of the marker on the genetic map. Of the two clones isolated with the two different chromosome 3 telomeric markers, one was specific (and was therefore included in the telomeric set) and the second hybrized to the centromeric region of chromosome 1 (1A3) in addition to the chromosome 3 telomeric region. The clones, their chromosomal location, insert sizes, and the genetic markers used to isolate them are displayed in Table 1. Simultaneous hybridization of clones from the end of each chromosome is shown in Figure 3, with the centromeric clones displayed in red and the telomeric clones shown in green. This collection of clones represents a set of genetically anchored reagents that permit unambiguous identification and orientation of each chromosome end.
Table 1.
BACs Identifying Centromeric and Telomeric Chromosome Ends
| Chromosome centromeric/ telomeric | Marker | BAC address | Insert size (kb) | Distance to closest map end (cM) | Cytogenetic band location |
|---|---|---|---|---|---|
| 1C | D1Mit316 | 45C1 | 125 | 3.3 | 1A2-3 |
| 1T | D1Mit510 | 39L15 | 140 | 2.1 | 1H6 |
| 2C | D2Mit31 | 49N22 | 175 | 7.7 | 2A2 |
| 2T | D2Mit457 | 20L10 | 150 | 0 | 2H3-4 |
| 3C | D3Mit150 | 33D15 | 90 | 2.2 | 3A2 |
| 3C | D3Mit130 | 52H9 | 175 | 4.4 | 3A2 |
| 3T | D3Mit303 | 443K17/432H2 | 155 | 2.2 | 3H4 |
| 4C | D4Mit315 | 39B18 | 135 | 2.2 | 4A2-3 |
| 4T | D4Mit313 | 362D3 | 200 | 4.4 | 4E1 |
| 5C | D5Mit145 | 48H24 | 145 | 0 | 5A1-A2 |
| 5T | D5Mit192 | 40J4 | 145 | 0 | 5G3 |
| 6C | D6Mit83 | 45K20 | 180 | 3.3 | 6A3 |
| 6T | D6Mit137 | 51F24 | 145 | 3.3 | 6G2 |
| 7C | D7Mit340 | 43A19 | 100 | 1 | 7A2 |
| 7T | D7Mit293 | 100O21 | 100 | 0 | 7F4 |
| 8C | D8Mit217 | 20H8 | 170 | 4.4 | 8A3 |
| 8T | D8Mit278 | 38K2 | 160 | 5.5 | 8E2 |
| 9C | D9Mit59 | 23D13 | 130 | 0 | 9A4-A5 |
| 9T | D9Mit152 | 55J6 | 135 | 0 | 9F4 |
| 10C | D10Mit49 | 47K7 | 100 | 0 | 10A2 |
| 10T | D10Mit269 | 26C12 | 110 | 1.1 | 10D3 |
| 11C | D11Mit106 | 39E20 | 90 | 3.3 | 11A2 |
| 11T | D11Mit184 | 434L24 | 125 | 5.5 | 11E1-2 border |
| 12C | D12Mit197 | 47N14 | 125 | 2.2 | 12A2-3 border |
| 12T | D12Mit41 | 34I19 | 130 | 0 | 12F2 |
| 13C | D13Mit300 | 50K9 | 145 | 1.1 | 13A2 |
| 13T | D13Mit214 | 38I3 | 145 | 8.7 | 13D2 |
| 14C | D14Mit220 | 429N17 | 160 | 1.1 | 14A2-3 border |
| 14T | D14Mit107 | 48O2 | 95 | 0 | 14E4 |
| 15C | D15Mit179 | 43G16 | 155 | 7.7 | 15A2 |
| 15T | D15Mit161 | 62I2 | 175 | 0 | 15F3 |
| 16C | D16Mit79 | 50I1 | 160 | 3.3 | 16B2-3 border |
| 16T | D16Mit52 | 43D12 | 195 | 0 | 16C4 |
| 17C | D17Mit156 | 65C22 | 110 | 1.1 | 17A2 |
| 17T | D17Mit76 | 50F18 | 140 | 2.2 | 17E5 |
| 18C | D18Mit31 | 53M14 | 140 | 2.2 | 18B2-3 border |
| 18T | D18Mit145 | 51B23 | 95 | 0 | 18E4 |
| 19C | D19Mit109 | 26B5 | 90 | 1.1 | 19B |
| 19T | D19Mit50 | 49P14 | 105 | 13.1 | 19D2 |
| XC | DXMit190 | 51A6 | 125 | 6.6 | XA2 |
| XT | DXMit183 | 23H12 | 140 | 11.76 | XF4 |
The genetic markers used to identify them, and the assigned map location are listed. Marker names are from MIT Genetic Maps (11/98). Web site: http://www-genome.wi.mit.edu. Chromosome band location was determined by reverse banding. Clones are available from Research Genetics and J.R. Korenberg (this paper) FISH positions are illustrated in Fig. 3.
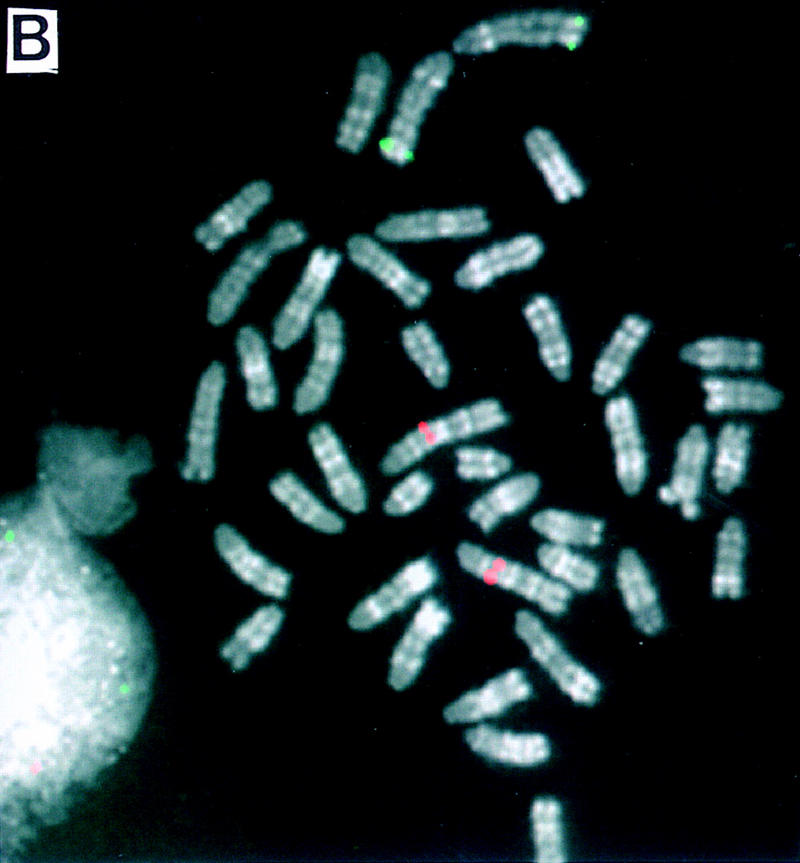
Figure 3.
Composite mouse karyotype illustrating fluorescence signals from simultaneous hybridization of BACs linked to genetic markers defining the centromeric and telomeric ends of the genetic maps. Centromeric clones are shown in red; telomeric clones in green.
FISH Mapping BACs Spanning the Mouse Genome
To generate a set of clones spanning each chromosome and linked to defined cytogenetic landmarks, BAC clones were selected at random for mapping. Of these, 99 BACs were localized to single mouse metaphase band landmarks and 9 BACs to two sites on different chromosomes. For the clones with second sites, the primary location was defined as that showing the higher proportion of signals (>80%) or with the larger signal as judged visually. Nonetheless, all secondary sites were based on the observation of signals in >30% of cells and the clones listed with secondary sites are likely an underestimate. In the cases that a BAC showed hybridization to two sites, single clones were reisolated and confirmed by FISH to map at the same two sites. Detailed analysis of these clones would be needed to determine if their hybridization to multiple sites was the result of low-copy repeated sequences or artifacts introduced in the cloning process, for example, cocloning of fragments producing chimeric clones. Regardless, these clones are useful in defining specific points on mouse chromosomes.
To fill in gaps in the distribution of these randomly selected clones, six additional BACs containing genetic markers were obtained through library screens (described below). Figure 4 displays the chromosomal location of each of the FISH-mapped clones, including those that contain genetic markers and those selected at random. Together these clones comprise a collection of >157 FISH-mapped BACs that specifically identify the centromeric and telomeric ends of each mouse chromosome and a minimum of 127 distinct band landmarks. The map position of these clones is shown in Table 2. These clones can now be used for molecular cytogenetic analyses of chromosome rearrangements, gene mapping, and aneuploidy studies using mouse models.
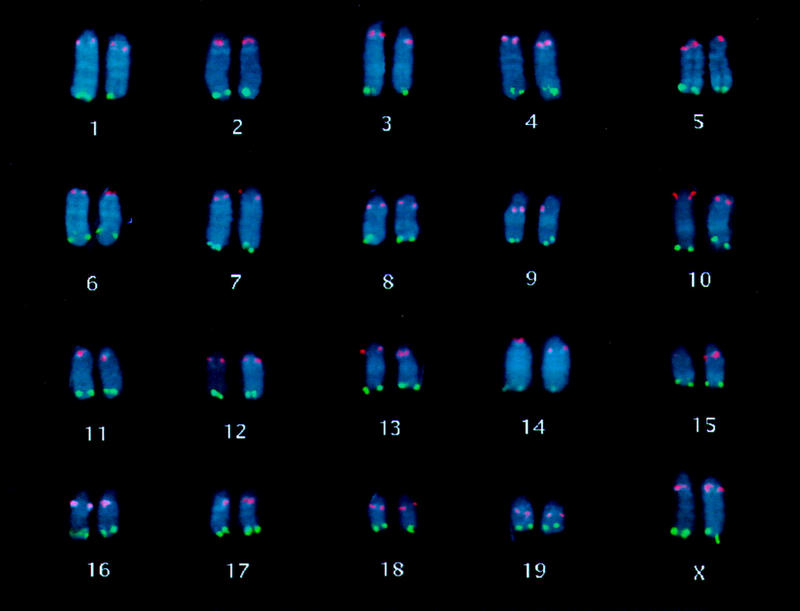
Figure 4.
Ideogram of the integrated BAC resource for mouse cytogenetics. The locations of the 157 FISH-mapped BACs are shown relative to the fluorescent R-banded mouse chromosomes. Those clones containing centromeric and telomeric genetic markers are represented by blue boxes; clones mapped at random and clones containing markers from the chromosome arms are represented as red circles. Clones with two sites of hybridization are represented as target circles for the primary signal and open circles for the secondary signal.
Table 2.
BACs Mapped to Chromosome Arms
| Clone name | Mapping | Genetic marker | Clone name | Mapping | Genetic marker | Clone name | Mapping | Genetic marker |
|---|---|---|---|---|---|---|---|---|
| 200E6 | 1A3 | 56F13 | 5E5–F | 1D3 | 12B | |||
| 200M12 | 1A3 | 201E9 | 5F | 412D22 | 12C2 | |||
| 371A12 | 1A3&(3H4) | D3Mit129 | 49P3 | 5F | D5Mit93 | 55K12 | 12D3 | |
| 1C1 | 1A3–A4 | 412C12 | 5G3 | 201E12 | 12D3&(15C) | |||
| 2 E10 | 1A5 | 412I6 | 6B3–C1 | 2E 1 | 12E | |||
| 200G3 | 1B | 412C22 | 6C3–D&(10C2) | 3B1 | 13A3 | |||
| 412K19 | 1B | 55E13 | 6E | 412I12 | 13B–C1 border | |||
| 412N6 | 1B | 58N7 | 6E | 55D13 | 13C1 | |||
| 412F19 | 1C2 | 412M6 | 6F1&(18E4) | 200C3 | 13C3 | |||
| 412I19 | 1C5–D border | 412F6 | 6F2–F3 | 41D19 | 13D1–D2 | |||
| 54I3 | 1D | 200E3 | 6G2 | 2A1 | 14A3 | |||
| 200M15 | 1D | 412B22 | 7A2 | 59M7 | 14B | |||
| 412J12 | 1F | 412O19 | 7A2–A3 | 412O12 | 14C2–C3 | |||
| 55O12 | 1F | 412E6 | 7B3 | 12B1 | 14C3–D1 | |||
| 123B5 | 1F&(2B) | 412F22 | 7B5&(5A3) | 412N12 | 14E1 | |||
| 54G13 | 1H5–H6 | 2 E4 | 7E | 412D19 | 14E3–E4 | |||
| 201E3 | 2A1 | 412J6 | 8A2 | 412G19 | 15D3 | |||
| 412E19 | 2C2 | 412O16 | 8A2 | 412M12 | 15E | |||
| 200I15 | 2D | 412B12 | 8B1 | 412L6 | 16B1 | |||
| 412J22 | 2F1 | 412G12 | 8B1&(7B3) | 55E12 | 16B3 | |||
| 412B19 | 2G–H1 | 55N18 | 8B3 | D8Mit30 | 200I3 | 16B5 | ||
| 123L13 | 2H1 | 58E9 | 8C3 | 58H9 | 16B5 | |||
| 54G21 | 2H1 | 412D12 | 8D1 | 54I2 | 16C2–C3 | |||
| 412G6 | 2H4 | 200M6 | 9A2 | 56M12 | 17B | |||
| 412L22 | 3A2 | 412N19 | 9A2 | 1D5 | 18A2–B1 | |||
| 412M22 | 3B–C | 434N15 | 9A2 | 412C19 | 18B1–B2 | |||
| 412D6 | 3E2 | 201K12 | 9A3 | 412I22 | 18D | |||
| 412C6 | 3E3 | 47D24 | 9D | D9Mit32 | 1D1 | 18E3–E4 | ||
| 412E22 | 3E3–F1 | 57K2 | 9D | D9Mit32 | 412H6 | 18E4 | ||
| 412M19 | 3F1 | 200E21 | 9F3–F4&(1B) | 56B13 | 18E4 | |||
| 201K18 | 3G | 54I1 | 10A4–B1 | 56O12 | 19B | |||
| 412K22 | 4A2–A3 | 201M18 | 10B1–B2&(1H5) | 412L19 | 19D1 | |||
| 9B1 | 4B1 | 414L22 | 10C1 | D10Mit16 | 412N22 | 19D1–D2 | ||
| 54G16 | 4B2 | 201G3 | 10D2 | 123O10 | XA2 | |||
| 55C13 | 4C6–C7 | 412J19 | 11A2 | 412H12 | XA4 | |||
| 412B6 | 4C7–D1 | 2A7 | 11B5–C border | 200K21 | XE | |||
| 55H13 | 4E2 | 412H22 | 11E2 | 51C20 | XF2–3 | DXMit171 | ||
| 55M13 | 4E2 | 123H11 | 12A2 | 338L10 | XF4 | |||
| 412G22 | 5A3–B |
Chromosomal map positions were determined by reverse banding as illustrated in Fig. 3.
The distribution of the 108 randomly mapped BACs left significant gaps on chromosomes 5, 8, 9, 10, 11, and X; therefore, genetic markers from these poorly covered regions were used to isolate BACs through library screens. Subsequent FISH and PCR testing confirmed that gaps on chromosomes 8, 9, and 10 were filled by STS-linked BACs mapping in the expected regions. These clones, their genetic markers, and map positions are shown in Table 2 and Figure 4. However, the STS-linked BAC predicted to map in the region of chromosome band 5D was found to map significantly distal, in 5F, and that predicted to map in the region of chromosome band XC, mapped significantly distal, in XF2–3. No signal was obtained from the putative chromosome 11 BAC.
Trisomy 16 Detection Using Chromosome-Specific BACs
The early definition of mouse fetuses and young adults carrying particular aneuploidies is useful for studies of development in which offspring with multiple karyotypes may be produced by a single mating and full cytogenetic analysis is both labor- and time-intensive and difficult. To determine the utility of this BAC resource for rapid definition of the trisomy 16 mouse models of Down syndrome, using interphase analysis, the BAC for the telomere (43D12) of MMU16 was hybridized to blood smears from an 18-day fetus (Reeves et al. 1986; Fig. 5). Of the 200 cells analyzed, >90% revealed three signals, in contrast to a control BAC from chromosome 14 that revealed three signals in <2% of cells.
Figure 5.
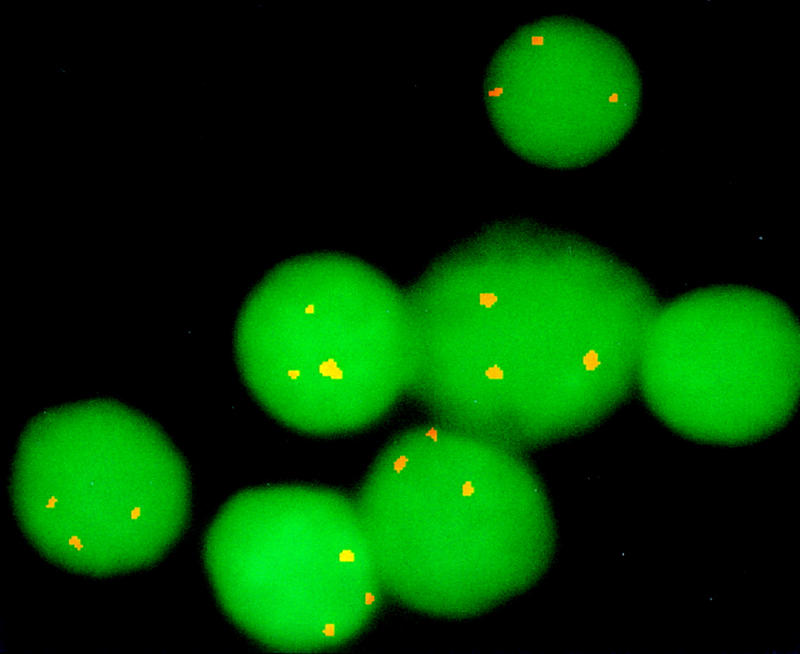
Trisomy 16 detected in interphase cells by the chromosome 16 telomeric BAC. BAC 43D12 linked to D16Mit52 was used to define cells from the Ts16 mouse model of Down syndrome. Three sets of FITC signals are clearly seen on 90% of interphase cells in contrast to probes from other chromosomes that produce just two pairs of signals (data not shown).
DISCUSSION
We have begun to establish an integrated molecular cytogenetic and genetic map of the mouse. We have done this by first developing mouse reverse-banding techniques that are reproducible and compatible with multiplex FISH. We have then utilized these techniques to create an Integrated Mouse Bacterial Artificial Chromosome Clone Resource for Molecular Cytogenetics (M-BAC), comprised of 157 BACs that span the mouse genome at about one marker per 19 Mb. These clones provide molecular cytogenetic markers for 127 chromosome band landmarks and link the centromeric and telomeric ends of chromosomes 1–19, and the X, as well as five chromosome arms to the genetic and physical maps.
Mouse Reverse Banding
Banding has been an essential tool for standard cytogenetics and multicolor fluorescence. The initial studies in this area used families of interspersed sequences as hybridization probes to provide a characteristic pattern for each chromosome (Boyle et al. 1990). The success of these procedures was dependent on the quality of the metaphase preparation, frequently poor in the mouse. The R-banding pattern described here defines each chromosome and provides a reference with which to rapidly place molecular cytogenetic markers on the map. As shown in Figures 1 and 2, the pattern is highly inversely correlated with the Quinacrine and DAPI fluorescence and Giemsa banding patterns, is generally of higher resolution than DAPI, and is compatible with multicolor FISH.
M-BAC Resource and the Genetic Maps
Mouse BACs are excellent cytogenetic reagents and BACs of known marker content are powerful identifiers of both chromosomal location and orientation of the integrated genetic, physical, and cytogenetic maps. Our results allow the correlation of map position for the STS-linked BACS on the genetic versus the cytogenetic maps. In all cases, the STS-linked BACs map in the telomeric band of a given chromosome. Determining the physical distance from the centromeric arrays will require the use of two-color studies employing markers for centromeric satellite DNAs. However, our studies permit direct comparison of the position of the hybridization signal relative to the telomeric ends. For BACs containing markers located close to the defined telomeric ends of the genetic map, for example, the BACs for the chromosome 2 telomere, located at 0.0 cM from the end and the chromosome 6 telomere, located at 3.3 cM from the end, there is a clear cytogenetic separation from the physical end of the chromosome. This observation suggests that the genetic markers do not lie close to the ends of the physical map in these regions. Conversely, some BACs containing markers located relatively far from the ends of the genetic maps consistently give FISH signals close to the telomere. Chromomycin banding and phase microscopy (Fig. 3) show that this is the case for the BACs containing markers for the X chromosome telomere, located 13.6 cM from the end, and the chromosome 12 telomere, located 8.7 cM from the end (Fig. 3). These regions may have higher than average rates of crossing over. The question of marking the approximate distance remaining between the end of the genetic and physical maps could now be approached by two-color metaphase analyses or more precisely, by two-color fiber-FISH using one of the BACs described in this report in combination with a telomeric oligonucleotide. This may be useful as an approach to cloning the ends of mouse chromosomes.
The combination of STS-linked markers from this molecular cytogenetic resource with a set generated while this report was in preparation (Shi et al. 1997) yields a total of 81 BAC and P1 markers, with one BAC and one P1 for each end of the genetic maps, and at least one of these occurring within 4 cM of a given terminus. For the chromosome arms, a set of STS-linked YACs (Mongelard et al. 1996) combined with our STS-linked BACs for 5 chromosomes brings the total of genetically anchored FISH probes to 105.
Utilizing clones from this resource as molecular cytogenetic markers in combination with R banding will provide the opportunity to accurately define chromosome number and rearrangements even in poor chromosome preparations in that single- or dual-color hybridization signals will be sufficient in the absence of chromosome structure. Finally, unlike the repetitive-sequence probes, the current set of chromosome and region-specific markers may be used for interphase analyses of both map position and genome- or cell-structure and function. This has been clearly illustrated by the use of the chromosome 16 telomeric BAC for pre- and postnatal determination of Ts16 fetal mice as shown in Figure 5. This will allow both the early identification of offspring carrying desired aneuploidies as well as the analysis of single tissues in chimeras and the evaluation of the appropriate mice in mixed transgenic litters. Achieving a greater density of well-characterized cytogenetic reagents across the mouse genome will facilitate high-resolution mapping of new sequences and provide a resource capable of revealing large-scale genomic changes in a variety of normal and disease states.
M-BAC Clone Genomic Distribution
The apparent clustering seen among the 108 BAC clones selected at random may be of interest with respect to the functional organization of the mouse genome, the small number of clones notwithstanding. Some regions with clusters of clones (e.g., the centromeric regions of chromosomes 1 and 9) are largely lacking known human homologies in contrast to some regions that are poorly covered by clones (e.g., the large central regions of chromosomes 5, 9, and 11) which have extensive regions of human homolgy. The clones mapped in these regions will provide DNA markers with which to establish homologies and complete the human–mouse maps.
Five BACs in this collection were identified as containing genetic markers from chromosome arms. Whereas all mapped on the correct chromosome, only three of them mapped in the general region predicted and two did not, one from chromosome 5 and one from the X. Although both were predicted to map in a central region of the chromosome, the clone on the X chromosome that contained the marker DXMit171 mapped to a subtelomeric position (XF2-3) and the clone containing the marker D5Mit93 mapped to 5F. Although this may indicate differences in the map between strains, it may also indicate that, at the current density of polymorphic markers, significant deviations may exist from a linear relationsip between genetic and physical distances.
Multiple-Site BACs and Chromosomal Duplications
Of the 108 BACs chosen at random, 9 (8.3%) mapped to more than one site (Table 2). These second sites were not located at regions of known repeated sequence but rather within a chromosome arm and the hybridization signals from additional sites were of lesser intensity and seen in a smaller proportion of cells than the signals from the primary sites of hybridization. Of the 43 BACs selected by telomeric or centromeric markers, one from the 3 telomeric marker recognized another site. Clones that hybridized to two sites were restreaked and retested routinely using DNAs from a new single colony. In every case the clone again hybridized to the same two sites, indicating that the clones contain sequences found in the multiple genomic locations. Although this may reflect chimerism, it may also reflect regions of true homology and multigene families in the mouse genome as has been shown for human BACs (J.R. Korenberg, X.-N. Chen, Z. Lai, D. Yimlamai, R. Bisighoni, and U. Bellugi, unpubl.) and for BACs carrying highly conserved low-copy duplicated regions (Nicolaides et al. 1995; Rouquier et al. 1998; J.R. Korenberg, X.-N. Chen, Z. Lai, D. Yimlamai, R. Bisighini, and U. Bellugi, unpubl.).
The occurrence of duplicated regions containing genes close to the telomere as well as close to centromeres has been shown recently in humans (Eichler et al. 1998) and the data presented in the current report suggest that similar mechanisms may exist in the mouse. The STS-linked clone carrying the marker from the chromosome 3 telomere but mapping to both this region of 3 as well as the centromeric region of 1 may indicate duplication of this region of the STS and provide a model system in which to study the existence of gene duplications caused by genomic duplications using large-scale sequencing efforts in the mouse.
The potential contribution of molecular cytogenetic methods extends well beyond mapping newly isolated genes and sequences. For example, there are specific cytogenetic rearrangements associated with natural or induced chromosomal aberrations, disease states, or model systems. These include translocations, deletions, inversions, and amplifications (Potter and Wiener 1992), as well as transgene integrations (Huxley et al. 1996), most of which are best characterized at the level of the metaphase chromosome. These map locations or breakpoints can now be defined accurately using this resource, to within an average of 10–20 Mb in the presence of poor chromosome preparations and by personnel without significant training in mouse cytogenetics. End sequencing of this resource followed by mapping on radiation hybrids will tighten the integration with the STS maps. The application of this resource will therefore be of significant value, not only for mouse model systems but also for large-scale mouse sequencing efforts, as potential entry points for sequencing and map construction, as a source of clones to fill in regions with few markers, and as an anchoring resource for map and clone confirmation.
The Integrated Mouse BAC Clone Resource described in this report is available from J.R. Korenberg et al. (this paper) and Research Genetics, Huntsville AL.
METHODS
BAC-Clone Isolation and DNA Preparation
All clones are from a 129 SV mouse BAC library (CITB CJ7B) cloned in the vector, BeloBAC11 (B. Birren, unpubl.) distributed by Research Genetics. A single colony was isolated from each of the randomly chosen clones after streaking bacteria from wells of the library plates. Clones associated with genetic markers were identified by screening DNA pools representing varying portions of the library using PCR (Dietrich et al. 1996). Typically, between 0.1 and 1.0 genomic equivalents were screened with a group of markers from each end of a given chromosome. After identification of a positive address, bacteria from the well of the library plates were streaked to obtain individual colonies and PCR was repeated using bacteria to verify STS content. Clones from isolated colonies were grown to saturation in LB containing chloramphenicol (12.5 μg/ml) and 10% glycerol, and frozen at −70°C for storage. DNA was prepared from 3-ml cultures grown to saturation in LB containing chloramphenicol (12.5 μg/ml) using an alkaline lysis procedure, either manually (Sheng et al. 1995) or using the Autogen 740 (Autogen, Inc.). Sizes for BAC clones were determined by NotI digestion and PFGE (Sheng et al. 1995).
Metaphase-Chromosome Preparation
High-resolution mouse metaphase chromosomes were prepared from spleens of female mice of the strains B6D2F1 and B6SJLF1 by using the method described by Boyle et al. (1992), modified by changes to the ethidium bromide and colcemid treatments. Briefly, we used a longer treatment with a lower concentration of ethidium bromide, and a shorter treatment with a 10× higher concentration of colcemid for mouse chromosomes. Mouse spleen cells (1 × 10⁶ to 2 × 10⁶) were cultured in RPMI 1640 medium supplemented with fetal bovine serum (20%), Con A (6 μg/ml) and 2-mercaptoethanol (150 μg/ml) for 48 hr. Ethidium bromide was added for 1 hr at a concentration of 5 μg/ml and colcemid was added for 15 min at a concentration of 1 μg/ml before a standard chromosome harvest procedure.
The blood smear containing interphase cells shown in Figure 5 was made from the buffy coat of blood derived from a 18 day mouse fetus carrying trisomy 16.
FISH
DNA prepared manually was treated with RNase A and extracted with phenol:chloroform prior to labeling, whereas DNA prepared by the Autogen was used directly. DNAs were labeled by nick translation in the presence of biotin-14-dATP or digoxigenin-11-dUTP, respectively, using nick translation. FISH was performed essentially according to the procedure described by Korenberg and Chen (1995), modified by the addition of mouse Cot1 DNA to suppress background. Prior to hybridization, mouse chromosome slides were treated with 100 μg/ml RNase followed by dehydration through a cold ethanol series (70%, 90%, and 100%) each for 2 min at 0°C, and denaturation by using 70% formamide and 2× SSC at 70°C for 2 min, followed by repeating the dehydration series. The probes were then applied to these pretreated mouse chromosome slides and hybridized at 37°C overnight. The hybridization mixture (50% formamide, 10% dextran sulfate, and 2 × SSC) contained 200 ng each of biotin and digoxigenin-labeled DNA probes as well as 3 μg of human Cot1 DNA, 3 μg of mouse Cot1 DNA (GIBCO BRL), and 4 μg of sonicated salmon sperm DNA in a total volume of 10 μl. Whereas the initial experiments include both human and mouse Cot1 DNA, later experiments successfully employed 3 μg of mouse Cot1 DNA for suppression.
Three posthybridization washes were performed at 40°C in 2× SSC and 50% formamide for 5 min each, followed by three washes in 1× SSC at 45°C for 5 min each. Slides were then incubated for 15 min at 37°C with 100 μl of 4× SSC containing 3% bovine serum albumin (BSA) and 0.1% Tween 20 for blocking. Hybridized DNAs were detected with avidin-conjugated fluorescein isothiocyanate (FITC) (Vector Laboratories, CA) at a concentration of 5 μg/ml in 4× SSC, 0.1% Tween 20, 1% BSA for biotinylated probes, and sheep-anti-digoxigenin-rhodamine (Boehringer Mannheim, IN) at a concentration of 0.4 μg/ml in 4× SSC, 0.1% Tween 20, and 1% BSA, for digoxigenin-labeled probes.
Chromosome counterstaining was performed using a modification of the human reverse banding technique (Korenberg and Chen 1995). Optimal staining for mouse chromosomes required longer staining with a lower concentration of Chromomycin A3, followed by shorter staining with a similar concentration of distamycin than for human chromosomes. Immediately following the last detection, slides were rinsed briefly in McIlvaine’s buffer (pH 9.0) (diluted with an equal volume of distilled water). For staining, 100 μl of chromomycin A3 (0.25 mg/ml in 50% McIlvaine’s buffer at pH 9.0) was placed on the slides for 90 min at room temperature in the dark. After staining, the slides were rinsed for 1 min in 50% McIlvaine’s buffer and excess fluid was shaken off. Slides were then placed in 50 μl of 0.1 mg/ml distamycin A for 30–60 sec at room temperature, followed again by rinsing in 50% McIlvaine’s buffer and removal of excess fluid.
For each clone, a minimum of 20 cells were evaluated to determine the chromosomal location and the percentage of cells showing signals. The images were captured and stored using a Photometrics Cooled-CCD camera (CH250) and BDS image analysis software (ONCOR Imaging, Inc., Gaithersburg, MD). For Figures 1 and 4 respectively, the Giemsa-stained chromosomes and mouse ideogram were taken from http://www.pathology.washington.edu/cytopages. The karyotype shown in Figure 3 was produced by merging representative images for each chromosome using the Applied Imaging System (Pittsburgh, PA).
Acknowledgments
This work was supported by Department of Energy (DOE) grants DE-FG03-92ER61402 (J.R.K.) and DE-FC03-96ER62294 (J.R.K.), National Heart, Lung, and Blood Institute (NHLBI) grant R01 HL50025 (J.R.K.), and National Human Genome Research Institute (NHGRI) RO1 HG00934 (B.W.B.). J.R.K. holds the Geri and Richard Brawerman Chair in Molecular Genetics. We thank Muriel Davisson for advice and Zheng-Yang Shi and Jennifer Lee for expert technical assistance.
The publication costs of this article were defrayed in part by payment of page charges. This article must therefore be hereby marked “advertisement” in accordance with 18 USC section 1734 solely to indicate this fact.
Footnotes
E-MAIL julie.korenberg@cshs.org; FAX (310) 652-8010.
REFERENCES
- Boyle AL, Ballard SG, Ward DC. Differential distribution of long and short interspersed element sequences in the mouse genome: Chromosome karyotyping by fluorescence in situ hybridization. Proc Natl Acad Sci. 1990;87:7757–7761. doi: 10.1073/pnas.87.19.7757. [DOI] [PMC free article] [PubMed] [Google Scholar]
- Boyle AL, Feltquite DM, Dracopoli NC, Housman DE, Ward DC. Rapid physical mapping of cloned DNA on banded mouse chromosome by fluorescence in situ hybridization. Genomics. 1992;12:106–115. doi: 10.1016/0888-7543(92)90412-l. [DOI] [PubMed] [Google Scholar]
- Breneman JW, Ramsey MJ, Lee DA, Eveleth GG, Minkler JL, Tucker JD. The development of chromosome-specific composite DNA probes for the mouse and their application to chromosome painting. Chromosoma. 1993;102:591–598. doi: 10.1007/BF00352306. [DOI] [PubMed] [Google Scholar]
- DeBry RW, Seldin MF. Human/mouse homology relationships. Genomics. 1996;33:337–351. doi: 10.1006/geno.1996.0209. [DOI] [PubMed] [Google Scholar]
- Dietrich WF, Miller J, Steen R, Merchant M, Damron-Boles D, Husain Z, Dredge R, Daly MJ, Ingalls K, O’Connor TJ, et al. A comprehensive genetic map of the mouse genome. Nature. 1996;380:149–154. doi: 10.1038/380149a0. [DOI] [PubMed] [Google Scholar]
- Eichler EE, Hoffman SM, Adamson AA, Gordon LA, McCready P, Lamerdin JE, Mohrenweiser HW. Complex beta-satellite repeat structures and the expansion of the zinc finger gene cluster in 19p12. Genome Res. 1998;8:791–808. doi: 10.1101/gr.8.8.791. [DOI] [PubMed] [Google Scholar]
- Huxley C, Passage E, Manson A, Putzu G, Figarella-Branger D, Pellissier JF, Fontes M. Construction of a mouse model of Charcot-Marie-Tooth disease type 1A by pronuclear injection of human YAC DNA. Hum Mol Genet. 1996;5:563–569. doi: 10.1093/hmg/5.5.563. [DOI] [PubMed] [Google Scholar]
- Korenberg JR, Chen X-N. Human cDNA mapping using a high resolution R-banding technique and fluorescence in situ hybridization. Cytogenet & Cell Genet. 1995;69:196–200. doi: 10.1159/000133962. [DOI] [PubMed] [Google Scholar]
- Liyanage M, Coleman A, duManoir S, Veldman T, McCormack S, Dickson RB, Barlow C, Wynshaw-Boris A, Janz S, Wienberg J, et al. Multicolour spectral karyotyping of mouse chromosomes. Nat Genet. 1996;14:312–315. doi: 10.1038/ng1196-312. [DOI] [PubMed] [Google Scholar]
- Mongelard F, Poras I, Usson Y, Batteux B, Robert-Nicoud M, Avner P, Vourch C. A mouse chromosome-specific YAC probe collection for in situ hybridization. Genomics. 1996;38:432–434. doi: 10.1006/geno.1996.0649. [DOI] [PubMed] [Google Scholar]
- Nicolaides NC, Carter KC, Shell BK, Papadopoulos N, Vogelstein B, Kinzler KW. Genomic organization of the human PMS2 gene family. Genomics. 1995;30:195–206. doi: 10.1006/geno.1995.9885. [DOI] [PubMed] [Google Scholar]
- Potter M, Wiener F. Plasmacytomagenesis in mice: Model of neoplastic development dependent upon chromosomal translocations. Carcinogenesis. 1992;13:1681–1697. doi: 10.1093/carcin/13.10.1681. [DOI] [PubMed] [Google Scholar]
- Rabbitts P, Impey H, Heppell-Parton A, Langford C, Tease C, Lowe N, Bailey D, Ferguson-Smith M, Carter N. Chromosome specific paints from a high resolution flow karyotype of the mouse. Nat Genet. 1995;9:369–375. doi: 10.1038/ng0495-369. [DOI] [PubMed] [Google Scholar]
- Rouquier R, Taviaux S, Trask BJ, Brand-Arpon V, van den Engh G, Demaille J, Giorgi D. Distribution of olfactory receptor genes in the human genome. Nat Genet. 1998;18:243–250. doi: 10.1038/ng0398-243. [DOI] [PubMed] [Google Scholar]
- Reeves RH, Gearhart JD, Littlefield JW. Genetic basis for a mouse model of Down syndrome. Brain Res Bull. 1986;6:803–814. doi: 10.1016/0361-9230(86)90076-6. [DOI] [PubMed] [Google Scholar]
- Schuler GD, Boguski MS, Stewart EA, Stein LD, Gyapay G, Rice K, White RE, Rodriguez-Tome P, Aggarwal A, Bajorek E, et al. A gene map of the human genome. Science. 1996;274:540–546. [PubMed] [Google Scholar]
- Sheng Y, Mancino V, Birren B. Transformation of E. coli with large DNA molecules by electroporation. Nucleic Acids Res. 1995;23:1990–1996. doi: 10.1093/nar/23.11.1990. [DOI] [PMC free article] [PubMed] [Google Scholar]
- Shi Y-P, Huang T-T, Epstein CJ. The mapping of transgenes by fluorescence in situ hybridization on G-banded mouse chromosomes. Mamm Genome. 1994;5:337–341. doi: 10.1007/BF00356551. [DOI] [PubMed] [Google Scholar]
- Shi Y-P, Mohapatra G, Miller J, Hanahan D, Lander E, Gold P, Pinkel D, Gray J. FISH probes for mouse chromosome identification. Genomics. 1997;45:42–47. doi: 10.1006/geno.1997.4904. [DOI] [PubMed] [Google Scholar]
- Weier HU, Polikoff D, Fawcett JJ, Greulich KM, Lee KH, Cram S, Chapman VM, Gray JW. Generation of five high-complexity painting probe libraries from flow-sorted mouse chromosomes. Genomics. 1994;21:641–644. doi: 10.1006/geno.1994.1326. [DOI] [PubMed] [Google Scholar]
- Xiao Y, Darroudi F, Kuipers AG, de Jong JH, de Boer P, Natarajan AT. Generation of mouse chromosome painting probes by DOP-PCR amplification of microdissected meiotic chromosomes. Cytogent Cell Genet. 1996;75:63–66. doi: 10.1159/000134458. [DOI] [PubMed] [Google Scholar]