

Abstract
The breast cancer susceptibility gene 1 (Brca1) has a key role in both hereditary and sporadic mammary tumorigenesis. However, the reasons why Brca1-deficiency leads to the development of cancer are not clearly understood. Activation of Akt kinase is one of the most common molecular alterations associated with human malignancy. Increased Akt kinase activity has been reported in most breast cancers. We previously found that downregulation of Brca1 expression or mutations of the Brca1 gene activate the Akt oncogenic pathway. To further investigate the role of Brca1/Akt in tumorigenesis, we analyzed Brca1/Akt expression in human breast cancer samples and found that reduced expression of Brca1 was highly correlated with increased phosphorylation of Akt. Consistent with the clinical data, knockdown of Akt1 by short-hairpin RNA inhibited cellular proliferation of Brca1 mutant cells. Importantly, depletion of Akt1 significantly reduced tumor formation induced by Brca1-deficiency in mice. The third generation inhibitor of mammalian target of rapamycin (mTOR), Palomid 529, significantly suppressed Brca1-deficient tumor growth in mice through inhibition of both Akt and mTOR signaling. Our results indicate that activation of Akt is involved in Brca1-deficiency mediated tumorigenesis and that the mTOR pathway can be used as a novel target for treatment of Brca1-deficient cancers.
Keywords: Brca1, PKB/Akt, mTOR
Introduction
Germline mutations of the Brca1 gene account for 50% of hereditary breast cancers and 85% of the families whose members have a high incidence of breast cancers (Miki et al., 1994; Narod and Foulkes, 2004). Although Brca1 gene mutations are rare in sporadic breast cancers, Brca1 protein expression is frequently reduced or absent in sporadic cases (Thompson et al., 1995), suggesting a much wider role of Brca1 in both hereditary and sporadic mammary tumorigenesis. The Brca1 protein contains an N-terminal ring domain and C-terminal tandem BRCT motifs that are phosphoprotein binding motifs. The BRCT domains are important for the tumor-suppressor function of Brca1. Most Brca1 mutations result in truncated Brca1 gene products that lack one or both C-terminal BRCT domains. Clinically relevant missense mutations identified at the C-terminus of Brca1 abolish the structure of BRCT. Loss of the Brca1 BRCT domains leads to tumor formation in mice (Ludwig et al., 2001; Xu et al., 2001; Brodie and Deng, 2001; Deng, 2006). We previously showed that Brca1-deficiency activates the Akt oncogenic pathway (Xiang et al., 2008). Mutation of Brca1 gene increases the phosphorylation and the kinase activity of Akt. The Brca1-BRCT domains directly bind to phosphorylated Akt (pAkt), leading to its ubiquitination towards protein degradation. Brca1 mutant cells lacking the BRCT repeats accumulate nuclear pAkt and consequently inactivate the transcriptional activity of FOX-O3a, a main nuclear target of pAkt (Brunet et al., 1999; Tran et al., 2003). Here, we demonstrate that the Brca1/Akt1 pathway contributes to tumorigenesis and mammalian target of rapamycin (mTOR) is a therapeutic target for Brca1-deficient cancers.
Results
Up to 40–80% of human breast cancers exhibit decreased expression of Brca1 or increased activation of Akt1 (Thompson et al., 1995; Sun et al., 2001; Narod and Foulkes, 2004; Wickenden and Watson, 2010). These alterations can be detected by immunohistochemical (IHC) analysis in breast cancers with Brca1 antibodies or antibodies against pAkt (S473), respectively. To test whether defects in Brca1 expression correlate with activation of Akt1 in breast cancers, we performed IHC analysis on a panel of human breast cancer samples with antibodies of Brca1 (Ab-1, Oncogene, Cambridge, MA, USA) and pAkt (S473, Cell Signaling Technology (Danvers, MA, USA)) as described (Wilson et al., 1999; Kirkegaard et al., 2005; Puc et al., 2005; Dinesh et al., 2006). Cancer tissue samples were obtained from 101 breast cancer patients who underwent mastectomy or breast conserving surgery (Supplementary Table 1). Competitive peptides of pAkt and Brca1 blocked the immunostaining signals of pAkt and Brca1 antibodies, respectively, confirming the specificity of these antibodies (data not shown). The positive reaction of Brca1 and pAkt were scored into four grades according to the intensity of the staining (0, none; 1+, weakly positive; 2+, moderately positive; and 3+, strongly positive). In all, 0 and 1+ were recorded as negative, and 2+ and 3+ were recorded as positive (Supplementary Figure 1). Sections were independently scored by two investigators with double-blind evaluations. The results showed that about 69% (n=70) of tumor tissue samples had decreased Brca1 staining, whereas about 61% of the 101 specimens displayed positive staining for pAkt (Figure 1a). In total, 71% (50/70) of the samples with reduced expression of Brca1 also displayed increased pAkt, indicating that Brca1 expression inversely correlates with Akt1 activation in human breast cancers and supporting our hypothesis that activation of Akt1 is involved in Brca1-deficient cancer development. Figure 1b showed positive and negative IHC staining samples of Brca1 and pAkt in the same cases. There is no statistical difference of clinical-pathological features between Brca1 and pAkt groups (Supplementary Table 1).
Figure 1.

Brca1 expression inversely correlates with Akt1 activation in human breast cancers. (a) Immunohistochemical (IHC) analysis of pAkt (S473) and Brca1 expression. Chi-square test was used for statistical analysis. (b) Immunohistochemical staining shows the expression of pAkt (S473) and Brca1 in the same cases of breast cancer tissues. Original magnification ×200.
We examined Ki67 expression, a proliferation marker, by IHC and found that 63% (61/97) of the samples showed Ki67 positive staining (Supplementary Table 2). The frequency of Ki67-positive tumors was significantly higher in pAkt-positive (71%, 43/61) and Brca1-negative tumors (77%, 47/61), compared with pAkt-negative (47%, 17/36) and Brca1-positive tumors (56%, 20/36), respectively. These results are consistent with previous reports (Ding et al., 2004; Pallares et al., 2005; Aaltonen et al., 2009; van der et al., 2009; Aleskandarany et al., 2010), suggesting that pAkt-positive and Brca1-negative tumors are associated with tumor proliferation. It has been suggested that PIK3CA mutations activate Akt function through its phosphorylation, thus, we investigated the relationship between PIK3CA mutations and the expression of pAkt and Brca1. In all, 44 mutations in PIK3CA (exon 9 and 20) were identified out of a total of 99 samples (Supplementary Table 2). The frequency of PIK3CA mutations was significantly higher in pAkt-positive tumors (77%, 34/44) than pAkt-negative tumors (23%, 10/44). However, Brca1 negative/pAkt positive tumors were not significantly associated with PIK3CA mutations (47%, 23/49) compared with PIK3CA wild type (54%, 26/49) (Supplementary Table 2), suggesting that there are different mechanisms for pAkt activation.
Brca1 directly binds to pAkt kinase and down-regulates its activation through the ubiquitination pathway leading to its degradation (Xiang et al., 2008). To investigate the effects of interaction of Brca1/Akt on tumorigenesis, we determined the Akt1 binding domains to Brca1. Akt1 contains three functional domains, the N-terminal pleckstrin homology (PH) domain, the kinase domain (KD) and the hydrophobic motif (HM) domain. To map the Brca1 binding sites of Akt1, we generated HA-tagged Akt1 deletion mutants, including HA-ΔPH (deletion amino acids 6–107), HA-ΔKD (deletion amino acids 149–408) and HA-ΔHM (deletion amino acids 409–476). HA-tagged full-length or deletion mutants of AKT1 were transfected into immortalized mouse embryonic fibroblasts (MEFs). The cell lysates were incubated with the GST-BRCT domain of Brca1. The GST complex was eluted and analyzed by western blotting with an anti-GST or anti-HA antibody. The HA-ΔHM mutant was not present in GST-Brca1 BRCT complex, indicating that the HM domain of Akt1 binds to BRCA1 (Supplementary Figure 2).
Next, we addressed whether inhibition of Akt1 affects cell proliferation. Loss of the Brca1-BRCT domains that bind to pAkt leads to mammary cancer formation in mice (Ludwig et al., 2001). We previously found that MEFs from the mouse expressing a truncated Brca1 allele lacking the BRCT repeats (Brca1tr/tr) showed higher levels of pAkt, compared with Brca1+/+ MEFs (Xiang et al., 2008). Using the MEFs, we performed the MTT assays. Depletion of Akt1 by short-hairpin RNAs (shRNAs) (shAkt1-A&B) significantly reduced cell viabilities in Brca1tr/tr MEFs compared with GFP-shRNA control cells (shGFP) or Brca1+/+ MEFs (Figure 2a). The pAkt level was markedly decreased in cells stably expressing shAkt1. To further examine the relationship among Akt, Brca1 and proliferation, the colony formation assays in soft agar were performed. Only Brca1tr/tr MEFs, but not Brca1+/+ MEFs formed colonies (Figure 2b and data not shown). Depletion of Akt1 by shRNAs (shAkt1-A&B) significantly reduced colony formation in Brca1tr/tr MEFs compared with that of shGFP. Overexpression of Akt1-S473D, a constitutively active form, increased colony formation in Brca1tr/tr MEFs with depletion of Akt1 (Figure 2c). Expression of Akt1-ΔHM mutant that does not have the binding domain to Brca1 did not rescue colony formation by depletion of Akt1. These results indicate that the interaction of Brca1 with Akt1 is responsible for Brca1/Akt1-mediated proliferation.
Figure 2.

Deletion of mouse Akt1 reduces proliferation of Brca1tr/tr MEFs. (a) The MTT assays were performed to measure the cell viability of Brca1+/+ and Brca1tr/tr MEFs with or without knockdown of Akt1. The quantitative data were summarized from three experiments. All data were normalized relative to the control. The right panel showed western blot analysis of pAkt (S473) and Akt1 levels in these MEFs. (b) Proliferation of Brca1tr/tr MEFs expressing GFP and Akt1 shRNAs was detected by the soft agar assay. The lower panel showed western blot analysis of pAkt (S473) and Akt1 levels. The quantitative data were summarized from three colony formation assay experiments (right panel). (c) Active form of Akt1-S473D, but not deletion of hydrophobic motif (HM) mutant, rescues colony formation in Brca1tr/tr MEFs with Akt1 knockdown (shAkt-B, target sequence in 3′UTR). The right panel showed western blot analysis of pAkt (S473) and Akt1 levels.
To test whether depletion of Akt1 inhibits the tumorigenicity associated with Brca1-deficiency, Brca1tr/tr MEFs stably expressing either the shGFP or shAkt1 were implanted into SCID mice, and tumor formation was monitored for 9 weeks. Implantation of control shGFP Brca1tr/tr MEFs resulted in tumor formation in 18 of 20 mice (90%, Figure 3a). Expressions of shAkt1-A and shAKT-B were sufficient to dramatically suppress tumor development and only 5–6 of 20 mice generated tumors, respectively. In addition, depletion of Akt1 also resulted in a striking reduction in tumor size compared with those from shGFP control Brca1tr/tr MEFs (Figure 4a). Western blot and IHC analysis of dissected tumors revealed a marked reduction in pAkt levels in tumors from shAKT1-expressing cells compared with those from shGFP control Brca1tr/tr MEFs (Figures 3b and c). Thus, depletion of Akt1 in Brca1 deficient cells results in decrease of pAkt level, arrest of cell proliferation, and, most importantly, suppression of tumor growth.
Figure 3.
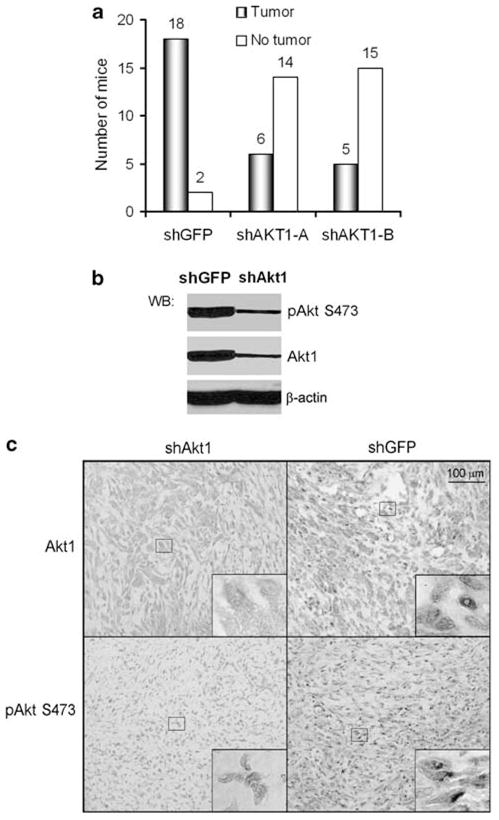
Depletion of Akt1 suppresses tumor development induced by Brca1tr/tr MEFs in mice. (a) After 9 weeks, implanting Brca1tr/tr MEFs with or without knockdown of Akt1, the tumors became rigid and the volume of tumor ((L×W2)/2) is measured. (b, c) Western blot and IHC analysis of Akt1 and pAkt (S473) in xenograft tumors. Original magnification ×200. Insides are high magnification (×1000).
Figure 4.

P529 significantly suppresses tumor growth in Brca1tr/tr xenograft tumors. (a) Tumor growth rate after P529 treatment. The mice bearing xenograft tumors were assigned to vehicle and P529 treatment groups and mean tumor volumes at the start point (after 9 weeks implanting cells) for treatment were indistinguishable between the vehicle and P529 treatment groups. (b) Statistical analysis of effects of P529 on tumor growth for mice bearing Brca1tr/tr MEFs or MCF7 xenograft tumors (after 18 days treatment). (c) P529 treatment inhibits both pS6S235/236 and pAktS473 expression levels in Brca1tr/tr xenograft tumors. (d) IHC analysis of pS6S235/236 and pAktS473 in Brca1tr/tr xenograft tumors with or without P529 treatment. Original magnification ×200.
The mTOR is a critical downstream effector of Akt, which contributes to tumorigenesis (Hay, 2005; Sabatini, 2006; Guertin and Sabatini, 2007; Efeyan and Sabatini, 2010). The third generation mTOR inhibitor, Palomid 529 (P529), is a novel small molecular drug inhibiting the TORC1 and TORC2 complexes as well as the Akt activity (Xue et al., 2008; Diaz et al., 2009). We tested the effects of P529 on Brca1-deficient tumors in mice and found that P529 significantly inhibited Brca1-deficient tumor growth (Figures 4a and b). Tumor growth in mice (n=18, Brca1tr/tr MEFs with shGFP group) was arrested by treatment with P529 along with actual regression of the tumor size. Treatment of shAkt tumor-bearing mice with P529 also inhibited tumor growth, but with less inhibitory effect compared with those of Brca1tr/tr MEFs induced tumors (shGFP), suggesting that P529 may have better therapeutic effects on tumors with high expressing level of pAkt, such as Brca1-deficient tumors. Consistent with this hypothesis, P529 treatment for MCF7 (Brca1 wild type)-induced tumors with knockdown of Akt1 also showed less inhibitory effect compared with those of control (shGFP) or Brca1tr/tr MEFs-induced tumors (Figure 4b). Analyses of tumor lysates by western blotting and IHC assays indicated that P529 reduced the levels of pAkt and pS6 (Figures 4c and d and Supplementary Figure 3), suggesting that P529 inhibits both the pAkt and mTOR signaling.
Discussion
The tumor suppressor Brca1 is frequently inactivated in human breast cancers. However, the extent to which Brca1-activated molecular pathways contribute to its tumor suppressor activity remains unclear. Our preliminary results indicate that downregulation of Brca1 expression or mutations of the Brca1 gene activate the Akt1 oncogenic pathway (Xiang et al., 2008). Brca1 directly binds to Akt1 kinase and downregulates its activation through the ubiquitination pathway leading to its degradation. Here, we further provide evidence that the Brca1-Akt1 pathway contributes to tumorigenesis and Akt1/mTOR is a novel therapeutic target for Brca1-deficient cancers. In human breast cancers, reduced expression of Brca1 is correlated with increased phosphorylation of Akt. These results support our hypothesis that activation of Akt1 is involved in Brca1-deficiency mediated tumorigenesis.
The Akt/PKB kinase is a well-characterized effector of phosphoinositide 3-kinase, and its hyperactivation has an important role in the pathogenesis of human cancers. Cellular processes that are regulated by Akt1 include cell proliferation and survival, intermediary metabolism, angiogenesis and tissue invasion. We found that knockdown of Akt1 reduces Brca1-deficient cell proliferation. Moreover, the Akt1 mutant lacking the Brca1-binding domain could not rescue this phenotype, suggesting that the interaction of Akt1 with Brca1 regulates cell proliferation mediated by Brca1 deficiency.
Mammalian cells contain three Akt isoforms (Akt1–3). Akt1 is the predominantly expressed Akt isoform, and its deficiency reduced total Akt activity by ~50% (Chen et al., 2006). By targeted disruption of the Akt1 gene, Chen et al. (2001) created an Akt1-null mouse model with aberrant signaling in the Akt1 pathway. Recent reports show that partial inhibition of Akt activity or inhibition of individual Akt isoform (Akt1) is sufficient to suppress cancer development (Bellacosa et al., 2005; Chen et al., 2006; Faivre et al., 2006). In Akt1−/−Pten+/− mouse model, a deficiency of Akt1 is most effective as an inhibitor of neoplasia induced by Pten inactivation (Chen et al., 2006). Even haplodeficiency of Akt1 can significantly attenuate the cancer development induced by Pten deficiency. Mice expressing truncated Brca1tr/tr, which eliminates the C-terminal half of the protein product (missing the BRCT domain), develop a variety of tumors in about ~85% of the mice (Ludwig et al., 2001). Loss of the Brca1-BRCT domains that bind to Akt1 leads to mammary cancer formation in mice implicates the potential role of Akt1 in Brca1-related tumorigenesis. We implanted Brca1tr/tr MEFs in mice and generated tumors. The depletion of Akt1 in Brca1tr/tr MEFs significantly reduces tumor formation, which provides direct evidence that Akt1 is involved in Brca1-deficient cancer formation.
The mTOR is a critical downstream effector of Akt (Hay, 2005; Sabatini, 2006; Guertin and Sabatini, 2007; Efeyan and Sabatini, 2010). The mTOR is associated with increased cell proliferation and is activated by Akt (Hay, 2005; Inoki and Guan, 2006; Lee et al., 2007). Akt activates mTOR through direct phosphorylation of the tuberous sclerosis complex 2, which otherwise inhibits mTOR activity (Inoki et al., 2002, 2005; Hay, 2005). Tuberous sclerosis complex 1 and tuberous sclerosis complex 2 form a heterodimer with GTPase activity that inhibits the activity of Rheb, a small GTPase required for mTOR activation. Upon activation, mTOR, which forms a rapamycin-sensitive complex with Raptor (regulatory-associated protein of mTOR), activates S6-kinase, a downstream substrate of mTOR-Raptor (Hay, 2005; Inoki and Guan, 2006). First and second generation mTOR inhibitors, such as rapamycin, have shown promise to inhibit tumor development. However, because of the complex nature of mTOR signaling, these inhibitors can result in counterproductive feedback signaling to potentiate upstream Akt signaling, leading to minimal tumor inhibition in breast cancer clinical trials (Sarbassov et al., 2005; Guertin and Sabatini, 2009; O’Reilly and McSheehy, 2010). P529 is the third generation mTOR inhibitor and inhibits both the TORC1 and TORC2 complexes as well as the Akt activity (Xue et al., 2008; Diaz et al., 2009). Our results showed that P529 not only significantly suppresses tumor growth, but also reduces the size of tumors with high expressing level of pAkt, such as Brca1-deficient tumors, suggesting a better therapeutic effect on Brca1-deficient tumors.
Our results demonstrate that Akt1 has a key role in Brca1-deficient caner development. Reduced expression of Brca1 is correlated with increased phosphorylation of Akt1 in human breast cancers. Interactions of Brca1 and Akt1 mediate cell proliferation. Depletion of Akt1 prevents cancer formation induced by Brca1-deficiency in mice. Targeting mTOR by P529 sufficiently suppresses Brca1-deficient cancer development. Thus, these results delineate the contributions of Brca1/Akt1 pathway to tumorigenesis and establish the mTOR pathway as novel therapeutic target for Brca1-deficient cancers.
Materials and methods
Cell culture, lentivirus infection and western blot analysis
Brca1+/+ and Brca1tr/tr MEFs and MCF7 breast cancer cells were cultured as described previously (Xiang et al., 2008). To generate lentiviral particles, 293 T cells were cotransfected with the lentiviral vectors and compatible packaging plasmids mixture using Lipofectamine 2000 (Invitrogen, Carlsbad, CA, USA), and the lentivirus supernatant was collected 40 h after transfection. For virus infection, cells were exposed to lentivirus supernatant for 24 h in the presence of polybrene (Sigma, St Louis, MO, USA). Protein extracts from MEFs and xenograft tumors were extracted to conduct western blot analysis as described previously (Xiang et al., 2008).
Antibodies and reagents
Anti-pGSK-3β (no. 9336), anti-Akt antibodies (Akt1 (no. 2938), pAktS473 (no. 4058 and no. 3787)) and anti-S6 ribosomal protein antibodies (S6 (no. 2217) and pS6Ser235/236 (no. 4857)) were from Cell Signaling Technology. Anti-Ki67 antibody was from Vector Laboratories (Burlingame, CA, USA), anti-β-actin (no. A5441) antibody was from Sigma and anti-Brca1 antibody (Ab-1, N-terminus) was from Calbiochem (Darmstadt, Germany). The goat anti-mouse IgG-HRP, goat anti-rabbit IgG-HRP, goat anti-mouse IgG-biotin and goat anti rabbit-IgG-biotin second antibodies were from Santa Cruz Biotechnology (Santa Cruz, CA, USA). Vectastain ABC kit and DAB substrate kit were from Vector Laboratories. P529 was provided from Paloma Pharmaceuticals Inc. GFP and Akt1 shRNAs were obtained from Sigma.
IHC assay
Human breast cancer tissue samples were obtained from 101 primary breast cancer patients who underwent mastectomy or breast conserving surgery during the period from 1989 to 2008 at Barnes-Jewish Hospital in St. Louis. IHC was performed by using Brca1, pAkt1S473 and Ki67 antibodies. Paraffin slides were deparaffinized and rehydrated by sequential incubations in xylene, 100% ethanol and 95% ethanol. Endogenous peroxidases were quenched for 20 min with 3% H2O2 at room temperature. An antigen retrieval step was performed by placing slides in preheated sodium citrate buffer (10mM, pH 6.0) and heated for 10 min in a pressure cooker. The slides were allowed to cool to room temperature. Slides were blocked with 5%of goat serum in Tris buffered saline (TBS) buffer for 60 min at room temperature. The diluted primary antibody was then added and incubated in a moist chamber at 4 °C overnight. Biotinylated secondary antibody was added for 30 min at room temperature. To detect primary antibody binding, ABC and DAB kits were applied according to the manufacturer instruction (Vector Laboratories). After mounting, the slides were observed under microscope and pictures were taken.
Mutation analysis of PIK3CA
Genomic DNA was prepared from the tumor samples as previously described (Yang et al., 2000). PCR amplification was performed with primers previously described for exons 9 and 20 of PIK3CA (Samuels et al., 2004). Sequencing of the PCR products was conducted using ABI 3300 automated capillary sequencer. The sequence data of PIK3CA gene from GenBank (accession no. NM_006218). Genomic DNA from corresponding normal tissues was subjected to sequence analysis to confirm the detected mutations.
MTT and soft agar assays
For the MTT assay, cells were plated and cultured 4 days to measure cell viability. All data were normalized relative to the control. For the Soft agar assay, cells (10 000/dish) were suspended in 2ml of 0.3% agar and poured over a 3 ml 0.6% solidified layer of agar in 60mm dishes. Cells were incubated for about 14–16 days until colonies were large enough to visualize. Colonies were observed under phase contrast microscope. Experiments were performed in triplicate.
Tumor growth experiments
Animal experiments were performed according to institutional guidelines for animal welfare. Female NOD.SCID/NCR mice of 6–8 weeks of age were purchased from NCI-Frederick Animal Production Program (Frederick, MA, USA). In all, 2×10⁶ Brca1tr/tr MEFs or MCF7 cells expressing GFP or Akt1 shRNA in 0.1ml PBS were mixed with equal volume of matrigel. The cell mixture was implanted into mouse breast fat pad. After 9 weeks, the tumors became rigid and the volume of tumor ((L×W2)/2) is measured in range of 180–250mm3. The mice were assigned to vehicle and P529 treatment groups and mean tumor volumes at the start point for treatment were indistinguishable between the vehicle and P529 treatment groups. P529-treated mice received 40mg/kg of P529 diluted in 100μl of vehicle. Control mice received 100 μl of vehicle only. Drug or vehicle was delivered orally every day for 18 days. At the end of treatment, the mice were killed and the tumors were excised and processed to paraffin section and protein extraction.
Supplementary Material
Acknowledgments
We thank Junjie Chen for providing the wild type and mutant GST-Brca1-BRCT constructs and Bing-Hua Jiang for providing Akt1-473D construct and Thomas Ludwig for providing Brca1+/+ and Brca1tr/tr MEFs. We thank Buck Rogers, Andrei Laszlo and Xiaowei Wang for proof-reading. This work is supported in part by grants from the Susan G Komen Foundation (QY), Siteman Cancer Center Award (QY) and NIH CA129440 (QY).
Footnotes
Conflict of interest
The authors declare no conflict of interest.
References
- Aaltonen K, Amini RM, Landberg G, Eerola H, Aittomaki K, Heikkila P, et al. Cyclin D1 expression is associated with poor prognostic features in estrogen receptor positive breast cancer. Breast Cancer Res Treat. 2009;113:75–82. doi: 10.1007/s10549-008-9908-5. [DOI] [PubMed] [Google Scholar]
- Aleskandarany MA, Rakha EA, Ahmed MA, Powe DG, Ellis IO, Green AR. Clinicopathologic and molecular significance of phospho-Akt expression in early invasive breast cancer. Breast Cancer Res Treat. 2010 doi: 10.1007/s10549-010-1012-y. e-pub ahead of print 9 July 2010. [DOI] [PubMed] [Google Scholar]
- Bellacosa A, Kumar CC, Di CA, Testa JR. Activation of AKT kinases in cancer: implications for therapeutic targeting. Adv Cancer Res. 2005;94:29–86. doi: 10.1016/S0065-230X(05)94002-5. [DOI] [PubMed] [Google Scholar]
- Brodie SG, Deng CX. BRCA1-associated tumorigenesis: what have we learned from knockout mice? Trends Genet. 2001;17:S18–S22. doi: 10.1016/s0168-9525(01)02451-9. [DOI] [PubMed] [Google Scholar]
- Brunet A, Bonni A, Zigmond MJ, Lin MZ, Juo P, Hu LS, et al. Akt promotes cell survival by phosphorylating and inhibiting a Forkhead transcription factor. Cell. 1999;96:857–868. doi: 10.1016/s0092-8674(00)80595-4. [DOI] [PubMed] [Google Scholar]
- Chen ML, Xu PZ, Peng XD, Chen WS, Guzman G, Yang X, et al. The deficiency of Akt1 is sufficient to suppress tumor development in Pten+/− mice. Genes Dev. 2006;20:1569–1574. doi: 10.1101/gad.1395006. [DOI] [PMC free article] [PubMed] [Google Scholar]
- Chen WS, Xu PZ, Gottlob K, Chen ML, Sokol K, Shiyanova T, et al. Growth retardation and increased apoptosis in mice with homozygous disruption of the Akt1 gene. Genes Dev. 2001;15:2203–2208. doi: 10.1101/gad.913901. [DOI] [PMC free article] [PubMed] [Google Scholar]
- Deng CX. BRCA1: cell cycle checkpoint, genetic instability, DNA damage response and cancer evolution. Nucleic Acids Res. 2006;34:1416–1426. doi: 10.1093/nar/gkl010. [DOI] [PMC free article] [PubMed] [Google Scholar]
- Diaz R, Nguewa PA, az-Gonzalez JA, Hamel E, Gonzalez-Moreno O, Catena R, et al. The novel Akt inhibitor Palomid 529 (P529) enhances the effect of radiotherapy in prostate cancer. Br J Cancer. 2009;100:932–940. doi: 10.1038/sj.bjc.6604938. [DOI] [PMC free article] [PubMed] [Google Scholar]
- Dinesh KP, Devaraj H, Murugan V, Rajaraman R, Niranjali S. Analysis of loss of heterozygosity and immunohistochemistry in BRCA1 gene in sporadic breast cancers. Mol Cell Biochem. 2006;287:177–183. doi: 10.1007/s11010-005-9097-z. [DOI] [PubMed] [Google Scholar]
- Ding SL, Sheu LF, Yu JC, Yang TL, Chen B, Leu FJ, et al. Expression of estrogen receptor-alpha and Ki67 in relation to pathological and molecular features in early-onset infiltrating ductal carcinoma. J Biomed Sci. 2004;11:911–919. doi: 10.1007/BF02254376. [DOI] [PubMed] [Google Scholar]
- Efeyan A, Sabatini DM. mTOR and cancer: many loops in one pathway. Curr Opin Cell Biol. 2010;22:169–176. doi: 10.1016/j.ceb.2009.10.007. [DOI] [PMC free article] [PubMed] [Google Scholar]
- Faivre S, Kroemer G, Raymond E. Current development of mTOR inhibitors as anticancer agents. Nat Rev Drug Discov. 2006;5:671–688. doi: 10.1038/nrd2062. [DOI] [PubMed] [Google Scholar]
- Guertin DA, Sabatini DM. Defining the role of mTOR in cancer. Cancer Cell. 2007;12:9–22. doi: 10.1016/j.ccr.2007.05.008. [DOI] [PubMed] [Google Scholar]
- Guertin DA, Sabatini DM. The pharmacology of mTOR inhibition. Sci Signal. 2009;2:e24. doi: 10.1126/scisignal.267pe24. [DOI] [PubMed] [Google Scholar]
- Hay N. The Akt-mTOR tango and its relevance to cancer. Cancer Cell. 2005;8:179–183. doi: 10.1016/j.ccr.2005.08.008. [DOI] [PubMed] [Google Scholar]
- Inoki K, Corradetti MN, Guan KL. Dysregulation of the TSC-mTOR pathway in human disease. Nat Genet. 2005;37:19–24. doi: 10.1038/ng1494. [DOI] [PubMed] [Google Scholar]
- Inoki K, Guan KL. Complexity of the TOR signaling network. Trends Cell Biol. 2006;16:206–212. doi: 10.1016/j.tcb.2006.02.002. [DOI] [PubMed] [Google Scholar]
- Inoki K, Li Y, Zhu T, Wu J, Guan KL. TSC2 is phosphorylated and inhibited by Akt and suppresses mTOR signalling. Nat Cell Biol. 2002;4:648–657. doi: 10.1038/ncb839. [DOI] [PubMed] [Google Scholar]
- Kirkegaard T, Witton CJ, McGlynn LM, Tovey SM, Dunne B, Lyon A, et al. AKT activation predicts outcome in breast cancer patients treated with tamoxifen. J Pathol. 2005;207:139–146. doi: 10.1002/path.1829. [DOI] [PubMed] [Google Scholar]
- Lee CH, Inoki K, Guan KL. mTOR pathway as a target in tissue hypertrophy. Annu Rev Pharmacol Toxicol. 2007;47:443–467. doi: 10.1146/annurev.pharmtox.47.120505.105359. [DOI] [PubMed] [Google Scholar]
- Ludwig T, Fisher P, Ganesan S, Efstratiadis A. Tumorigenesis in mice carrying a truncating Brca1 mutation. Genes Dev. 2001;15:1188–1193. doi: 10.1101/gad.879201. [DOI] [PMC free article] [PubMed] [Google Scholar]
- Miki Y, Swensen J, Shattuck-Eidens D, Futreal PA, Harshman K, Tavtigian S, et al. A strong candidate for the breast and ovarian cancer susceptibility gene BRCA1. Science. 1994;266:66–71. doi: 10.1126/science.7545954. [DOI] [PubMed] [Google Scholar]
- Narod SA, Foulkes WD. BRCA1 and BRCA2: 1994 and beyond. Nat Rev Cancer. 2004;4:665–676. doi: 10.1038/nrc1431. [DOI] [PubMed] [Google Scholar]
- O’Reilly T, McSheehy PM. Biomarker development for the clinical activity of the mTOR inhibitor everolimus (RAD001): processes, limitations, and further proposals. Transl Oncol. 2010;3:65–79. doi: 10.1593/tlo.09277. [DOI] [PMC free article] [PubMed] [Google Scholar]
- Pallares J, Martinez-Guitarte JL, Dolcet X, Llobet D, Rue M, Palacios J, et al. Survivin expression in endometrial carcinoma: a tissue microarray study with correlation with PTEN and STAT-3. Int J Gynecol Pathol. 2005;24:247–253. doi: 10.1097/01.pgp.0000163849.37129.d4. [DOI] [PubMed] [Google Scholar]
- Puc J, Keniry M, Li HS, Pandita TK, Choudhury AD, Memeo L, et al. Lack of PTEN sequesters CHK1 and initiates genetic instability. Cancer Cell. 2005;7:193–204. doi: 10.1016/j.ccr.2005.01.009. [DOI] [PubMed] [Google Scholar]
- Sabatini DM. mTOR and cancer: insights into a complex relationship. Nat Rev Cancer. 2006;6:729–734. doi: 10.1038/nrc1974. [DOI] [PubMed] [Google Scholar]
- Samuels Y, Wang Z, Bardelli A, Silliman N, Ptak J, Szabo S, et al. High frequency of mutations of the PIK3CA gene in human cancers. Science. 2004;304:554. doi: 10.1126/science.1096502. [DOI] [PubMed] [Google Scholar]
- Sarbassov DD, Guertin DA, Ali SM, Sabatini DM, O’Reilly KE, Rojo F, et al. Phosphorylation and regulation of Akt/PKB by the rictor-mTOR complex mTOR inhibition induces upstream receptor tyrosine kinase signaling and activates Akt. Science. 2005;307:1098–1101. [Google Scholar]
- Sun M, Wang G, Paciga JE, Feldman RI, Yuan ZQ, Ma XL, et al. AKT1/PKBalpha kinase is frequently elevated in human cancers and its constitutive activation is required for oncogenic transformation in NIH3T3 cells. Am J Pathol. 2001;159:431–437. doi: 10.1016/s0002-9440(10)61714-2. [DOI] [PMC free article] [PubMed] [Google Scholar]
- Thompson ME, Jensen RA, Obermiller PS, Page DL, Holt JT. Decreased expression of BRCA1 accelerates growth and is often present during sporadic breast cancer progression. Nat Genet. 1995;9:444–450. doi: 10.1038/ng0495-444. [DOI] [PubMed] [Google Scholar]
- Tran H, Brunet A, Griffith EC, Greenberg ME. The many forks in FOXO’s road. Sci STKE. 2003:RE5. doi: 10.1126/stke.2003.172.re5. [DOI] [PubMed] [Google Scholar]
- van der GP, van Diest PJ, Menko FH, Bart J, de Vries EG, van der WE. Molecular profile of ductal carcinoma in situ of the breast in BRCA1 and BRCA2 germline mutation carriers. J Clin Pathol. 2009;62:926–930. doi: 10.1136/jcp.2009.065524. [DOI] [PubMed] [Google Scholar]
- Wickenden JA, Watson CJ. Key signalling nodes in mammary gland development and cancer. Signalling downstream of PI3 kinase in mammary epithelium: a play in 3 Akts. Breast Cancer Res. 2010;12:202. doi: 10.1186/bcr2558. [DOI] [PMC free article] [PubMed] [Google Scholar]
- Wilson CA, Ramos L, Villasenor MR, Anders KH, Press MF, Clarke K, et al. Localization of human BRCA1 and its loss in high-grade, non-inherited breast carcinomas. Nat Genet. 1999;21:236–240. doi: 10.1038/6029. [DOI] [PubMed] [Google Scholar]
- Xiang T, Ohashi A, Huang Y, Pandita TK, Ludwig T, Powell SN, et al. Negative regulation of AKT activation by BRCA1. Cancer Res. 2008;68:10040–10044. doi: 10.1158/0008-5472.CAN-08-3009. [DOI] [PMC free article] [PubMed] [Google Scholar]
- Xu X, Qiao W, Linke SP, Cao L, Li WM, Furth PA, et al. Genetic interactions between tumor suppressors Brca1 and p53 in apoptosis, cell cycle and tumorigenesis. Nat Genet. 2001;28:266–271. doi: 10.1038/90108. [DOI] [PubMed] [Google Scholar]
- Xue Q, Hopkins B, Perruzzi C, Udayakumar D, Sherris D, Benjamin LE. Palomid 529, a novel small-molecule drug, is a TORC1/TORC2 inhibitor that reduces tumor growth, tumor angiogenesis, and vascular permeability. Cancer Res. 2008;68:9551–9557. doi: 10.1158/0008-5472.CAN-08-2058. [DOI] [PMC free article] [PubMed] [Google Scholar]
- Yang Q, Wesch H, Mueller KM, Bartsch H, Wegener K, Hollstein M. Analysis of radon-associated squamous cell carcinomas of the lung for a p53 gene hotspot mutation. Br J Cancer. 2000;82:763–766. doi: 10.1054/bjoc.1999.0995. [DOI] [PMC free article] [PubMed] [Google Scholar]
Associated Data
This section collects any data citations, data availability statements, or supplementary materials included in this article.