

Abstract
Charcot-Marie-Tooth (CMT) disease is a progressive neuropathy of the peripheral nervous system, typically characterized by muscle weakness of the distal limbs. CMT is noted for its genetic heterogeneity, with four distinct loci already identified for the axonal form of the disease (CMT2). In 1996, linkage analysis of a single large family revealed the presence of a CMT2 locus on chromosome 7p14 (designated CMT2D). Additional families have been linked subsequently to the same genomic region, including one with distal spinal muscular atrophy (dSMA) and one with mixed features of dSMA and CMT2; symptoms in both of these latter families closely resemble those seen in the original CMT2D family. There is thus a distinct possibility that CMT2 and dSMA encountered in these families reflect allelic heterogeneity at a single chromosome 7 locus. In the study reported here, we have performed more detailed linkage analysis of the original CMT2D family based on new knowledge of the physical locations of various genetic markers. The region containing the CMT2D gene, as defined by the original family, overlaps with those defined by at least two other families with CMT2 and/or dSMA symptoms. Both yeast artificial chromosome (YAC) and bacterial clone-based [bacterial artificial chromosome (BAC) and P1-derived artificial chromosome (PAC)] contig maps spanning ∼3.4 Mb have been assembled across the combined CMT2D critical region, with the latter providing suitable clones for systematic sequencing of the interval. Preliminary analyses have already revealed at least 28 candidate genes and expressed-sequence tags (ESTs). The mapping information reported here in conjunction with the evolving sequence data should expedite the identification of the CMT2D/dSMA gene or genes.
In 1886, two independent publications described a disorder characterized by progressive muscular atrophy with weakness of the legs and feet (Charcot and Marie 1886; Tooth 1886). Ultimately, these features were found to be shared among a heterogeneous group of inherited neurodegenerative disorders that affect primarily the peripheral nervous system; collectively, these disorders are now called Charcot-Marie-Tooth (CMT) disease. With a prevalence of 1 in 2500, CMT represents the most common inherited peripheral neuropathy (Skre 1974).
Generally, CMT disease includes the following characteristics: muscle weakness of the feet and legs, decreased deep tendon reflexes, atrophy of the legs, a characteristic steppage (“equine”) gait, sensory loss, and pes cavus (Murakami et al. 1996). However, the description of the disease is complicated by the fact that some patients demonstrate a slow motor nerve conduction velocity (MNCV) accompanied by demyelination of the nerves, whereas others show normal to near normal MNCVs without marked demyelination (Dyck and Lambert 1968; Dyck et al. 1993). In the adopted classification scheme for CMT, CMT2 corresponds to nondemyelinating forms of the disease.
By 1996, three autosomal dominant CMT2 loci had been reported: (1) CMT2A, mapping to chromosome 1p36 (Ben Othmane et al. 1993); (2) CMT2B, mapping to chromosome 3q13–q22 (Kwon et al. 1995); and (3) CMT2C, accounting for all other CMT2 families excluded from linkage to CMT2A and CMT2B, but otherwise unmapped in the genome (Dyck et al. 1994). Ionasescu et al. (1996) then analyzed a large American family (CMT1019) with atypical CMT and identified a novel locus, CMT2D [see Online Mendelian Inheritance in Man (OMIM) accession no. 601472; http://www.ncbi.nlm.nih.gov/Omim], within a broad genetic interval on chromosome 7p14. Subsequently, additional CMT2 families were linked to this same region of chromosome 7 (Pericak-Vance et al. 1997; Sambuughin et al. 1998), including one (named HSMN M) by Sambuughin et al. (1998) with symptoms that are also suggestive of the closely related disorder distal spinal muscular atrophy (dSMA; see OMIM accession no. 600794; http://www.ncbi.nlm.nih.gov/Omim). Interestingly, this region resides within a broad (∼37 cM) interval showing linkage with another large dSMA family (Christodoulou et al. 1995). Together, these data suggest that defects in a single gene may be responsible for CMT2 and dSMA in these families.
Recently, we completed a yeast artificial chromosome (YAC)-based physical map of human chromosome 7 (Bouffard et al. 1997b; see http://www.nhgri.nih.gov/DIR/GTB/CHR7) and currently are constructing bacterial clone-based contig maps suitable for systematic sequencing of the chromosome (Marra et al. 1997). Our physical mapping data provided a refined order of the available genetic markers in the 7p14 region harboring the CMT2D gene. Here we present a refined genetic analysis of the CMT1019 family. The CMT2D-containing region defined by the CMT1019 family overlaps a more narrow (∼3 cM) critical region defined by the Sambuughin et al. (1998; HSMN M) family, resulting in a combined ∼1-Mb critical region. In addition, we report the construction of a contiguous bacterial artificial chromosome (BAC) and P1-derived artificial chromosome (PAC) contig map spanning this combined critical region. Clones across these intervals are being sequenced at the Washington University Genome Sequencing Center (see http://genome.wustl.edu/gsc). Together, these efforts should accelerate the isolation of the CMT2D/dSMA gene(s).
RESULTS
Refined Genetic Analysis of the CMT1019 Family
The initial linkage of the CMT2D locus to chromosome 7p14 was established by analyzing the CMT1019 family with four genetic markers (D7S1808, D7S1869, D7S435, and D7S1806), with a maximum log of odds (lod) score obtained with marker D7S435 at υ = 0.00 (Ionasescu et al. 1996). To refine the location of this locus, we tested DNA from CMT1019 family members with an additional 12 nearby genetic markers that were ordered by YAC-based physical mapping (Bouffard et al. 1997b). The resulting genotype data, in conjunction with the established physical order of these genetic markers (see Fig. 2, below and Bouffard et al. 1997b), allowed detailed haplotypes to be reconstructed (Fig. 1). At the centromeric end of the interval, a recombination event is evident at D7S632 in individual 26 (an unaffected woman), her unaffected son (42), and his unaffected children (56, 57, and 58). We acknowledge that caution should be used in defining critical region boundaries on recombination events detected in unaffected individuals; however, the recombination at D7S632 is noted in three generations of the family. Furthermore, individual 26 is >80 years old, well beyond the average age of onset of symptoms in this family (16–30 years), shows no evidence of CMT, and has MNCVs within the normal range. Thus, we believe that D7S632 can be regarded as the centromeric boundary for the CMT2D critical region. On the telomeric side, individual 40 is a 33-year-old woman who carries the affected haplotype for markers centromeric to D7S1808. Although this family member shows some signs of CMT (e.g., slight bilateral weakness in her hands), these findings are obscured by a history of previous trauma (an automobile accident) that has left residual neurological symptoms, perhaps secondary to a spinal cord injury. Thus, the diagnosis of CMT in this individual is equivocal and cannot be relied upon for defining a boundary of the critical region. Nonetheless, the available genetic data indicate an overlap between the CMT2D-containing regions defined by the CMT1019 family and that reported by Sambuughin et al. (1998) for the large Mongolian family HSMN M (see Fig. 2; Discussion).
Figure 2.
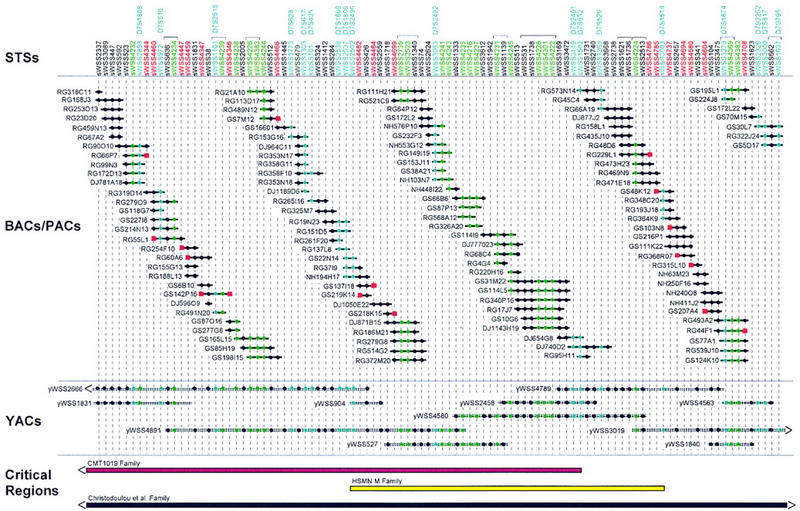
Clone-based physical map of the CMT2D critical region. A bacterial clone (BAC and PAC)-based STS-content map of the CMT2D critical region is depicted (oriented with 7pter left and 7cen right). The deduced positions of 100 STSs are depicted along the top, with the indicated clones shown as horizontal lines below. Relevant information about the STSs is available in GenBank (see http://www.ncbi.nlm.nih.gov). Bacterial clones are named starting with the following prefixes that reflect their library of origin: (RG) Research Genetics BAC library; see http://www.resgen.com, (GS) Genome Systems BAC library; see http://www.genomesystems.com, (NH) Roswell Park Cancer Institute BAC library RPCI-11; see http://bacpac.med.buffalo.edu, and (DJ) Roswell Park Cancer Institute PAC library RPCI-4 or RPCI-5. A solid circle indicates that the STS is confirmed to be present in that clone by PCR testing. When an STS corresponds to a BAC insert end, its name is shown in red and a red square is present at the end of the clone from which it was derived. STSs corresponding to genetic markers and genes/ESTs are indicated in blue and green, respectively (both the STS name and the corresponding solid circles). In the case of the genetic markers, the corresponding D7S number is indicated above the name of the STS. Groups of STSs that could not be ordered based on the STS content of the BACs, PACs, and YACs are indicated with brackets above their names. STSs are depicted in an equidistant fashion from one another. The indicated BAC/PAC overlaps were confirmed by restriction enzyme digest-based fingerprint analysis (data not shown) (Marra et al. 1997). Shown below the BACs and PACs is a small, representative set of YACs spanning the region [see Bouffard et al. (1997b) and http://www.nhgri.nih.gov/DIR/GTB/CHR7 for additional details about the complete YAC contig map]. The YACs were not tested for the presence of some of the newly developed STSs; in these cases, a solid circle is not indicated at the appropriate position in the clone. Along the bottom are depicted the CMT2D critical regions as defined by genetic analysis of the CMT1019 family (Ionasescu et al. 1996; see Fig. 1), the HSMN M family (Sambuughin et al. 1998), and the family reported by Christodoulou et al. (1995). Note that the end(s) of the critical regions defined by the first and last families extend beyond the interval covered by the depicted contig map.
Figure 1.

Updated genetic mapping data and deduced haplotypes for the CMT1019 family. Additional genetic mapping data was collected for key members of the CMT1019 family originally reported by Ionasescu et al. (1996). The indicated order of the genetic markers from 7pter (top) to 7cen (bottom) was established by YAC-based physical mapping (Bouffard et al. 1997b). Note that individual 60 is indicated as unaffected (unlike the original description of this family, where this individual was coded as affected) and individual 40 is represented by a hatched symbol to indicate an uncertain phenotypic status (see text). (Solid bars) Affected haplotype; (open bars) a normal chromosome. Also note the recombination events detected in individual 40 (denoted by a switch from an open to a solid bar at D7S1808) and individual 26 (denoted by a switch from an open to a solid bar at D7S632).
Physical Mapping of the CMT2D Critical Region
Our YAC-based sequence-tagged site (STS)-content map of human chromosome 7 (Bouffard et al. 1997b) provided a valuable starting point for physical mapping of the genomic interval containing the CMT2D gene. Specifically, the entire region of interest resides on a single YAC contig [contig E (sWSS9); Bouffard et al. 1997b; see http://www.nhgri.nih.gov/DIR/GTB/CHR7]. A minimal set of the YACs spanning this interval is shown in Figure 2. To facilitate gene discovery and sequencing of the greater CMT2D critical region, we assembled a complete bacterial clone-based contig map between (and including) D7S1808 and D7S795. Specifically, positive BACs and/or PACs were isolated for each of the 63 STSs contained within the sWSS2337–sWSS1637 interval (as mapped previously on the YAC contig map; see Fig. 2). Note that this segment encompasses the interval between D7S2496 and D7S632. An additional 20 STSs corresponding to genes and expressed-sequence tags (ESTs; see below) were also mapped relative to these BACs and PACs. Following the assembly of nascent BAC/PAC contigs based on the STS content of the clones, 17 new STSs were developed from the insert ends of clones located at the end of contigs, and these were in turn used to isolate additional clones. This process was performed in an iterative fashion. Additional clones were also obtained by hybridization-based screening of BAC and PAC libraries using STS-specific probes (J.D. McPherson, unpubl.). The latter provided deeper clone coverage and facilitated gap closure.
Based on the STS-content of the BACs/PACs, a fully contiguous contig map across the CMT2D critical region was assembled (Fig. 2). In addition, all isolated clones were subjected to restriction enzyme digest-based fingerprint analysis at the Washington University Genome Sequencing Center (Marra et al. 1997), and these results verified all clone overlaps (data not shown). The complete contig map consists of 589 clones (127 of which are displayed in Fig. 2), spans ∼3.4 Mb (based on the measured sizes of the restriction fragments), and contains 100 STSs, thereby providing an average STS spacing of ∼34 kb. The average redundancy of the BAC/PAC clones in the contig shown in Figure 2 (assembled by STS-content mapping) is roughly 4.3-fold, whereas that in the more comprehensive contig assembled by restriction enzyme digest-based fingerprint analysis is roughly 16-fold. Notably, contiguous bacterial clone-based coverage has been attained for the common CMT2D critical region, as defined by the CMT1019 and HSMN M families.
Genes and ESTs Mapping to the CMT2D Critical Region
Provided with a clone-based physical map of the CMT2D critical region, we were able to establish readily the relative locations of various candidate genes and ESTs mapping to 7p14. For example, the human transcript map assembled by Schuler et al. (1996; see http://www.ncbi.nlm.nih.gov/genemap ) contains numerous genes and ESTs mapping to nearby bins defined by radiation-hybrid mapping. Specifically, three bins account for most of this region (D7S516–D7S2492, D7S516–D7S632, and D7S632–D7S484), and ∼82 genes and ESTs were assigned to these bins. Of these, 19 are present in the same UniGene cluster as another EST (thereby collapsing the total number of apparently unique ESTs to 63). PCR assays for each of these 63 ESTs were used to test a subset of YACs that provided roughly twofold coverage across the CMT2D critical region. Of the 63 ESTs, 42 mapped to YACs that were just outside the critical region, mapped to none of the tested YACs, or did not map to chromosome 7. The remaining 21 ESTs (Fig. 3) mapped within the broader CMT2D critical region and were then incorporated into the BAC/PAC contig map (Fig. 2). A small number of additional ESTs, absent on the transcript map (Schuler et al. 1996), were also localized within the CMT2D critical region (Fig. 3).
Figure 3.
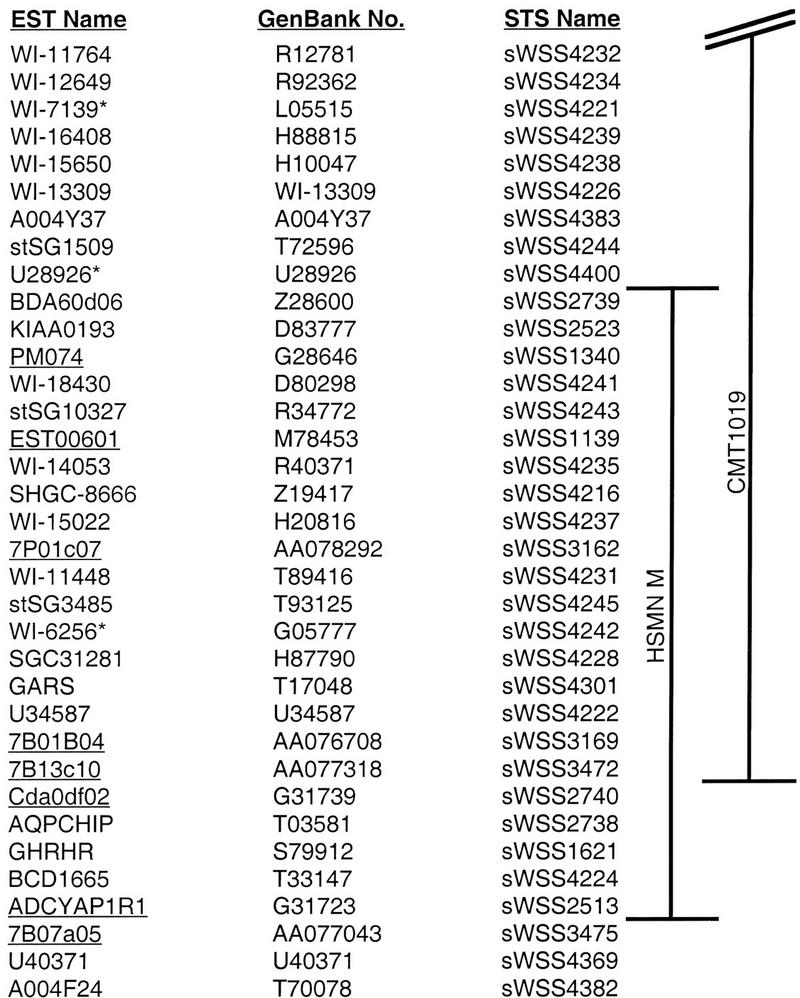
Genes and ESTs mapping to the CMT2D critical region. A list of genes and ESTs from the greater CMT2D critical region is provided in their established physical order (from 7pter at the top to 7cen at the bottom). Also indicated are the corresponding GenBank accession nos. and names of the STSs used for physical mapping (see Fig. 2). A total of 18 genes/ESTs have been localized thus far within the critical region defined by the CMT1019 (Ionasescu at al. 1996) and the HSMN M (Sambuughin et al. 1998) families. The three ESTs marked with an asterisk were localized on the YAC contig map and by genomic sequence data but not mapped by STS-content analysis of BAC/PAC clones (e.g., in Fig. 2). The eight genes/ESTs whose names are underlined were mapped on the YAC contig map (Bouffard et al. 1997b) but are not present on the transcript map reported by Schuler et al. (1996; see http://www.ncbi.nlm.nih.gov/genemap).
DISCUSSION
The presence of a CMT2D locus on human chromosome 7p14 has now been confirmed in multiple families. Our refined genetic analysis of the CMT1019 family (Ionasescu et al. 1996) indicates that the CMT2D gene resides telomeric to D7S632 (Fig. 1). Pericak-Vance et al. (1997) reported two small CMT2 families apparently linked to chromosome 7p. Preliminary multipoint analysis of these families produced a combined lod score of 4.17 and no recombination with D7S1806. Additional genotype analyses confirmed linkage to the CMT2D locus for one (no. 235) of the two families (J. Vance, pers. comm.). Unfortunately, this family does not contribute to a reduction of the critical region. In contrast, the large Mongolian family (HSMN M) reported by Sambuughin et al. (1998), which is associated with features of both CMT2 and dSMA, provides genetic data that can be used to delimit further the CMT2D critical region. Specifically, the critical region defined by this family is flanked by D7S2496 and D7S1514 (Sambuughin et al. 1998). Thus, there is a ∼1.5-cM, ∼1-Mb overlap between the critical regions defined by the CMT1019 and HSMN M families that is flanked by D7S2496 and D7S632 (Fig. 2). Of note, this delimited critical region is contained fully within the BAC/PAC contig map reported here (Fig. 2). It is important to emphasize that there are many shared clinical features between the CMT1019 and HSMN M families, including weakness and atrophy of the hands, slow progression of the disease, and onset of symptoms in the second to third decade of life.
The critical regions defined by the CMT1019 and HSMN M families also overlap that of the dSMA family reported by Christodoulou et al. (1995). The latter family is of Bulgarian descent and produced lod scores of 5.63 at υ = 0.00 and 5.99 at υ = 0.007 with markers D7S526 and D7S795, respectively. A telomeric recombination event was detected at D7S507 in this family; however, no centromeric boundary was reported. Thus, the critical region for this family spans at least 37 cM and overlaps the critical regions defined by the CMT1019 and HSMN M families (see Fig. 2). As the features of CMT2 and dSMA are similar, it is plausible that defects in a single gene account for the disease in all of these families, perhaps with distinct mutations resulting in the slightly different phenotypes (i.e., there is allelic heterogeneity). Interestingly, although the Bulgarian family was assigned a diagnosis of dSMA, the family members displayed muscle weakness and atrophy in the upper extremities with normal MNCVs, much like the CMT1019 and HSMN M families.
Together, genetic mapping of these various families indicates that the most likely location of the CMT2D gene is within the interval between markers D7S2496 and D7S632. This region is contained within our ∼3.4-Mb physical map, which consists of contiguous coverage in BACs and PACs and contains a mapped STS, on average, every 34 kb (Fig. 2). In addition, we have already localized numerous genes and ESTs in this region (Fig. 3). Importantly, our BAC/PAC contig map has allowed the selection of clones for systematic sequencing of the region at the Washington University Genome Sequencing Center (see http://genome.wustl.edu/gsc). Together, these efforts are providing a strong foundation that should contribute to the identification of the chromosome 7p gene(s) responsible for CMT and dSMA.
METHODS
Subjects
Family CMT1019 (Ionasescu et al. 1996) consists of 37 available individuals (12 affected, 24 unaffected, and 1 equivocal). In the affected family members, the onset of disease occurred between 16 and 30 years and manifested as weakness of the hands. Neurological examination of affected individuals revealed severe weakness and atrophy of the hands, with only mild to moderate weakness of the feet. Deep tendon reflexes were absent in the upper extremities and decreased in the lower extremities. All patients showed pes cavus and/or hammertoes. There was distal hypesthesia for touch, proprioception, and vibration sense, more evident for the hands than for the feet. MNCVs showed normal values and latencies (Ionasescu et al. 1996). Electromyography revealed signs of denervation, with large motor unit potentials, fibrillation potentials, and positive sharp waves. All studies were performed with approval by the appropriate institutional review board.
Linkage Analysis and Haplotype Construction
PCR amplification of short tandem repeat polymorphisms (STRPs) was performed using 20 ng of genomic DNA in 8.4-μl reactions containing 1.25 μl of PCR buffer [100 mm Tris-HCl (pH 8.8), 500 mm KCl, 15 mm MgCl2, 0.01% (wt/vol) gelatin], 200 μm each of dATP, dCTP, dGTP, and dTTP, 2.5 pmoles of each primer, and 0.25 unit of AmpliTaq polymerase (Perkin Elmer). Samples were subjected to 35 cycles of 94°C for 30 sec, 55°C for 30 sec, and 72°C for 30 sec. Amplification products were electrophoresed on 6% polyacrylamide/5% glycerol gels containing 7.7 m urea at 25 W for ∼3 hr, and the resulting gels were silver stained (Basam et al. 1991). Genotype data was scored independently by two observers. Linkage analysis was performed using the LINKAGE, MLINK, and LINKMAP programs (Lathrop and Lalouel 1983) with the parameters described earlier (Ionasescu et al. 1996). Haplotypes were constructed using the Cyrillic 2.0 program.
Construction of a Bacterial Clone-Based Physical Map
BACs were isolated from the Research Genetics and Genome Systems human BAC libraries by PCR-based screening. Candidate positive clones were colony purified, and individual colonies verified by PCR analysis. As nascent BAC contigs were assembled based on the STS content of the clones, new STSs were developed from insert-end sequences derived from strategically selected BACs (Marra et al. 1996). Specifically, BAC DNA was purified by an Autogen 740 automated nucleic acid system (Integrated Separation Systems). The resulting DNA was resuspended in 500 μl of water, treated with RNase (Ambion) at 37°C for 30 min, and concentrated on a Microcon 100 column (Amicon). A total of 1.5 μg of purified BAC DNA was then used for fluorescent sequencing using M13 forward or reverse DYEnamic ET primers (Amersham). The thermal cycling parameters were as follows: 95°C for 2 min followed by 20 cycles of 95°C for 10 sec, 55°C (forward primer) or 50°C (reverse primer) for 20 sec, and 72°C for 1 min. The sequencing reactions were analyzed on an ABI 373 automated sequencer (Perkin Elmer/Applied Biosystems, Inc.). Primers suitable for PCR analysis were designed from insert-end sequences using the program OSP (Hillier and Green 1991) as described previously (Bouffard et al. 1997a). All relevant information about the STSs has been submitted to GenBank (see http://www.ncbi.nlm.nih.gov).
To fill the gaps between evolving BAC contigs, additional clones were obtained by iterative walking from clones residing at contig ends (by deriving STSs from the corresponding insert ends, as described above) and by the isolation of additional BACs and PACs by hybridization-based screening using pools of STS-specific probes. Some of the clones identified by hybridization were then verified by PCR and placed in the STS-based physical map. All isolated clones were analyzed by restriction enzyme digest-based fingerprint analysis (Marra et al. 1997).
Gene/EST Mapping
Genes and ESTs mapping near the CMT2D critical region were identified on the human transcript map reported by Schuler et al. (1996; see http://www.ncbi.nlm.nih.gov/genemap). The corresponding EST-specific PCR assays were then used to test appropriate YAC and, in some cases, BAC and PAC DNA.
Acknowledgments
We thank Kurt Fischbeck for invaluable advice, helpful suggestions, and critical review of this manuscript as well as Curt Jamison for computational support.
The publication costs of this article were defrayed in part by payment of page charges. This article must therefore be hereby marked “advertisement” in accordance with 18 USC section 1734 solely to indicate this fact.
Footnotes
E-MAIL egreen@nhgri.nih.gov; FAX (301) 402-4735.
REFERENCES
- Basam BJ, Caetano-Anolles G, Gresshoff PM. Fast and sensitive silver staining of DNA in polyacrylamide gels. Anal Biochem. 1991;196:80–83. doi: 10.1016/0003-2697(91)90120-i. [DOI] [PubMed] [Google Scholar]
- Ben Othmane K, Middleton LT, Loprest LJ, Wilkenson KM, Lennon F, Rozear MP, Stajich JM, Gaskell PC, Roses AD, Pericak-Vance MA, Vance JM. Localization of a gene (CMT2A) for autosomal dominant Charcot-Marie-Tooth disease type 2 to chromosome 1p and evidence of genetic heterogeneity. Genomics. 1993;17:370–375. doi: 10.1006/geno.1993.1334. [DOI] [PubMed] [Google Scholar]
- Bouffard GG, Iyer LM, Idol JR, Braden VV, Cunningham AF, Weintraub LA, Mohr-Tidwell RM, Peluso DC, Fulton RS, Leckie MP, Green ED. A collection of 1814 human chromosome 7-specific STSs. Genome Res. 1997a;7:59–66. doi: 10.1101/gr.7.1.59. [DOI] [PubMed] [Google Scholar]
- Bouffard GG, Idol JR, Braden VV, Iyer LM, Cunningham AF, Weintraub LA, Touchman JW, Mohr-Tidwell RM, Peluso DC, Fulton RS, et al. A physical map of human chromosome 7: An integrated YAC contig map with average STS spacing of 79 kb. Genome Res. 1997b;7:673–692. doi: 10.1101/gr.7.7.673. [DOI] [PubMed] [Google Scholar]
- Charcot JM, Marie P. Sur une forme particuliere d’atrophie musculaire progressive, souvent familiale, débutant pas les pieds and les jambes et atteignant plus tard les mains. Rev Med. 1886;6:97–138. [Google Scholar]
- Christodoulou K, Kyriakides T, Hristova AH, Georgiou D-M, Kalaydjiva L, Yshpekov B, Ivanova T, Weber JL, Middleton LT. Mapping of a distal form of spinal muscular atrophy with upper limb predominance to chromosome 7p. Hum Mol Genet. 1995;4:1629–1632. doi: 10.1093/hmg/4.9.1629. [DOI] [PubMed] [Google Scholar]
- Dyck PJ, Lambert EH. Lower motor and primary sensory neuron diseases with peroneal muscular atrophy. Arch Neurol. 1968;18:619–625. doi: 10.1001/archneur.1968.00470360041003. [DOI] [PubMed] [Google Scholar]
- Dyck PJ, Chance PF, Lebo R, Carney JA. In: Hereditary motor and sensory neuropathies. In Peripheral neuropathy. 3rd ed. Dyck PJ, Thomas PH, Griffin SW, Lowe PA, Saunders PP, editors. Philadelphia, PA: W.B. Saunders Company; 1993. pp. 1094–1140. [Google Scholar]
- Dyck PJ, Litchy WJ, Minnerath S, Bird T, Chance PF, Schaid DJ, Aronson HE. Hereditary motor and sensory neuropathy with diaphragm and vocal cord paresis. Ann Neurol. 1994;35:608–615. doi: 10.1002/ana.410350515. [DOI] [PubMed] [Google Scholar]
- Hillier L, Green P. OSP: A computer program for choosing PCR and DNA sequencing primers. PCR Methods Applic. 1991;1:124–128. doi: 10.1101/gr.1.2.124. [DOI] [PubMed] [Google Scholar]
- Ionasescu V, Searby C, Sheffield VC, Roklina T, Nishimura D, Ionasescu R. Autosomal dominant Charcot-Marie-Tooth axonal neuropathy mapped to chromosome 7p (CMT2D) Hum Mol Genet. 1996;5:1373–1375. doi: 10.1093/hmg/5.9.1373. [DOI] [PubMed] [Google Scholar]
- Kwon JM, Elliott JL, Yee W, Ivanovich J, Scavarda NJ, Moolsintong PJ, Goodfellow PJ. Assignment of a second Charcot-Marie-Tooth type II locus to chromosome 3q. Am J Hum Genet. 1995;57:853–858. [PMC free article] [PubMed] [Google Scholar]
- Lathrop GM, Lalouel JM. Efficient computations in multilocus linkage analysis. Am J Hum Genet. 1983;42:498–505. [PMC free article] [PubMed] [Google Scholar]
- Marra M, Weinstock LA, Mardis ER. End sequence determination from large insert clones using energy transfer fluorescent primers. Genome Res. 1996;6:1118–1122. doi: 10.1101/gr.6.11.1118. [DOI] [PubMed] [Google Scholar]
- Marra MA, Kucaba TA, Dietrich NL, Green ED, Brownstein B, Wilson RK, McDonald KM, Hillier LW, McPherson JD, Waterston RH. High throughput fingerprint analysis of large-insert clones. Genome Res. 1997;7:1072–1084. doi: 10.1101/gr.7.11.1072. [DOI] [PMC free article] [PubMed] [Google Scholar]
- Murakami T, Garcia CA, Reiter LT, Lupski JR. Charcot-Marie-Tooth disease and related neuropathies. Medicine. 1996;75:233–250. doi: 10.1097/00005792-199609000-00001. [DOI] [PubMed] [Google Scholar]
- Pericak-Vance MA, Speer MC, Lennon F, West SG, Menold MM, Stajich JM, Wolpert CM, Slotterbeck BD, Saito M, Tim RW, et al. Confirmation of a second locus for CMT2 and evidence for additional genetic heterogeneity. Neurogenetics. 1997;1:89–93. doi: 10.1007/s100480050013. [DOI] [PubMed] [Google Scholar]
- Sambuughin N, Sivakumar K, Selenge B, Suk Lee H, Friedlich D, Baasanjav D, Dalakas MC, Goldfarb LG. Autosomal dominant distal spinal muscular atrophy type V (dSMA-V) and Charcot-Marie-Tooth disease type 2D (CMT2D) segregate within a single large kindred and map to a refined region on chromosome 7p15. J Neurol Sci. 1998;161:23–28. doi: 10.1016/s0022-510x(98)00264-0. [DOI] [PubMed] [Google Scholar]
- Schuler GD, Boguski MS, Stewart EA, Stein LD, Gyapay G, Rice K, White RE, Rodriguez-Tome P, Aggarwal A, Bajorek E, et al. A gene map of the human genome. Science. 1996;274:540–546. [PubMed] [Google Scholar]
- Skre H. Genetic and clinical aspects of Charcot-Marie-Tooth’s disease. Clin Genet. 1974;6:98–118. doi: 10.1111/j.1399-0004.1974.tb00638.x. [DOI] [PubMed] [Google Scholar]
- Tooth HH. In: “The peroneal type of progressive muscular atrophy.” Ph.D. thesis. Lewis HK, editor. Cambridge, UK: Cambridge University; 1886. [Google Scholar]