

Abstract
A software system for transforming fragments from four-color fluorescence-based gel electrophoresis experiments into assembled sequence is described. It has been developed for large-scale processing of all trace data, including shotgun and finishing reads, regardless of clone origin. Design considerations are discussed in detail, as are programming implementation and graphic tools. The importance of input validation, record tracking, and use of base quality values is emphasized. Several quality analysis metrics are proposed and applied to sample results from recently sequenced clones. Such quantities prove to be a valuable aid in evaluating modifications of sequencing protocol. The system is in full production use at both the Genome Sequencing Center and the Sanger Centre, for which combined weekly production is ∼100,000 sequencing reads per week.
Increased automation in the Human Genome Project (Watson 1990) continues to be critical in meeting projected goals and minimizing costs. Whereas technology development and hardware improvements are responsible for many gains, informatics issues also remain critically important (Marshall and Pennisi 1996). One area in which this is especially true is processing shotgun data, that is, converting raw fluorescent-gel images into assembled sequence. Managing the voluminous amount of data is difficult and requires appropriate computer software to maintain the systematic flow, organization, and quality-control necessary for successful large-scale shotgun sequencing (Wilson et al. 1994; Mardis and Wilson 1997). Most proprietary systems have proven to be less than adequate, however, a number of excellent Unix software tools have been developed to aid in automating various steps. For example, programs are now available that perform lane retracking calculations on multilane gel images with only a minimum of human intervention (Cooper et al. 1996). Moreover, a number of robust assembly algorithms and editors have been implemented and presently are in widespread use, for example, gap (Bonfield et al. 1995), phrap (P. Green, pers. comm.), consed (Gordon et al. 1998), and fakII (Larson et al. 1996; Myers 1996). The time, effort, and cost saved by such software is significant.
Sequence preprocessing, also called preassembly (Bonfield and Staden 1995), is the transformation of raw trace signals to assembly-ready sequence and is flanked by lane retracking and assembly (Fig. 1). It includes tasks such as converting the raw trace file from proprietary to standard form (Dear and Staden 1992), deriving template information, base-calling, vector screening, quality evaluation and control, disk management, and associated tracking and reporting operations (Fig. 2). Not only does it represent a significant computational effort, but sequence preprocessing is also challenging in the sense that it must handle many clones (also called sequencing projects or simply projects) being sequenced simultaneously. The importance of analyzing preprocessing results and generating informative reports also cannot be underestimated.These reports are usually the only way to quantitatively evaluate incremental modifications of sequencing protocols that are often required. For high-throughput labs, an organized, automated sequence preprocessing strategy is therefore a necessity.
Figure 1.
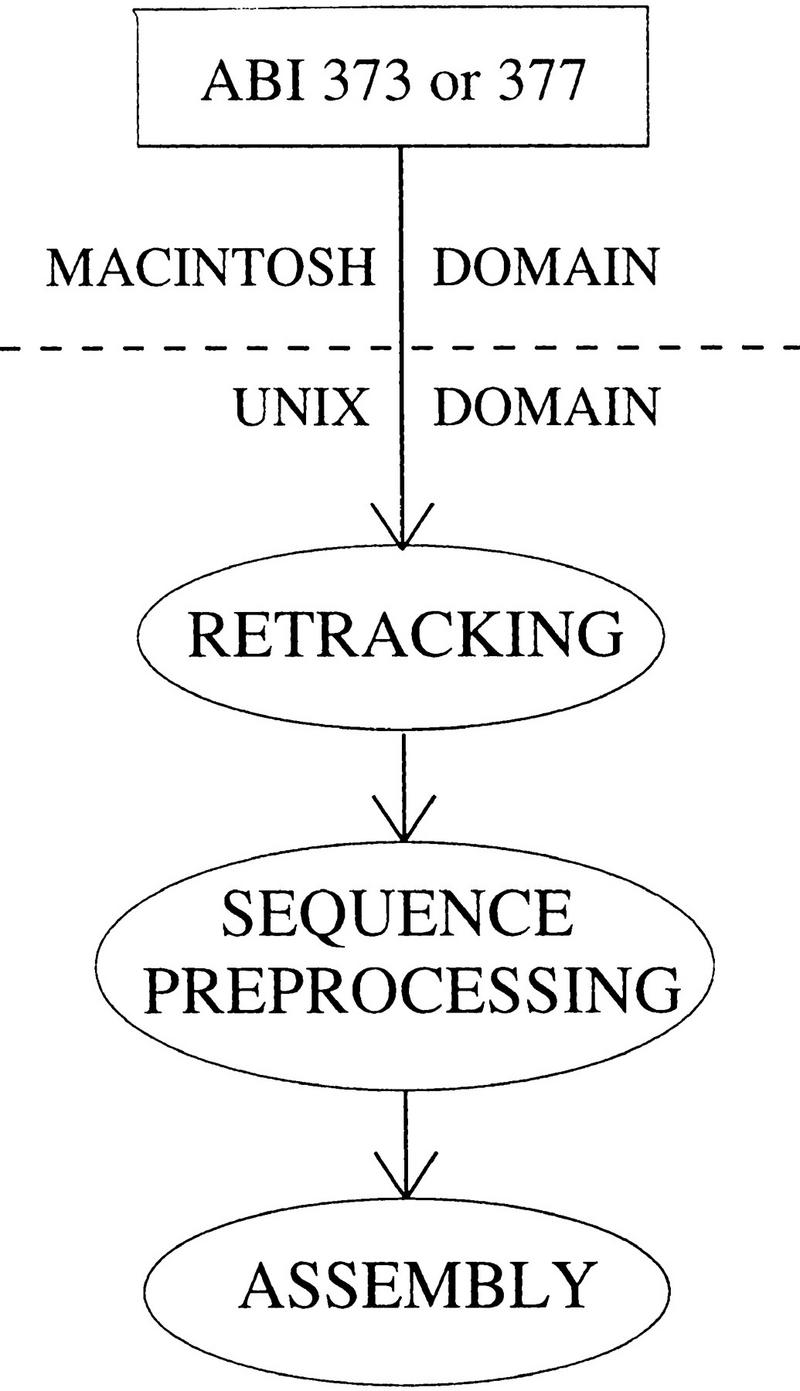
Overview of large-scale data processing. Data are gathered from ABI sequencing machines (models 373 and 377) on a Macintosh and ported to the Unix network. All subsequent operations occur strictly in the Unix domain including lane retracking, sequence preprocessing, and fragment assembly.
Figure 2.
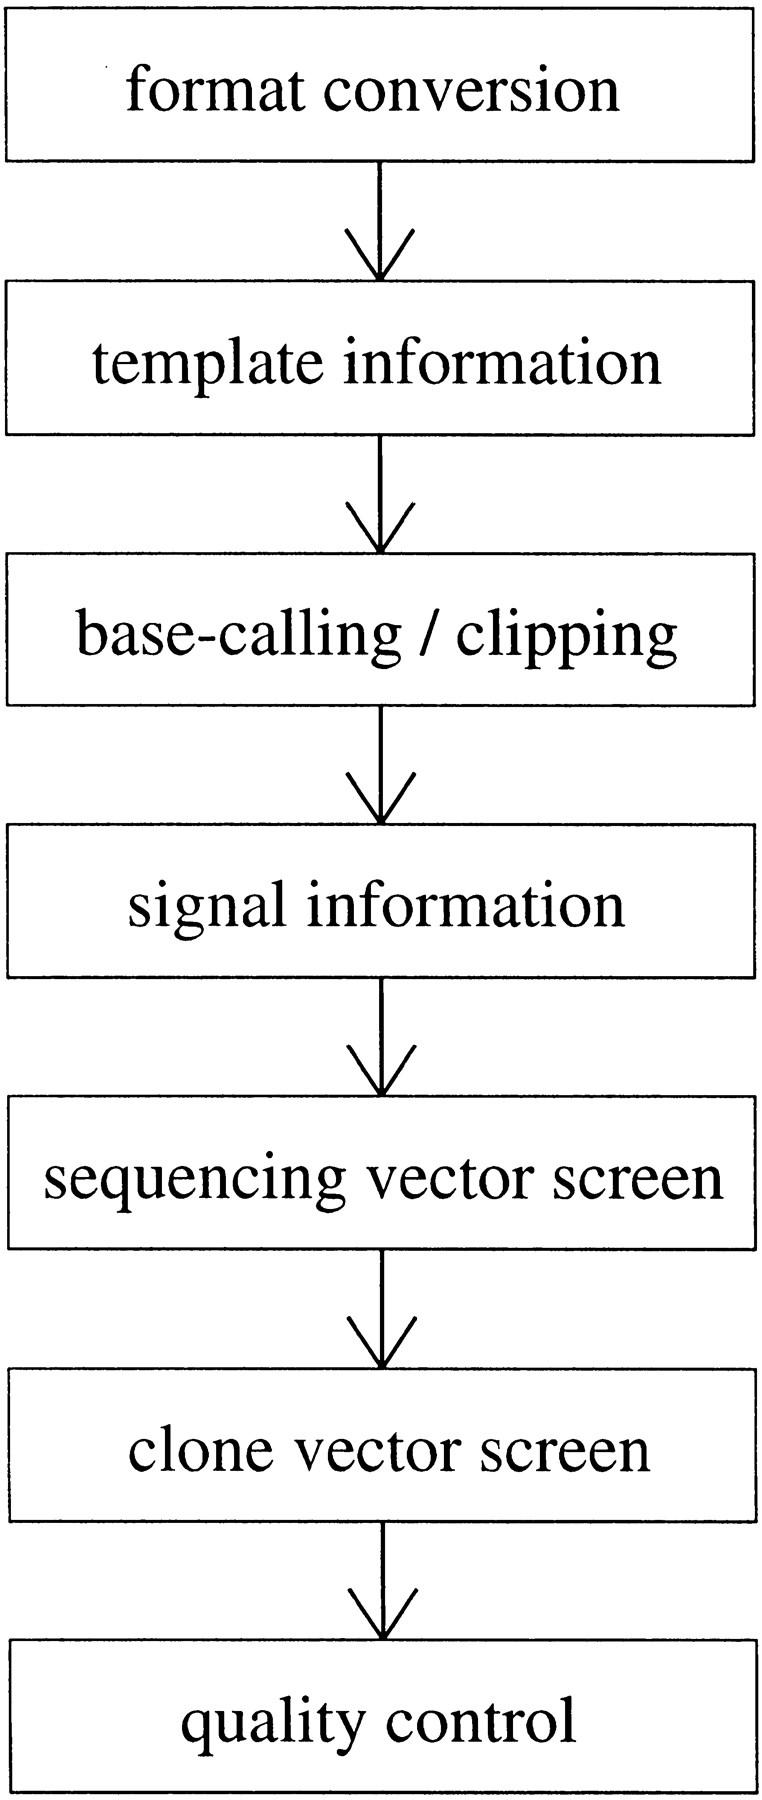
Overview of serial steps in sequence preprocessing. Each step represents an independent component module, some of which are simply wrappers for system programs. Modules can be added, deleted, or modified as needed. Template information refers to auxiliary processing data associated with a DNA fragment, including sequencing and cloning vector, organism and clone of origin, archive plate, and details (especially dates) regarding DNA growth and purification, and sequencing reactions.
Because of its fundamental importance in large-scale sequencing, the preprocessing problem has given rise to a number of Unix-based software systems using a wide range of paradigms. For example, pregap (Bonfield and Staden 1995) is a Bourne shell wrapper script designed around the Staden Package (Staden 1996) and the gap assembler (Bonfield et al. 1995). It is a component-based approach using the experiment file format (Bonfield and Staden 1995) for storing read-based information. The script allows some customization on the part of the user, but does not provide extensive capability for input validation and graphic input and output analysis. GRM (Lawrence et al. 1994) is an integrated graphic system based upon the object-oriented methodology. It is implemented in a number of languages including “C”, Smalltalk 80, and VisualWorks. The system allows interaction only through interfaces and supports various sequence assembly programs. Another program, hopper (Smith et al. 1997), is a Perl implementation designed around the University of Washington genome tools (P. Green, pers. comm.). Like pregap, it is component-based so individual pieces can be replaced with new or different tools. It also performs some input validation and automatically generates reports.
The diversity of available preprocessing programs partially reflects the varying needs of individual sequencing laboratories and centers. Practices, protocols, lab organization, and file structure all have a bearing on designing a sequence preprocessing strategy. At the Genome Sequencing Center (GSC), we, along with collaborators from the Sanger Centre, began developing our current strategy and Unix-based Perl implementation 3 years ago. It has since matured into a complete system called the Genome Automated Sequence Preprocessor (GASP). Designed around our needs for large-scale throughput, it manages the current production rate of ∼50,000 genomic reads per week at each laboratory.
RESULTS AND DISCUSSION
Development of the software has focused on providing our laboratory personnel with maximum utility. For example, user interaction is managed primarily with graphic interfaces (Fig. 3). A main interface (top) serves as an integrated platform for various components of the package to be discussed below. Two of the principal components are also shown in Figure 3: the processing interface for shotgun reads (middle), and the viewer for shotgun quality statistics (bottom). Not only is the graphic approach widely preferred by users as compared to command line implementations, but it also reduces the training time necessary for users to effectively operate the software.
Figure 3.
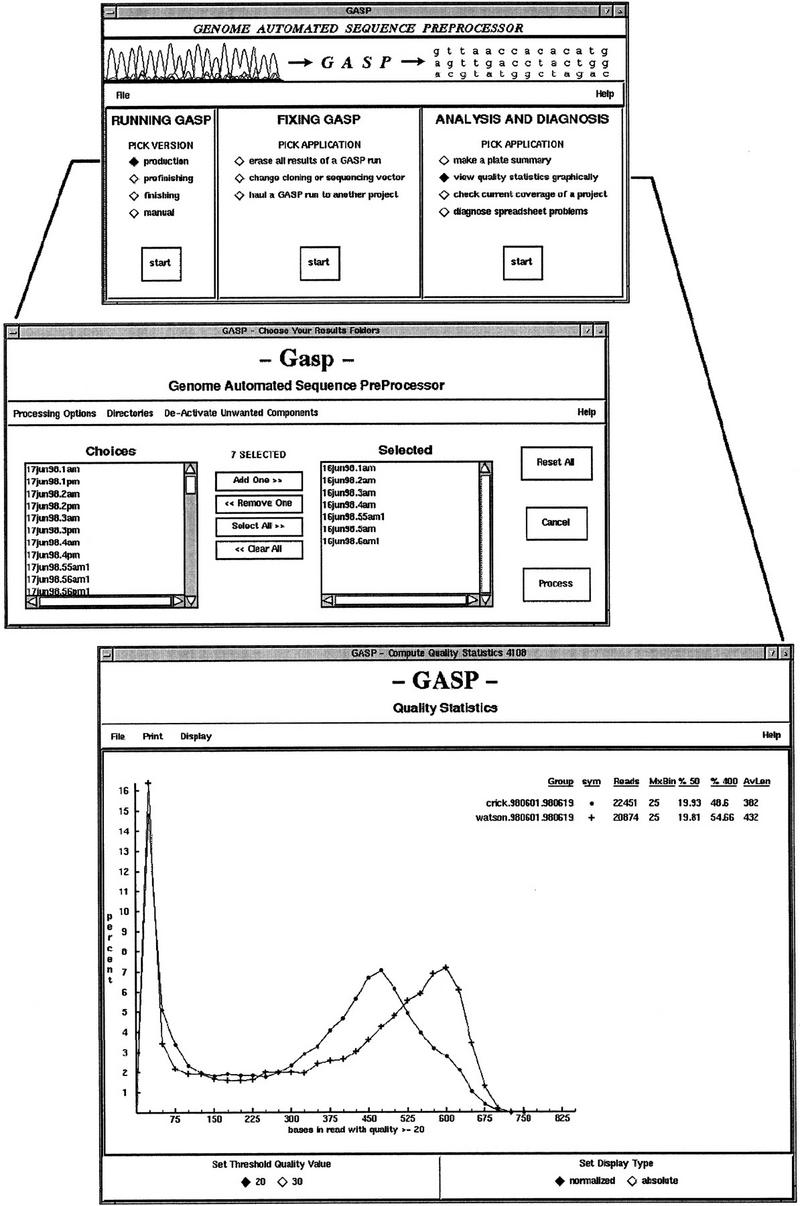
Graphical user interfaces. Main interface (top) serves as an integrated platform for all the preprocessing tools and is divided into three sections: preprocessor versions for specific types of reads (e.g., shotgun reads), error correction tools, and tools for analysis. As a result, users do not have to memorize numerous script names and command line options to use the toolkit effectively. Another interface (middle) is used to communicate input parameters to the sequence processing engine. The modified Unix environment is inherited from the main interface and two-way communication between the interface and the main program is handled via Perl’s IPC::Open2 utility. A viewer for sequence quality statistics (bottom) enables inspection of results from a base quality standpoint. It has proven to be an effective means of monitoring the overall shotgun sequencing process and has come to play a role in evaluating changes in lab protocols.
An important diagnostic feature of the package is the ability to analyze processing results through reports of various kinds. Compiling these reports can be computationally intensive because a desired piece of information usually must be derived from a large number of DNA fragment reads. Because certain analyses may depend upon tens or even hundreds of thousands of reads (especially for quantities integrated as a function of time), it would be impractical to compute and update all reports every time a set of reads is processed. Consequently, tools are implemented along a general methodology that allows the user to display individual precomputed analyses for a given set of reads, compute desired analyses in real time, or assemble and merge smaller analyses into larger ones according to user-specified constraints.
For example, consider the conceptually simple task of reporting sequencing success for a set of read fragments, that is, tallying number of fragment samples processed, number of passing and failing samples, number of vector, etc., and calculating their associated statistics. Group coordinators are primarily interested in daily reports and weekly summaries of these quantities. Figure 4 shows a typical daily report classified by the names of the current sequencing projects. (Similar reports are generated for lab-wide results.) Automatic Unix cron scripts manage the compilation of these reports by deriving pointers to the appropriate summary files from a set of logs created by the GASP preprocessor. Each script uses summaries as its input, parsing and merging them into the desired report. All references back to the raw data are eliminated, resulting in a process that is computationally very efficient. Further dissection of sequencing results is also sometimes required. For example, success as a function of templating or sequencing personnel, or sequencing machine can be derived from the summary files. Other quantities include gross and net trace and base counts and statistics, results classified by gel, project, or reaction type, tallies of bad primer positions or partial sequencing vector reads, and classification of failure types according to cloning and sequencing vector, poor trace quality, and abandoned samples. This flexibility offers a powerful tool for troubleshooting and a substantial savings in time and labor.
Figure 4.

Typical daily sequencing report for a group. The report is indexed by sequencing project in the first column: The first two projects are Caenorhabditis briggsae fosmids, those prefixed by H are human clones, and the remaining project is a C. elegans YAC. In order of appearance, the remaining columns show number of reads processed, number that entered the database, number which were vector sequence, name of the cloning vector, total number of reads currently in the database, total number of contigs currently in the database, basepair length of the clone based on the current assembly, average number of bases per read based on trace clipping, and the logging date. Below these are column totals: number of reads processed, number that entered databases, and number of vector reads. The last line gives overall percentages of reads that assembled and reads that were vector sequence. Information is reclassified for other reports, for example, weekly summaries are also indexed by the organism being sequenced. These reports assist group coordinators in tracking continuously the success of their sequencing group and in troubleshooting problems as they arise.
Base-quality values (Ewing and Green 1998) are also considered to be an important metric for shotgun sequencing and a dedicated viewing tool manages their analysis and display (Fig. 3, bottom). The viewer is capable of integrating quality results for arbitrary sets of reads according to predefined user queries. For example, Figure 5 shows three project-based analyses from a human PAC clone for selected plates, gels, and reaction types. The abscissa gives the number of high-quality bases per read, whereas the ordinate gives the number of reads. In Figure 5a, quality results for 4 of the 31 plates allocated for the project are superimposed. An anomaly is visible immediately for plate og26 in the form of a large grouping near the origin. Almost 70% of the reads have ≤50 quality bases and the average read length based upon quality is extremely short. In this case a 96-channel pipettor failed to dispense DNA properly, compromising most of the sequencing reactions. Results for plate om79 are somewhat improved, whereas those for plates og37 and og45 are clearly the best. The latter two plates show average read lengths >400 and very few reads with <50 good bases. Figure 5b shows the same data from representative gels for these plates. Figure 5c shows a comparison of fragments sequenced with our current dye-primer and dye-terminator chemistries, designated by “s1” and “x1,” respectively. The curves reflect a trend realized lab-wide: Dye-primer reactions continue to outperform dye-terminators by a significant margin. Specifically, the two functions are approximately proportional up to a read length of 225 after which dye-terminator response decays. Dye-primer reads, however, offer much better results with a peak occurring at a read length of 450 bases and a number of samples reading past 600 good-quality bases. Though not shown, the viewer is used routinely in several other roles too, for example large-scale analyses as a function of time, clone type, read type, or sequencing group.
Figure 5.

Typical classifications of base quality statistics for a sequencing project: (a) by plate name, (b) by gel name, and (c) by reaction chemistry. Each frame is imported directly from the viewer shown in Fig. 3 and is unretouched with the exception of adding a label to indicate the classification being displayed. (Such labels are not used in the software because an arbitrary mixing of groups is permitted on a single display.) The first and second columns in the legend show the symbol used to identify each function and the function name. In a function names are plates; in b and c they are gel names and read types. (s1) Current dye-primer and (x1) dye-terminator read-type chemistries. The next two columns show the number of DNA fragment reads in each function and the location on the abscissa at which the function maxima occur. The columns give the percentage of reads in each function having 50 (%50) or fewer good bases and 400 (%400) or more good bases and the remaining column is the average read length for each function.
Several of the support tools that enable users to correct or amend preprocessing output are also noteworthy. For example, one such tool is used to remove the entire output of a preprocessing session in the event of undetected problems, such as misnamed plates. The application, launched from the main interface in Figure 3, allows the user to browse a sequencing project by date, gel name, or plate name, then manages the deletion of all files in the main project directory and all relevant subdirectories. A related tool can be used to perform a global move from one sequencing project to another in the event of a project misnaming. Additional programs manage vector changes and creation of additional summaries. This set of tools substantially reduces the users’ dependence upon programming staff and helps make GASP substantially more robust overall.
Another aspect of the system is the modularity of the overall design and implementation. Modularity allows rapid reconfiguration when necessary, for example, the ability to change processing modules as mentioned above. However, it also benefits both the users and maintainers of the system in several other tangible ways. For instance, many of the graphic interface components have been implemented as Tk metawidget objects. Because these customized objects have essentially the same level of reusability as the Tk base classes, they not only save appreciable programming time, but also provide uniformity to the users, resulting in reduced training time and decreased probability for mistakes. Moreover, the capacity for managing the system is enhanced by the use of Perl modules. Many of these modules are object-oriented classes and appear frequently throughout the code, some a dozen times or more. Modularity will continue to play an important role as the system evolves and expands.
Overall the GASP system has proven to be a reasonable answer to our processing requirements. User reaction has been favorable, particularly because of the decreased time that must be spent daily on sequence preprocessing when compared to our earlier software approaches. Prior to GASP, traces had to be divided according to their sequencing project, requiring significant manual effort on the part of the user. This is now managed automatically by the template lookup process, which derives the project name from stored information. Graphics, input validation, and repair tools were also minimal, whereas in GASP they are basic features. The end result is that users now spend relatively little time on sequence preprocessing.
To date, our respective labs have produced a total of ∼180 Mb of finished sequence (of various organisms) and GASP has processed the majority of contributing reads. We expect that development efforts will pace future increases in sequencing rate rate and that GASP will continue to be used as our standard sequence preprocessing system.
METHODS
Design, development, and implementation of software tools in a large-scale sequencing environment can be difficult from a programming standpoint. Our laboratory operations are divided among several quasi-independent groups, each of which has full sequencing capability. Software must therefore be modular and flexible enough to accommodate processing differences among the groups, yet must be unified to a degree that further development and maintenance remain manageable. It must also be able to process reads from several organisms simultaneously and from each stage of sequencing: shotgun, automated finishing, and the final manual finishing phase. An object-oriented approach lends itself well to these requirements. The serial data flow (Fig. 2) also suggests a component-based system similar to that used by hopper (Smith et al. 1997) in which each step represents a link that can be inserted or deleted. Perl proves to be an ideal development language for these needs not only because it can interface directly to the Unix system, but also because of its powerful text-handling features, good execution speed, widespread usage and portability, and object-oriented capability (Wall et al. 1996). Moreover, its extension to the Tk graphics language simplifies user-interface development (Srinivasan 1997). A debugger and execution profiler provide additional diagnostic tools. Overall, Perl has proven to be more than satisfactory with respect to sound software-engineering requirements.
Whereas the main processor can be executed automatically as a Unix cron job, graphic user interfaces introduced in Figure 3 are utilized currently for all user interactions. The interfaces read necessary information directly from configuration files, for example pointers to external programs and fixed file and directory names. This enables rapid and convenient updating when certain parameters change. Other items, e.g. the user’s sequencing group and the desired mode of processing (shotgun, autofinishing, or manual finishing), are specified via the interface.
Figure 6 shows a schematic of data organization. Raw DNA fragment trace files are generated from the retracking step and are placed in Unix directories (usually referred to as gel folders, or simply folders, by laboratory personnel). Starting GASP in shotgun or autofinishing mode spawns the processor interface (Fig. 3, middle) with which the user chooses the desired folders for processing and configures any other run-time parameters. The finishing version interface (not shown) has additional capability for manual template information entry to solve the problem of vector lookup for special inputs, such as PCR products.
Figure 6.

Unix file system organization for the sequence preprocessor package. Raw DNA fragment trace files, organized by gel (gel folders), are inputs for the preprocessor. Processed reads suitable for assembly are written to disk in the appropriate sequencing project directories. Further structure is created automatically within projects by the software as needed. For example, reads that were successfully processed but contain unusable data, e.g. vector sequences, are placed in a Failures directory. Reads that could not be processed, such as cases in which the trace file contains no data, are put into an Abandoned directory. The Logs directory holds all the indexed summaries and text-based log files; the Qstats directory contains base quality statistics files. This arrangement maintains a convenient division for files of various types.
When the user initiates processing, a series of tests is spawned to evaluate the input. These tests include checking for sufficient disk space in destination projects (Fig. 6) and scanning the input list for corrupt or repeated read names. Projects are queried to find any existing reads whose names match those in the processing list, flagging any potential misnamings. At the GSC, projects are also checked for on-line status and a lock file is generated in each project directory, preventing any disk-management utilities from moving the directory while the processing is active. For shotgun mode, project directories are also scanned for database lock files to ensure that anyone editing currently is not interrupted. If none are found, a new lock file is created to reserve the database for incremental assembly after processing is complete. If any problems are detected, an extensive report describing them is dumped to the monitor, all lock files are removed, and execution halts. Validation of the input in this fashion makes GASP far more robust to unforseen problems. Once validation is complete, the user can reasonably presume that processing will continue successfully and can attend to other tasks. Whereas some of these tests are performed by hopper, the degree to which other systems treat this problem is unclear.
Serial processing of all DNA sequence trace files in the selected folders is initiated upon completion of input validation. Traces are abstracted as objects via a special Perl class, ExpTools.pm, in which information is represented in standard experiment file format (Bonfield and Staden 1995). ExpTools.pm handles the complete format including base-quality information (Ewing and Green 1998), which is now advocated widely for increasing assembly performance, and manages all interactions including object construction, input and output (I/O), queries, and content modification. The traces are then passed through the series of modules that were introduced in Figure 2. In greater detail, the modules perform the following operations.
Trace File Conversion
This module basically serves as a wrapper around the Phred base-caller (Ewing et al. 1998) to convert trace files from Applied Biosystems Inc. (ABI) proprietary format to standard (SCF) format (Dear and Staden 1992). It also creates a new experiment file object with standard header information, such as read name and date.
Template Information
Template information is used not only in preprocessing, but also later in tracking (e.g. for sequencer and template preparation personnel statistics) and finishing. The so-called embellishing module derives this information and adds it to the read object. At the GSC, information is currently imported directly from spreadsheets maintained by each group for shotgun and automated-finishing reads. In addition to its native format, spreadsheet software is configured to write tab-separated flat files for input to the processor. Because differences exist in the organization of each group’s spreadsheets, the lookup process is built around an object class that is able to search through arbitrarily ordered columns and rows to locate the desired plate information. At the Sanger Centre, Perl code interfacing to a laboratory tracking database built onto ACEDB is used for this purpose. Both laboratories, however, are migrating toward relational laboratory tracking databases managed by the commercially available Oracle database system. Access of template information will eventually be managed by a database interface, which will likely take the form of a Perl module using the standard Perl DBI and DBD::Oracle database access packages.
The lookup process can consume significant central processing unit (CPU) time if executed for each read, therefore, another object class maintains a lookup cache, so that lookup occurs only once per plate. Based on the read’s clone and organism ancestry, additional tables (Perl.pm modules) are used to derive cloning vector information, vector sequence file names, and cloning and primer site information. For manual finishing reads, lookup is skipped and information is distilled directly from the cache, which was created by the interface at the start of execution. Finally, additional identifiers are derived from the read name, including the direction of the read, reaction chemistry, and strand.
Base-Calling
Like trace file conversion, the module for base calling is simply a wrapper around phred, which derives bases and quality values from the four trace signals. Phred’s output is parsed, reformatted, and added to the object. For shotgun and automated finishing reads, this step is completely automatic. For finisher reads, however, a trace viewer (Gleeson and Hillier 1991) can be opened for each read so that the user may modify clipping.
Local Trace Information
Additional information is extracted from each trace for tracking purposes, for example gel and machine ancestry, signal strengths, primer type and position, and average spacing. These fields are parsed directly from the header of the SCF trace file using Perl’s regular expression capability.
Vector Screening
The last three steps in Figure 2 are managed by separate modules, each serving as an interface to the Staden Package vector clipping program (Staden 1996). The first and second modules implement sequencing and cloning vector screens, respectively. Some I/O overhead is incurred because the read object must be written to disk as a temporary file for the vector program to operate on. Results are then parsed and a failure tag is added to the read object if vector was detected. The third module functions as a quality-control filter for sequencing vector. Because the entire sequence is scanned, it proves to be an effective trap for sequencing vector in cases in which some of the vector has been deleted.
When the read emerges from these modules, it carries either a passing or a nonpassing status. Whereas passing denotes successful processing, nonpassing implies that a sample either failed one of the processing steps or was totally abandoned because of a fatal error. For example, a trace could fail because of poor trace quality, cloning vector sequence, or no insert being present. Abandoned traces occur much less frequently and are usually the result of missing data in the trace file. With its status determined, the read, which is actually now a file pair (SCF and experiment file), enters a postprocessing mode. Its project destination is derived quickly by again referring to the template cache. Passing reads are sent to the appropriate project directory on disk (Fig. 6). Failing and abandoned reads are each sent to their respective subdirectories, “Failures” and “Abandoned,” and a log is kept in the “Logs” subdirectory with a one-line summary of the read’s outcome. This information, derived from the return values of the modules, is simply appended to the log as each read emerges from the last module. Finally, the read name is appended to an appropriate file of filenames in the main project directory, e.g. a file of passing reads, failing reads, or abandoned reads, for use by other software tools. The cycle is then repeated for all remaining traces in the selected gel folders. Upon conclusion of this serial mode of processing, cache files are purged from the disk, database lock files are removed, and the code enters a batch mode of processing. A second series of modules is then initiated in each project directory for which reads were processed.
Incremental Fragment Assembly
Whereas phrap (P. Green, pers. comm.) is our primary assembly tool, a module interface to gap (Bonfield et al.1995) is used to incrementally add the processed reads to an existing assembly. If a gap database does not yet exist, one is created before beginning assembly. This is a convenient way to monitor progress of the sequencing project. The output is parsed for total number of current reads and contigs, total and average contig length, and average coverage and these statistics are written to an assembly log file.
Compiling Quality Statistics
Base-quality values greatly assist sequence assembly, but they are also useful as a measure of overall sequence quality as discussed above. A separate module therefore compiles statistics on phred quality (Ewing and Green 1998), q, which is directly related to probability of base correctness, p, by the following equation.
 |
1 |
Quality values are read from the experiment files and those of q ⩾ 20 are compiled as “good” quality bases. The analysis is build around a dedicated object class that carries out the actual calculations. Data are grouped in individual bins of i good bases, each with the following discretization.
 |
 |
2 |
Binning is necessary because the number of good bases in a given read can vary over several orders of magnitude. Equation 2 represents standard sequential binning and reduces this variability to a reasonable number of groups, m, for i = 25 at current read-length capability (Peters and Van Voorhis 1940). Results for a particular group of reads are represented simply as a frequency distribution, fj, over all m bins, enabling data to be displayed in standard frequency polygon form (Kreyszig 1988) as shown in Figure 5. Each gel is analyzed for quality in this way as is the entire batch of reads from each project, both as a single group and subclassified by read type. The quality analysis of the entire project is also updated. All analyses are written to files in the “Qstats” subdirectory of the project (Fig. 6).
As mentioned above, the first two columns in the viewer legend are simply the function name and its symbolic identifier. Remaining statistical quantities are computed directly from fj. For example, the third column gives the total number of reads in a function, Σfj. The fourth column gives the groups at which function maxima occur, that is bin, xj, at which fj is greatest. The next two columns show the percentages of reads containing ≤50 or fewer good bases and ⩾400 good bases, respectively. They are computed simply by determining their corresponding fractional areas under a given curve. These quantities are taken as indicators of extremely poor reads, which would add little value to an assembly, and high-quality reads, which are optimal for assembly. An average read length based upon quality, lavg, appears in the last column and is computed using the following equation.
 |
3 |
Equation 3 is essentially the ratio of the total number of good bases (q ⩾ 20) to number of reads for bin 75 and above. Whereas reads of <75 good bases may still be used, they are excluded from the standpoint of a failed reaction and are, therefore, not included in the calculation. Because a certain amount of information is lost in the discretization process in Equation 2, a uniform distribution is assumed across each bin and the mean is used to compute the total number of good bases.
Indexed Summaries
Several other modules, all of which use a dedicated summary object class, calculate indexed summaries of the current set of reads. This process refers back to each read’s completed experiment file for input. For shotgun reads, two summaries are created, one indexed by gel name and one by plate name. For automated and manual finishing reads, a single overall summary is made. Each of these compilations contains the statistics for passing/failing reads, a classification of failure types, and a summary of the base-quality statistics and can be parsed to create status reports of the type discussed in Figure 4.
Record Information
Lastly, a module is run which creates a single header file containing pointers to everything generated for the current set of reads. These files serve as input for a graphic deletion tool, which is accessible from the main interface.
Execution concludes when batch processing is finished in the last project. Typically, users will start the preprocessor in the late afternoon before leaving so that execution is finished by the next morning when summary files are parsed to distill daily results. Execution speed must be sufficient to manage the 2500–3000 reads processed typically in a single session. Code development was therefore undertaken with speed as a primary focus. Goto statements are avoided in computationally intensive areas since Perl performs an outward scan from the current location to find the indicated label. Run-time-compiled regular expressions are also minimized because of their inefficiency. Standard optimization procedures are also employed, such as placing invariant code outside of loops and employing caches whenever possible. [Information caching is used more widely in the code than what is represented here. For example, the current version of the base-caller is tracked by an experiment file tag. Because this can be assumed to be constant during any single run, the version is derived for the first read and cached or rapid lookup on succeeding reads.] Perhaps the greatest speedup results from piping the read object from one module to another, enabling the complete set of modules for a read to be executed under a single Perl system call. Perl’s open function provides a convenient implementation of this approach:
 |
As shown, the first module operates on the DNA fragment trace file, trace, and pipes the read object to the next module. This process continues through all modules after which the final Unix pipe returns the read object to the PIPE file handle, from which a completed experiment file is created on disk. This approach was found to be a factor of two to three times faster than executing modules under individual system calls, not only because of the high overhead of such calls, but also because of the disk I/O that would be required to pass the read object between each step. Unnecessary processing is also avoided, for example if a trace fails early in the cycle, succeeding modules are skipped.
As the rate of shotgun sequencing continues to increase, further development will continue to focus on database interfacing (as discussed above), increasing processing speed, and enhancing robustness. The feasibility of distributed (parallel) execution is being studied, as is the reimplementation of certain computationally intensive components as C extensions to the Perl source code. Effort will also target better recovery from computer or network failure. Currently, simple scripts are used to remove partial results and lock files so that the user may restart processing. However, we are discussing modifications that would allow the user to continue processing starting from the point of failure.
AVAILABILITY
GASP software is available freely to academic researchers for research purposes, and by agreement to other users from the GASP web site. The address is http://genome.wustl.edu/gsc/gasp/gasp.html. A number of related GNU-licensed Perl classes are available from this site as well, including the experiment file class, ExpTools.pm. Because the package continues to be developed, no automated installation scripts are included. However, extensive installation instructions are available in the form of a PostScript document from the website. It covers source code and structure, Perl issues, editing the configuration files, and setting required environment variables. Essentially, a Unix platform running Perl version 5.002 or higher is required along with Macintosh-to-Unix connectivity for moving raw DNA trace files from the sequencing Macintosh machines to the Unix domain. The Staden sequence assembly package must also be installed (Roger Staden, rs@mrc-lmb.cam.ac.uk), as well as the Phred base-caller (Phil Green, phg@u.washington.edu) and Ted trace viewer (LaDeana Hillier, lhillier@watson.wustl.edu). Those interested in using alternate assembly, base-calling, or trace viewing software may do so by extending existing modules to interface to the desired package. All source code is liberally commented for this purpose.
Acknowledgments
This work was supported by grants from the National Institutes of Health (HG01458 and HG00956) and the Wellcome Trust. The help of Tin Le (Genome Sequencing Center) with sequence data is greatly appreciated.
The publication costs of this article were defrayed in part by payment of page charges. This article must therefore be hereby marked “advertisement” in accordance with 18 USC section 1734 solely to indicate this fact.
Footnotes
E-MAIL mwendl@watson.wustl.edu; FAX (314) 286-1810.
REFERENCES
- Bonfield JK, Staden R. Experiment files and their application during large-scale sequencing projects. DNA Sequence. 1995;6:109–117. doi: 10.3109/10425179609010197. [DOI] [PubMed] [Google Scholar]
- Bonfield JK, Smith KF, Staden R. A new DNA sequence assembly program. Nucleic Acids Res. 1995;23:4992–4999. doi: 10.1093/nar/23.24.4992. [DOI] [PMC free article] [PubMed] [Google Scholar]
- Cooper ML, Maffitt DR, Parsons JD, Hillier L, States DJ. Lane tracking software for four-color fluorescence-based electrophoretic gel images. Genome Res. 1996;6:1110–1117. doi: 10.1101/gr.6.11.1110. [DOI] [PubMed] [Google Scholar]
- Dear S, Staden R. A standard file format for data from DNA sequencing instruments. DNA Sequence. 1992;3:107–110. doi: 10.3109/10425179209034003. [DOI] [PubMed] [Google Scholar]
- Ewing BG, Green P. Basecalling of automated sequencer traces using phred. II. Error probabilities. Genome Res. 1998;8:186–194. [PubMed] [Google Scholar]
- Ewing BG, Hillier L, Wendl MC, Green P. Basecalling of automated sequencer traces using phred. I. Accuracy assessment. Genome Res. 1998;8:175–185. doi: 10.1101/gr.8.3.175. [DOI] [PubMed] [Google Scholar]
- Gleeson T, Hillier L. A trace display and editing program for data from fluorescence based sequencing machines. Nucleic Acids Res. 1991;19:6481–6483. doi: 10.1093/nar/19.23.6481. [DOI] [PMC free article] [PubMed] [Google Scholar]
- Gordon D, Abajian C, Green P. Consed: A graphical tool for sequence finishing. Genome Res. 1998;8:195–202. doi: 10.1101/gr.8.3.195. [DOI] [PubMed] [Google Scholar]
- Kreyszig E. Advanced engineering mathematics. New York, NY: John Wiley and Sons; 1988. [Google Scholar]
- Larson S, Jain M, Anson E, Myers EW. Tech. Report TR96-04. Tucson, AZ: Department of Computer Science, University of Arizona; 1996. An interface for a fragment assembly kernel. [Google Scholar]
- Lawrence CB, Honda S, Parrott NW, Flood TC, Gu L, Zang L, Jain M, Larson S, Myers EW. The genome reconstruction manager: A software environment for supporting high-throughput DNA sequencing. Genomics. 1994;23:192–201. doi: 10.1006/geno.1994.1477. [DOI] [PubMed] [Google Scholar]
- Mardis E, Wilson R. Shotgun sequencing. In: Birren B, Green ED, Klapholz S, Myers RM, Roskams J, editors. Genome analysis: A laboratory manual, Vol. 1, analyzing DNA. Cold Spring Harbor, New York: Cold Spring Harbor Laboratory Press; 1997. pp. 397–453. [Google Scholar]
- Marshall E, Pennisi E. NIH launches the final push to sequence the genome. Science. 1996;272:188–189. doi: 10.1126/science.272.5259.188. [DOI] [PubMed] [Google Scholar]
- Myers EW. Tech. Report TR96-07. Tucson, AZ: Department of Computer Science, University of Arizona; 1996. A suite of Unix filters for fragment assembly. [Google Scholar]
- Peters CC, Van Voorhis WR. Statistical procedures and their mathematical bases. New York, NY: McGraw-Hill; 1940. [Google Scholar]
- Smith TM, Abajian C, Hood L. Hopper: Software for automating data tracking and flow in DNA sequencing. Comput Appl Biosci. 1997;13:175–182. doi: 10.1093/bioinformatics/13.2.175. [DOI] [PubMed] [Google Scholar]
- Srinivasan S. Advanced Perl programming. Sebastopol, CA: O’Reilly and Associates; 1997. [Google Scholar]
- Staden R. The Staden sequence analysis package. Mol Biotech. 1996;5:233–241. doi: 10.1007/BF02900361. [DOI] [PubMed] [Google Scholar]
- Wall L, Christiansen T, Schwartz RL. Programming Perl. 2nd ed. Sebastopol, CA: O’Reilly and Associates; 1996. [Google Scholar]
- Watson JD. The Human Genome Project: Past, present, and future. Science. 1990;248:44–49. doi: 10.1126/science.2181665. [DOI] [PubMed] [Google Scholar]
- Wilson R, et al. 2.2 Mb of contiguous nucleotide sequence from chromosome III of C. Elegans. Nature. 1994;368:32–38. doi: 10.1038/368032a0. [DOI] [PubMed] [Google Scholar]