

Abstract
The currently favored approach for sequencing the human genome involves selecting representative large-insert clones (100–200 kb), randomly shearing this DNA to construct shotgun libraries, and then sequencing many different isolates from the library. This method, entitled directed random shotgun sequencing, requires highly redundant sequencing to obtain a complete and accurate finished consensus sequence. Recently it has been suggested that a rapidly generated lower redundancy sequence might be of use to the scientific community. Low-redundancy sequencing has been examined previously using simulated data sets. Here we utilize trace data from a number of projects submitted to GenBank to perform reconstruction experiments that mimic low-redundancy sequencing. These low-redundancy sequences have been examined for the completeness and quality of the consensus product, information content, and usefulness for interspecies comparisons.The data presented here suggest three different sequencing strategies, each with different utilities. (1) Nearly complete sequence data can be obtained by sequencing a random shotgun library at sixfold redundancy. This may therefore represent a good point to switch from a random to directed approach. (2) Sequencing can be performed with as little as twofold redundancy to find most of the information about exons, EST hits, and putative exon similarity matches. (3) To obtain contiguity of coding regions, sequencing at three- to fourfold redundancy would be appropriate. From these results, we suggest that a useful intermediate product for genome sequencing might be obtained by three- to fourfold redundancy. Such a product would allow a large amount of biologically useful data to be extracted while postponing the majority of work involved in producing a high quality consensus sequence.
Large-scale sequencing of the human genome has begun, and the strategies have converged significantly (Favello et al. 1995; Marshall 1995). One common strategy, random shotgun sequencing, is predicated upon randomly shearing a large piece of genomic DNA into 1- to 2-kb fragments. These smaller fragments are subcloned into a vector such as M13 bacteriophage to create a library of clones with small inserts. A number of isolates from the library are chosen, and each insert is sequenced at one or both ends. When a sufficient number of isolates are subcloned and sequenced, the entire sequence of the larger genomic fragment can be determined (Lander and Waterman 1988; Edwards and Caskey 1990).
Unfortunately the genome contains segments of DNA that are refractory to this method of sequencing, such as inverted repeats (Lee et al. 1992; Chissoe et al. 1997). These regions are usually small and can often be sequenced using alternative strategies. The current approach to genomic sequencing involves a two-step process: First a large number of randomly selected fragments are sequenced, and then there is a switch to a variety of directed strategies such as the use of dye terminators or customized primer reads to close gaps in the sequence. The decision of when to switch from a random sequencing phase to a directed one is crucial to cost-effective sequencing. Equally important is the determination of when a project is finished. Currently, the end point of sequencing is to obtain a sequence that has 10-fold fewer errors than the rate of polymorphisms in the human population (the polymorphism rate being ∼1 in 1000) (Olson and Green 1998). To achieve this high-quality sequence, ∼10-fold redundancy is required.
Recently it has been proposed that the entire genome be sequenced by a random shotgun method (Weber and Myers 1997; Venter et al. 1998). The technology and methods proposed prompt consideration of the production of an intermediate sequence. Such a sequence might provide biologists with useful information and also produce a blueprint for the long-term goal of producing a high-quality sequence of the human genome. Importantly, the production of an intermediate sequence would provide insight into possible mechanisms to sequence other organisms. For instance, given a high-quality sequence of one organism, the sequence of a second related organism might be determined through the use of low-redundancy sequencing. Comparison of a low-quality sequence to the known sequence from a highly related organism might reveal much of the genetic information. Such an approach seems particularly well suited for comparative analysis of the mouse, which is in the initial stages of sequencing and contains significant similarity to the human (Hardison et al. 1997).
To determine the usefulness of low-redundancy sequencing, we have performed a simulation of the random shotgun method using data from several projects sequenced at the Baylor College of Medicine Human Genome Sequencing Center (BCM–HGSC). Analysis of potential intermediate products has been performed, focusing on the quality of the sequence generated, its usefulness for identification of transcribed regions, and its utility for interspecies comparisons.
RESULTS
To test the usefulness of a lower-quality intermediate in the Human Genome Project (HGP), we chose to perform a retrospective analysis on six projects that have been sequenced at the BCM–HGSC. Two projects, J19 and P7, are gene rich and syntenic between human and mouse. These projects surround the region of the CD4 gene and have been characterized extensively (Ansari-Lari et al. 1998). The project J19 spans 223 kb of genomic sequence, including 18 annotated genes encoded on 156 exons (Tables 1 and 2). The expression pattern for each gene and occurrence of alternatively spliced transcripts have been determined experimentally (Ansari-Lari et al. 1997). The project P7 consists of 227 kb that is syntenic to the J19 project. Of the 18 genes annotated for J19, 17 were also identified on P7, occurring in the same order and orientation (Ansari-Lari et al. 1998). The remaining four projects are recently completed sequences that represent typical projects sequenced at the BCM–HGSC. The four projects contain a total of three known genes. The accession numbers, chromosomal location, and the number of genes present in each project are listed in Table 1.
Table 1.
Projects Used for Low Coverage Simulation
Table 2.
Genes Found in Projects J19 (Human) and P7 (Mouse)
| Gene | Size (human) | Size (mouse) | No. of exons |
|---|---|---|---|
| CD4 | 3051 | 3095 | 10 |
| A2 | 2517 | 2530 | 5 |
| B | 2129 | 2778 | 14 |
| GNB3 | 1922 | 1467 | 11 |
| C8 | 1247 | 1155 | 6 |
| ISOT | 3115 (3184) | 3176 | 19 (20) |
| TPI | 1843 | 1594 | 7 |
| C9 | 877 | 1179 | 2 (3) |
| B7 | 461 (286) (1208) | 1470 | 1 (2) (7) (8) |
| ENO-2 | 2274 | 2320 | 12 |
| DRPLA | 4341 | 4271 | 10 |
| U7 | 268 | 267 | 1 |
| C10 | 519 | 568 | 3 |
| PTP1CG | 2158 (2142) | 2024 (2148) | 15 (16) (13) |
| BAP | 1240 (1442) | 1354 | 9 (10) |
| C2f | 886 | 978 | 6 |
| C3f | 1416 (1856) | 1741 | 10 (12) |
| C6f | 643 | 2 |
Generation of Low-Redundancy Sequencing
Redundancy of coverage can be defined as the number of reads that contribute to each consensus base; for instance, fourfold redundancy would indicate that an average of four sequencing reads spanned each base. Therefore, one could calculate the redundancy of coverage by finding the lengths of all of the sequencing reads that contribute to the consensus sequence and dividing this by the number of bases in the consensus sequence. A critical issue for calculating redundancy through this method is determining the lengths of the sequencing reads that are used in the assembly, which we have termed the useful read length. To determine the useful read length, we analyzed each trace with the base-calling program Phred and counted all of the bases that were assigned a Phred quality value >20. The value of 20 represents an error rate of 1 in 100 and has proven useful as a cutoff for high-quality bases (Ewing and Green 1998). We call this method Phred20. Because Phred20 ignores low-quality bases, some of which might contribute to the assembly, this method is likely to underestimate the true redundancy slightly. It should be noted that in this study the Phred20 method is used solely for the determination of redundancy and that the assemblies utilized bases of lower quality in addition to the ones of high quality.
As a test of the randomness of the simulation, the project WX was subjected to repeated sampling, and assemblies were constructed for each iteration. To assay the simulations, we calculated the number of contigs that were assembled, similar to the graph in Figure 1. Fifty separate samplings resulted in similar numbers of contigs at each level of redundancy. The average number of contigs that were identified at twofold redundancy was 34, with a standard error of 1.0, indicating that the process utilized to generate coverages has few biases (data not shown). To further ensure a nonbiased representation, each coverage was generated independently. For example, 5× coverage does not necessarily include the same traces that were used in the 4× coverage. After generating the different coverages, the traces were subjected to the base-calling program Phred and the assembly program Phrap (Ewing and Green 1998; Ewing et al. 1998).
Figure 1.
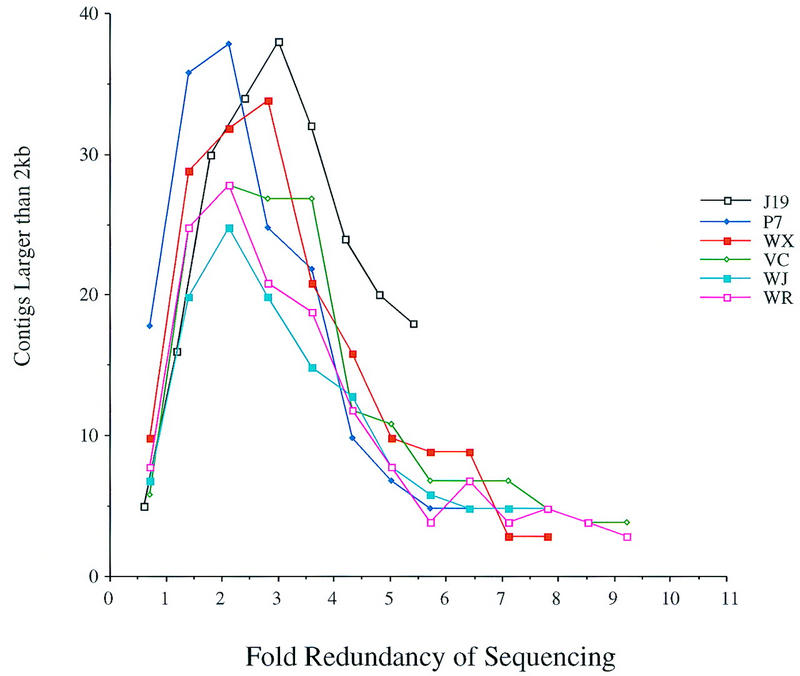
Contig formation at lower redundancy of sequencing. The number of contigs that were larger than 2 kb was calculated for each low redundancy simulation. The fold redundancy of each clone was calculated based on the number of bases that had a Phred value >20. The projects that were examined are listed at right.
Analysis of Sequence Quality
The quality of the sequence assembly was assessed by a variety of methods. To determine the number of holes, or gaps, in the consensus, we calculated the number of contigs that were larger than 2000 bases (kb) in length (Fig. 1). Contigs smaller than 2 kb are prone to misalignment and are therefore disregarded in this analysis. At very low coverage, the number of contigs is small because few reads overlap. As the coverage increases up to threefold redundancy, so does the number of contigs larger than 2 kb. This increase results from single traces or small contigs aligning with each other to form contigs that are larger than the 2-kb threshold. A sharp decline in the number of contigs is observed for most of the projects between three- and fivefold redundancy, representing the joining of contigs. After sixfold redundancy, the number of contigs is reduced much more slowly. Although the projects examined here all have different lengths, the inflection points occur at the same levels of redundancy.
Interestingly, the J19 project appears anomalous on this graph. This might be ascribed to technical problems in the random selection of traces, such as the presence of a small number of the directed reads in the initial pool (Methods). However, the presence of directed reads would be expected to join contigs and decrease the number of large contigs. More likely, the J19 project may represent a problematic sequence. This region contains a large number of repetitive elements and was difficult to sequence (Ansari-Lari et al. 1996). These data demonstrate the differences between projects and the need for increased redundancy of sequencing for a few difficult sequences.
The number of contigs formed by an assembly is one measure of the coverage; however, low-quality regions within a contig may exist. To further characterize contig quality, two separate variables were examined: the depth of coverage at each base and the estimated error at each consensus base. A region is considered to have an acceptable depth of coverage if it is spanned by at least three reads or if there is one read on each strand. The number of regions that contain a shallow depth of coverage are shown in Figure 2. Between two- and threefold redundancy, the number of areas of shallow depth reaches a peak, indicating that many contigs are shallow in depth. A rapid decline is observed between three- and sixfold redundancy and the number of areas of shallow depth decreases more gradually thereafter. The position of the peaks in these data are similar to those shown in Figure 1.
Figure 2.
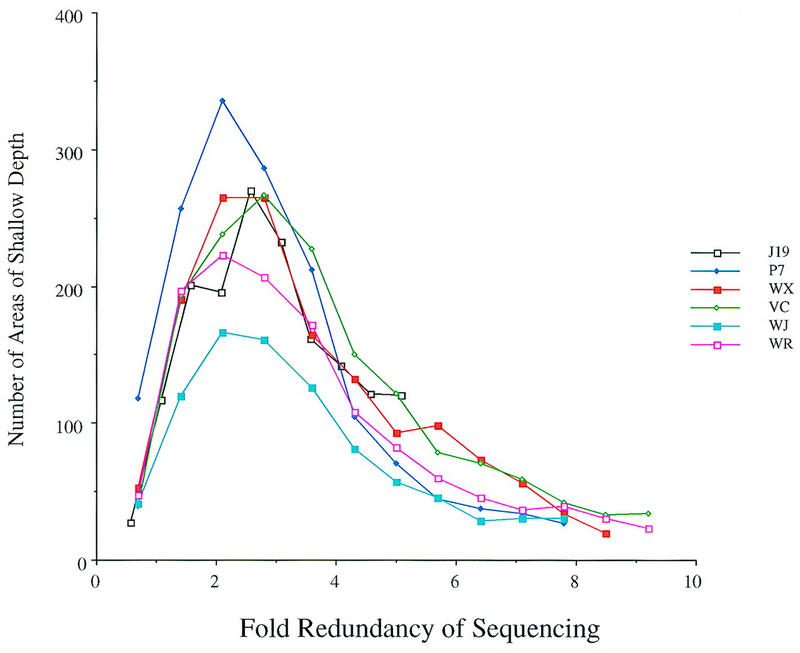
Areas containing shallow depth at lower-redundancy sequencing. The lower redundancy-simulated sequences were tested for the occurrence of areas of shallow depth of coverage (see text). The projects examined are listed at right.
The second measure of quality within a contig was to examine the estimated error at each base. This information was extracted from the Phrap assembly by counting the number of internal bases that contained a Phrap value above 40 (Methods). This value represents an error rate of 1 in 10,000, which is the maximum error rate currently recommended for the HGP. Figure 3 displays the results from analyzing the Phrap values. At the lowest coverage, many bases have a low confidence level and may be identified incorrectly. For most of the projects, 90% of the bases attain a high Phrap value at sixfold redundancy. The rate of increase of Phrap values diminishes gradually after sevenfold redundancy.
Figure 3.
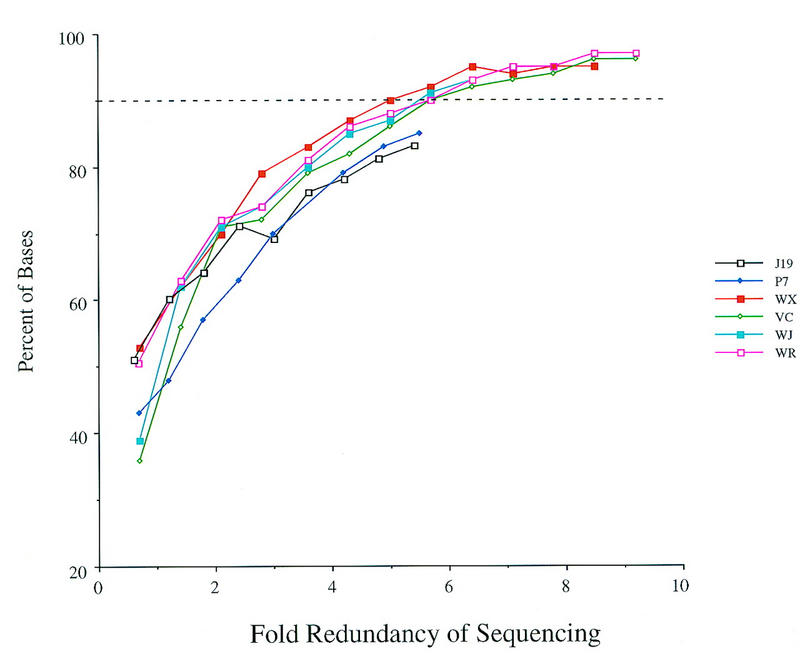
Assessment of consensus base quality at lower redundancies of sequencing. The Phrap value generated for each consensus base was examined, and the total number of bases that had a value above 40 were counted. The number of bases containing values >40 is represented as a percentage of the total number of bases in the project. Low values at the termini of contigs were excluded from the totals. A bar (dashes) at the 90% level is shown for reference purposes.
The measures of the number of contigs, the depth of coverage, and the average quality provide insight into how well each clone is being sequenced but do not provide information on the completeness of coverage. To address how much of the actual sequence is covered, we aligned the consensus contigs of a project to the known sequence. Figure 4 shows a percent identity plot for a region of J19 at different levels of redundancy. As expected, at low redundancies several regions show poor matches to the known sequence. At the higher redundancies, most of the region shows nearly 100% identity to the finished sequence, although several gaps exist. The apparent gap between 72 and 74 kb at sixfold redundancy was sequenced but was assembled in the wrong orientation and hence did not align. These data highlight the merits of directed sequencing to close many small gaps, correct misassemblies, and properly align regions in a project despite highly redundant sequencing (see Discussion). Together, the data indicate that for random shotgun sequencing, there are diminishing returns for sequencing at redundancies greater than sixfold.
Figure 4.

Alignment of contigs generated from low-redundancy sequencing to the known sequence. The lower-redundancy consensus sequences were compared to the completed sequence that was submitted to GenBank. The distance from the start of the project is indicated at the bottom, and the percent identity is indicated at left. Exons (numbered solid boxes) and repeats [SINEs other than mammalian interspersed repeats (MIRs) are light gray triangles pointing toward the A-rich 3′ end; LINE1s are open triangles; MIR and LINE2 elements are solid triangles] are indicated at the top.
Information Content of Low-Redundancy Sequences
Although high-quality sequence requires highly redundant sequencing, the genes encoded in a project may be identified well before every base is known. To determine the minimal amount of sequencing that is needed to identify genes, we performed three sets of experiments using the gene-rich projects J19 and P7. These two projects are syntenic between human and mouse, and the genes encoded in each region are shown in Table 2. In some instances, alternative transcripts have been characterized; the size and number of exons in these alternative transcripts are indicated in parentheses (Ansari-Lari et al. 1998). The first analysis performed was a comparison between the consensus sequences and the EST database (Methods). A total of 1209 ESTs scored strong hits on the finished sequence of project J19. The number of ESTs that hit at each level of redundancy is indicated in Table 3. The number of genes that could be identified by the resulting hits was also tabulated. The U7 gene, which encoded a snRNA that is identified by RepeatMasker, was excluded from this analysis. Most of the genes were identified at very low redundancies, and almost all of the genes were identified (by at least one EST hit each) at twofold redundancy.
Table 3.
Genes Identified by EST Hits
| Coverage | EST hits | Genes identified |
|---|---|---|
| 0.7 | 273 | 9 |
| 1.2 | 564 | 15 |
| 1.8 | 848 | 15 |
| 2.4 | 939 | 17 |
| 3.0 | 961 | 17 |
| 4.2 | 1066 | 17 |
| 4.9 | 1083 | 17 |
| 5.5 | 1135 | 17 |
| 6.2 | 1139 | 17 |
| Total | 1209 | 17 |
Although the exons of a gene may be identified very early in the sequencing of a project, the precise relationship between exons may not be known. For instance, if two exons from the same gene were encoded on different contigs, then the order and orientation of the exons would be unknown. The analysis is complicated further by the presence of multiple exons and multiple genes. To address these issues, we calculated the number of contigs that encoded each gene (Figs. 5 and 6). Figure 5 shows the genes from the human project J19, and Figure 6 shows the genes from the mouse project P7. The genes were divided into two groups: those that contained fewer than 10 exons (bottom panels), and those that contained 10 or more exons (top panels). The results show that the number of contigs that are spanned by a gene decreases dramatically until approximately three- or fourfold redundancy is reached; thereafter, little improvement is observed. We note that the CD4 gene from project J19 remains encoded in a large number of different contigs at higher amounts of coverage. The genomic location of this gene contains many repetitive elements and was difficult to sequence, requiring many directed reads (Ansari-Lari et al. 1998). Thus, the human CD4 gene may represent a difficult example for trying to fully characterize gene structure solely from random shotgun sequencing.
Figure 5.
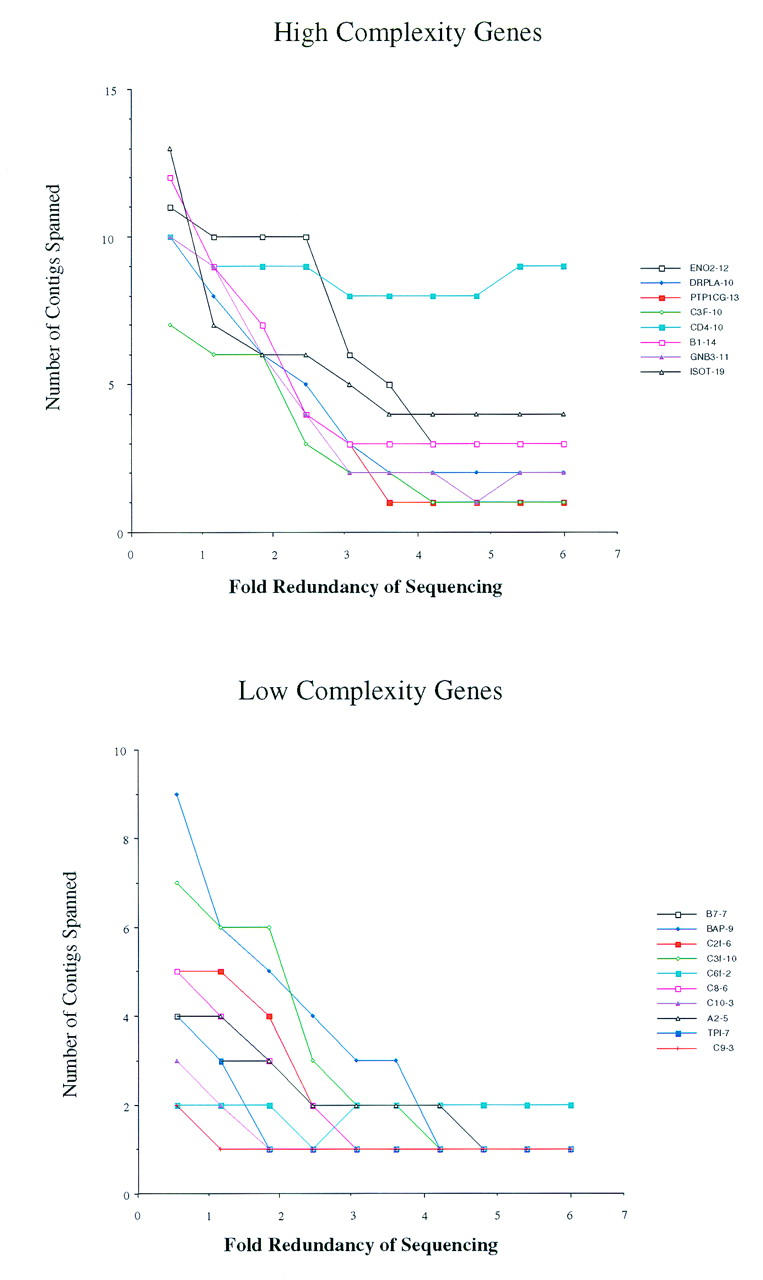
Contiguity of genes on project J19 at different levels of redundancy. The number of contigs at each coverage that described a gene was counted. (Top) The genes that contain 10 or more exons and are therefore termed complex; (bottom) the contiguity of genes that contain <10 exons are therefore termed simple. The names of the genes are indicated at right; the number of exons in each gene follows the name.
Figure 6.
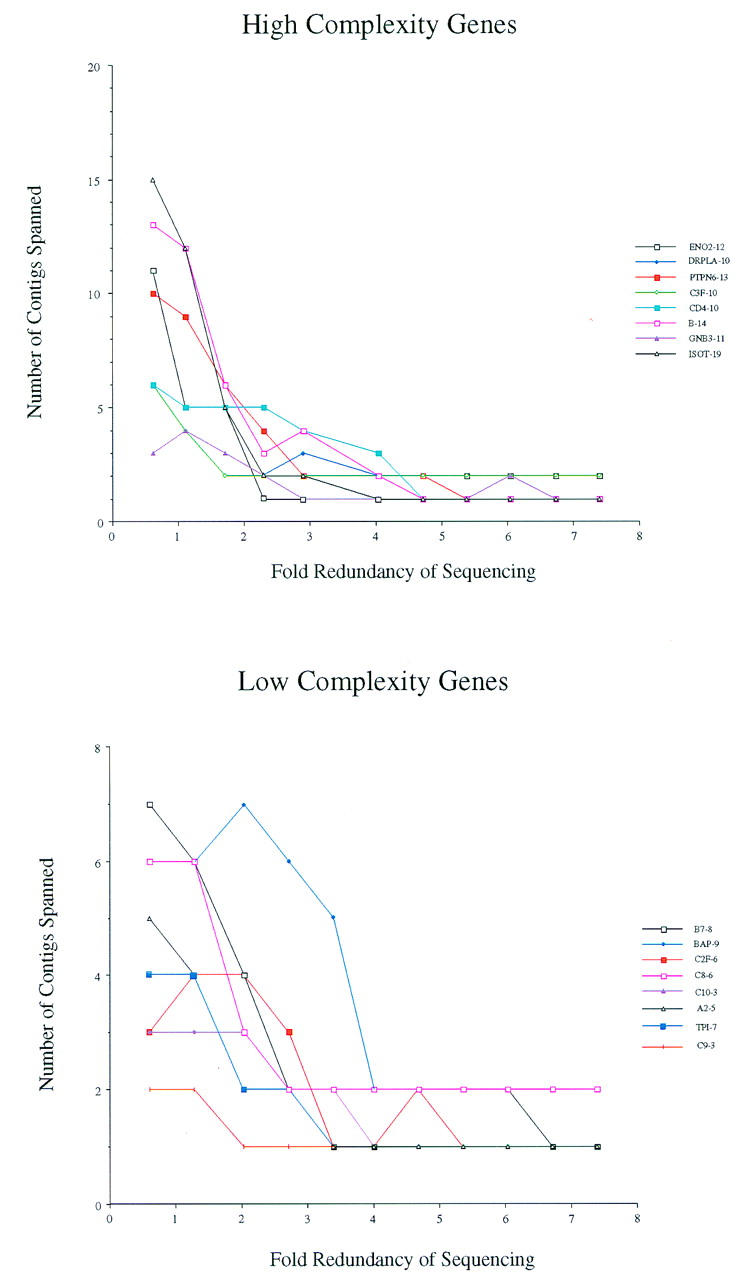
Contiguity of genes on project P7 at different levels of redundancy. The number of contigs at each coverage that described a gene was counted. (Top) The genes that contain 10 or more exons; (bottom) the genes that contain <10 exons. The names of the genes are indicated at right; the number of exons in each gene follows the name.
Interspecies Comparisons Using Low-Redundancy Sequence
The nucleotide assemblies and homology searches above relied solely on data from the reads contained in the simulation. However, in certain instances such information is known and may be taken into account. One source of such information might be a known sequence from a related organism.
A series of low-redundancy sequences from the mouse project P7 were compared to the known human sequence from the syntenic region in humans (project J19). Figure 7A shows sample data for a region surrounding the ISOT gene. At lower redundancy of coverage, large regions are not identified above the 50% level, for instance, exons 4–6 of the gene C8. However, at twofold redundancy most of the homologous regions have been sequenced sufficiently to allow for alignment. To quantitate the sequence conservation, we focused on the regions of at least 100 bp that align with no gaps at 70% identity or better. There are 154 of these regions, of which 129 (84%) coincide with exons. Figure 7B tabulates, for each level of coverage, the percentage of these regions that could be identified as meeting the similarity criterion (column 3) and the percentage that was sequenced (column 2). Here, a region was considered sequenced if it overlapped one of the contigs by at least 100 bp. The results show that nearly 95% of these regions are sequenced at 2.4-fold redundancy. In contrast, a homology search using this criterion identifies only ∼80% of the regions, due to sequencing errors that remain in the assembled contigs. These results suggest that although a region of similarity may be sequenced early in the process, the computational problem of identifying this region may remain.
Figure 7.

Interspecies comparisons at different levels of redundancy. The consensus sequences generated from low-redundancy sequencing simulations were aligned to the completed sequence. (A) Percent identity between the simulated consensus and the finished sequence is shown for a series of coverages. The fold redundancy is indicated at left, the percent identity is indicated at right, and the distance from the beginning of the project is indicated on the bottom. (Top) The exons and repeats are indicated (see legend to Fig. 4 for description). (B) The number of highly homologous regions that exists between the human and mouse projects was counted. The percent of these regions that were sequenced is indicated (Sequenced), as is the percent of these regions that were identified by a homology search (Identified).
Effort Required to Close Gaps
One of the drawbacks to sequencing a region solely by random shotgun is the inability to close all gaps. This has been illustrated above in two instances. First, despite highly redundant sequencing, multiple contigs remain for all projects (Fig. 2). Two of the projects examined here were sequenced to more than ninefold redundancy and continued to be represented by three or more contigs. Second, several of the genes that contain 10 or more exons remain on multiple contigs (Figs. 5 and 6). Two of the eight high-complexity genes on mouse chromosome 6 remained encoded in two separate contigs despite highly redundant coverage. When these projects were sequenced to completion, the gaps were closed through directed sequencing reads.
To determine the effort required to close the gaps and produce a complete sequence, we examined sequencing performed at BCM–HGSC over a 3-month period. In the first 3 months of the 1998 fiscal year, 26 projects were submitted to GenBank and consisted of a total of 3.1 Mb of unique sequence. Including overlapping fragments and vector sequences, a total of 3.9 Mb of sequence was completed in this time frame. Because some of these projects were intended to close gaps between other projects or extend existing sequence, sequencing of overlaps could not be avoided.
Including both random and directed sequencing reads, the 26 projects were sequenced to an average of 8.6-fold redundancy. The directed reads that are required to close gaps and increase the quality of a project to an acceptable level represent 1.5-fold redundancy. The additional reads represent ∼15% of all the sequence reads performed on a project.
DISCUSSION
We have performed a retrospective analysis of the random shotgun sequencing method to determine the usefulness of an intermediate product. A series of lower-redundancy sequencing simulations were examined to determine the completeness of the sequence, the quality of each consensus base, and the occurrence of gaps and low coverage regions. The data sets consistently demonstrated increasing benefits to approximately sixfold redundancy and diminishing returns thereafter. The usefulness of the low-redundancy sequences was determined through a variety of methods. High BLAST scores and the identification of exons occurred at low levels of coverage (≤2×), and the contiguity of a gene appeared at higher coverages (3–4×). The simulation data were also used to determine the utility of interspecies comparisons at lower coverages. Comparisons were made between the known sequence from human to an incomplete sequence from a syntenic region from the mouse. The data showed that most of the information was obtainable at a low level of coverage (≤2×). Finally, the relative effort of finishing a random shotgun sequencing project was noted. This cost was based on the most recent 3 months of sequencing at BCM–HGSC. The analysis demonstrates that ∼15% of the sequencing reads required to finish a project need to be directed and are not easily obtained from random shotgun sequencing.
Our data demonstrate diminishing returns for random shotgun sequencing beyond sixfold redundancy. Others have arrived at similar conclusions. Smith and Bernstein (1995) have performed similar experiments using a simulated data set. They found that at approximately sevenfold redundancy 100% of the sequence would be identified at least on one strand. Sequencing errors were not accounted for, because the data were simulated.
The number of gaps present in a project has also been studied previously. Lander and Waterman (1988) describe a formula to estimate the number of gaps in a project. Using this formula with our data we find that at sevenfold redundancy there are predicted to be five contigs. Excluding the anomalous J19 project, the average number of contigs at sevenfold redundancy is 4.9 (Fig. 1), which is in good agreement with the number predicted. Claverie (1994) employed the Lander–Waterman theorem to illustrate the effect of redundant sequencing on the number of contigs. He showed that by fivefold redundancy, the complexity had been reduced to several contigs, and by eightfold redundancy, very few contigs remain.
The detection of exons and strong BLAST scores at twofold redundancy suggests that low-redundancy sequencing might be an efficient method for detecting coding regions in genomic DNA. Claverie (1994) came to the same conclusion and successfully simulated exon identification on the X-linked Kallman syndrome gene region. Kamb et al. (1995) have extended the concept of finding genes at low coverages, by demonstrating the feasibility of identifying coding regions from low coverage sequencing. Using simulated data, these investigators were able to identify ∼85% of the coding regions at very low redundancies of coverage.
We have demonstrated that at lower levels of coverage, the sequence contains many gaps and low-quality regions. These gaps cause different exons from the same gene to be encoded on separate contigs, and this separation greatly complicates analysis. At BCM–HGSC we routinely utilize the sequence mapgap strategy, whereby randomly selected reverse reads help align disparate contigs (Edwards and Caskey 1990). We are currently experimenting with other methods of aligning contigs such as use of large insert clones (Roach et al. 1995; Chissoe et al. 1997). However, with the methods that were used for the projects examined here, it would be difficult to order exons at low redundancy of sequencing. The insert size that was used in this study was ∼2 kb; it is expected that simultaneous use of both larger and smaller insert sizes would improve contiguity. Such methods would be worthwhile investigating, assuming that the data could be usefully incorporated into an intermediate project.
As has been suggested by others (Kamb et al. 1995), the redundancy of sequencing required depends on the information one wishes to obtain. Previously, highly accurate sequence has been the goal of the HGP. Recently, it has been suggested that an intermediate product might be useful. Our data demonstrate that if such an intermediate product were intended to identify genes, twofold redundancy would be sufficient. However, if contiguity of coding regions is the goal, three- to fourfold redundancy would be appropriate. This level of redundancy should be useful to researchers, but the prospect of returning to an intermediate product to finish it raises several issues. For instance, if a region were sequenced to threefold redundancy, the cost of storing the subclone library for a long period of time might make it attractive either to remake the library or to proceed to a directed phase of sequencing. Such issues will require careful planing and cost consideration.
Currently, high-quality complete sequence is achieved through redundant sequencing followed by directed approaches. Analysis of the amount of directed sequencing at BCM–HGSC reveals that ∼15% of the reads in a project are directed. These directed reads require significantly more effort to produce than randomly selected reads. Recently Venter et al. (1998) have proposed sequencing the entire human genome by a random method. The aim of this effort is to attain 10-fold coverage of the entire human genome using a variety of different insert sizes, although some skepticism to this approach remains (Green 1997; Goodman 1998). The approach is anticipated to produce several thousand gaps. Although the different insert sizes should help align contigs to each other, the sequence between contigs will remain unknown. Our data suggest that such a project would generate much information about human genes but would provide <90% of the sequencing reads required to determine an accurate sequence of the entire human genome.
As large fragments of the human genome are sequenced, information is provided not only about human beings but also about related organisms. Clark and Whittam (1992) have explored the effect of sequencing errors by phylogenetic analysis. They conclude that for comparisons between similar groups, highly accurate data are required, and suggest that a larger amount of errors can be tolerated for comparisons between more distant groups. We have extended this observation to a situation of very high error rates found in incomplete genomic sequence and demonstrated the utility of interspecies comparisons for the purpose of finding genes in a syntenic region. One can envision an approach to sequencing related organisms by which low-redundancy sequencing is performed and the data are compared to the known sequence from a related organism. Our data suggest that this is feasible for the mouse. Furthermore, our data demonstrate that much lower redundancy of sequencing is required and approximately twofold coverage is sufficient to identify the majority of homologous regions. This result suggests an approach to surveying the genomes of related organisms through the use of low coverage random shotgun sequencing.
METHODS
Generation of Simulated Low-Redundancy Data
To simulate low-redundancy sequencing, ABI sequence trace data from a finished project were pooled and an iterative procedure was performed whereby a trace was randomly selected from the pool, copied to a new location, and then removed from the pool. The pool was replenished, and the procedure was repeated for each coverage. The traces that were sequenced to close specific gaps or increase quality at a particular region and were thus not randomly selected for sequencing were removed from the pool of available traces. A fraction of directed reads in the J19 and P7 projects could not be identified because of earlier nomenclature and were included in the random pool. We estimate that these directed reads represent <5% of the total.
The number of reads to select at a given coverage was determined by the simple formula: Number of reads = (C × S)/R, where C is the desired coverage, S is the size of the project, and R is the useful read length. For practical considerations, the useful read length was set at 550 bases, which is the average amount of sequence data extracted from recent projects at BCM–HGSC. The reads that were used in the final assemblies were subjected to Phred analysis, and the bases having a Phred value > 20 were used to determine an exact fold redundancy (see text).
Alignment of Sequencing Reads and Generation of Consensus
Sequence traces that contained vector or Escherichia coli sequences were removed from the pool before assembly. Base calls were performed with Phred version 961028, and the traces were assembled into contigs using Phrap version 960731 (Ewing and Green 1998; Ewing et al. 1998). Consensus sequences were generated from the Phrap assembly output.
Determination of Shallow Depth and Low-Quality Areas
The regions that contained low coverage were identified by analysis of the Phrap assembly output. A region was scored as containing shallow depth if (1) fewer than three sequences in a single direction were present, and (2) fewer than one sequence in each direction was present. The number of contigs was also calculated from the Phrap assemblies. Low-quality bases were removed from the ends of a contig before determining the size. Contigs smaller than 2 kb were omitted because of their low confidence level. Regions of low quality were also determined by analysis of the Phrap assembly output. After trimming the ends, a base was tallied as low quality if the Phrap value was below a threshold of 40.
Sequence Comparison
Comparison with the EST database was performed by a program called blEST (Florea et al. 1998), following removal of repetitive sequences using RepeatMasker (v. 09/19/97). For interspecies comparisons, we modified the program for generating percent identity plots (PIPs) used by Ansari-Lari et al. (1998) so that it automatically orients and aligns a set of contigs to a finished sequence. For determining the number of contigs spanned by a gene, nucleotide comparisons were performed using BLASTN version 1.0 (Altschul et al. 1990).
Acknowledgments
We thank Andrew Arenson and James Durbin for programming assistance. Appreciation is also extended to Drs. Olivier Lichtarge and Kim Worley for their critical review and helpful comments on this manuscript. J.B., J.G., D.M., and R.G. are supported by grant number HG01459 from the National Human Genome Research Institute. W.M. is supported by grant LM05110 from the National Library of Medicine.
The publication costs of this article were defrayed in part by payment of page charges. This article must therefore be hereby marked “advertisement” in accordance with 18 USC section 1734 solely to indicate this fact.
Footnotes
E-MAIL jbouck@bcm.tmc.edu; FAX (713) 798-5741.
REFERENCES
- Altschul SF, Gish W, Miller W, Myers EW, Lipman DJ. Basic local alignment search tool. J Mol Biol. 1990;215:403–410. doi: 10.1016/S0022-2836(05)80360-2. [DOI] [PubMed] [Google Scholar]
- Ansari-Lari MA, Muzny DM, Lu J, Lu F, Lilley CE, Spanos S, Malley T, Gibbs RA. A gene-rich cluster between the CD4 and triosephosphate isomerase genes at human chromosome 12p13. Genome Res. 1996;6:314–326. doi: 10.1101/gr.6.4.314. [DOI] [PubMed] [Google Scholar]
- Ansari-Lari MA, Shen Y, Muzny DM, Lee W, Gibbs RA. Large-scale sequencing in human chromosome 12p13: Experimental and computational gene structure determination. Genome Res. 1997;7:268–280. doi: 10.1101/gr.7.3.268. [DOI] [PubMed] [Google Scholar]
- Ansari-Lari MA, Oeltjen JC, Schwartz S, Zhang Z, Muzny DM, Lu J, Gorrell JH, Chinault AC, Belmont JW, Miller W, Gibbs RA. Comparative sequence analysis of a gene-rich cluster at human chromosome 12p13 and its syntenic region in mouse chromosome 6. Genome Res. 1998;8:29–40. [PubMed] [Google Scholar]
- Chissoe SL, Marra MA, Hillier L, Brinkman R, Wilson RK, Waterston RH. Representation of cloned genomic sequences in two sequencing vectors: Correlation of DNA sequence and subclone distribution. Nucleic Acids Res. 1997;25:2960–2966. doi: 10.1093/nar/25.15.2960. [DOI] [PMC free article] [PubMed] [Google Scholar]
- Clark AG, Whittam TS. Sequencing errors and molecular evolutionary analysis. Mol Biol Evol. 1992;9:744–752. doi: 10.1093/oxfordjournals.molbev.a040756. [DOI] [PubMed] [Google Scholar]
- Claverie JM. A streamlined random sequencing strategy for finding coding exons. Genomics. 1994;23:575–581. doi: 10.1006/geno.1994.1545. [DOI] [PubMed] [Google Scholar]
- Edwards A, Caskey CT. Closure strategies for random DNA sequencing. Methods: Companion Methods Enzymol. 1990;1:41–47. [Google Scholar]
- Ewing B, Green P. Base-calling of automated sequencer traces using phred. II. Error probabilities. Genome Res. 1998;8:186–194. [PubMed] [Google Scholar]
- Ewing B, Hillier L, Wendl MC, Green P. Base-calling of automated sequencer traces using phred. I. Accuracy assessment. Genome Res. 1998;8:175–185. doi: 10.1101/gr.8.3.175. [DOI] [PubMed] [Google Scholar]
- Favello A, Hillier L, Wilson RK. Genomic DNA sequencing methods. Methods Cell Biol. 1995;48:551–569. doi: 10.1016/s0091-679x(08)61403-x. [DOI] [PubMed] [Google Scholar]
- Florea L, Hartzell G, Zhang Z, Rubin GM, Miller W. A computer program for aligning a cDNA sequence with a genomic DNA sequence. Genome Res. 1998;8:967–974. doi: 10.1101/gr.8.9.967. [DOI] [PMC free article] [PubMed] [Google Scholar]
- Goodman L. Random shotgun fire. Genome Res. 1998;8:567–568. doi: 10.1101/gr.8.6.567. [DOI] [PubMed] [Google Scholar]
- Green P. Against a whole-genome shotgun. Genome Res. 1997;7:410–417. doi: 10.1101/gr.7.5.410. [DOI] [PubMed] [Google Scholar]
- Hardison RC, Oeltjen J, Miller W. Long human-mouse sequence alignments reveal novel regulatory elements: A reason to sequence the mouse genome. Genome Res. 1997;7:959–966. doi: 10.1101/gr.7.10.959. [DOI] [PubMed] [Google Scholar]
- Kamb A, Wang C, Thomas A, DeHoff BS, Norris FH, Richardson K, Rine J, Skolnick MH, Rosteck PRJ. Software trapping: A strategy for finding genes in large genomic regions. Comp Biomed Res. 1995;28:140–153. doi: 10.1006/cbmr.1995.1010. [DOI] [PubMed] [Google Scholar]
- Lander ES, Waterman MS. Genomic mapping by fingerprinting random clones: A mathematical analysis. Genomics. 1988;2:231–239. doi: 10.1016/0888-7543(88)90007-9. [DOI] [PubMed] [Google Scholar]
- Lee LG, Connell CR, Woo SL, Cheng RD, McArdle BF, Fuller CW, Halloran ND, Wilson RK. DNA sequencing with dye-labeled terminators and T7 DNA polymerase: Effect of dyes and dNTPs on incorporation of dye-terminators and probability analysis of termination fragments. Nucleic Acids Res. 1992;20:2471–2483. doi: 10.1093/nar/20.10.2471. [DOI] [PMC free article] [PubMed] [Google Scholar]
- Marshall E. Human genome project. Emphasis turns from mapping to large-scale sequencing. Science. 1995;268:1270–1271. doi: 10.1126/science.7761844. [DOI] [PubMed] [Google Scholar]
- Olson M, Green P. A “quality-first” credo for the Human Genome Project. Genome Res. 1998;8:414–415. doi: 10.1101/gr.8.5.414. [DOI] [PubMed] [Google Scholar]
- Roach JC, Boysen C, Wang K, Hood L. Pairwise end sequencing: A unified approach to genomic mapping and sequencing. Genomics. 1995;26:345–353. doi: 10.1016/0888-7543(95)80219-c. [DOI] [PubMed] [Google Scholar]
- Smith GD, Bernstein KE. BULLET: A computer simulation of shotgun DNA sequencing. Comp Appl Biosci. 1995;11:155–157. doi: 10.1093/bioinformatics/11.2.155. [DOI] [PubMed] [Google Scholar]
- Venter JC, Adams MD, Sutton GG, Kerlavage AR, Smith HO, Hunkapiller M. Shotgun sequencing of the human genome. Science. 1998;280:1540–1542. doi: 10.1126/science.280.5369.1540. [DOI] [PubMed] [Google Scholar]
- Weber JL, Myers EW. Human whole-genome shotgun sequencing. Genome Res. 1997;7:401–409. doi: 10.1101/gr.7.5.401. [DOI] [PubMed] [Google Scholar]