

Abstract
Mass spectrometry-based proteomics is a maturing discipline of biologic research that is experiencing substantial growth. Instrumentation has steadily improved over time with the advent of faster and more sensitive instruments collecting ever larger data files. Consequently, the computational process of matching a peptide fragmentation pattern to its sequence, traditionally accomplished by sequence database searching and more recently also by spectral library searching, has become a bottleneck in many mass spectrometry experiments. In both of these methods, the main rate limiting step is the comparison of an acquired spectrum with all potential matches from a spectral library or sequence database. This is a highly parallelizable process because the core computational element can be represented as a simple but arithmetically intense multiplication of two vectors. In this paper we present a proof of concept project taking advantage of the massively parallel computing available on graphics processing units (GPUs) to distribute and accelerate the process of spectral assignment using spectral library searching. This program, which we have named FastPaSS (for Fast Parallelized Spectral Searching) is implemented in CUDA (Compute Unified Device Architecture) from NVIDIA which allows direct access to the processors in an NVIDIA GPU. Our efforts demonstrate the feasibility of GPU computing for spectral assignment, through implementation of the validated spectral searching algorithm SpectraST in the CUDA environment.
Keywords: CUDA, tandem mass spectrometry, spectral library searching, peptide identification
INTRODUCTION
Mass spectrometry (MS) based proteomics is a maturing discipline with increasing utilization in many fields of biology1, 2. Modern mass spectrometers have benefited tremendously in the last decade from improvements in design as well as faster electronics and can now acquire multiple tens of thousands of spectra in a single LC-MS/MS run3. To analyze the tremendous amount of data currently being acquired on a routine basis, sequence database searching has become the preferred method for peptide and protein identification (reviewed in 4–6). The most commonly used database search algorithms quantify the similarity between the query spectrum and each potential match from the database to identify the “best fit”. For example, the database search tool SEQUEST7 uses a cross-correlation score while X!Tandem8 calculates a hyper score which is a dot product multiplied by correction factors. The MASCOT9 algorithm performs a statistical evaluation of matches between observed and theoretical peptide fragments. OMSSA10 scores provide matches by assigning a probability score to each potential fragment ion using a Poisson model for matching experimental spectra to sequences. The common theme shared by all these tools is the requirement that a similarity score is calculated for all possible theoretical spectra in the database for each acquired experimental spectra. While the throughput of sequence database search tools has improved significantly from the early generations of search software, sequence database searching is computationally expensive and frequently becomes a bottleneck in proteomics research, particularly when the search criteria are more demanding, such as with semi- or enzyme unconstrained searches and/or when considering multiple variable modifications. In addition the consolidation of acquired data in central repositories such as PeptideAtlas11 typically requires re-searching of large amounts of data files when deposited and when databases are updated.
A recent addition to tandem mass spectral analysis is spectral library search12–16. Spectral library searching utilizes a large-scale collection of high-confidence MS/MS spectra to perform searching. In this method, query spectra are compared only to reference spectra present in a given library of previously recorded MS/MS data. While it is clear that an undiscovered peptide cannot be identified, it is well known that most identifications in a typical experiment re-discover the same peptides that were identified previously because they are the most abundant and within the dynamic range of the instrument. Additionally, because the spectral library uses a representation of the actual MS/MS spectra rather than theoretical spectra, dot product-based scoring can better estimate similarity between query and library spectra. This allows more sensitive identifications of peptides that might be missed by database searching. Spectral library searching is typically ten or more fold faster than database searching because the spectral libraries are smaller than sequence databases and because the library search tools are not required to parse sequences in a database, calculate peptide masses from linear sequences, or generate theoretical peptide fragments. Spectral library searching typically requires only limited query file pre-processing and filtering, after which the code can execute a dot product calculation. Thus spectral library searching can significantly increase the throughput of proteomics data analysis and function as a complement to existing database search pipelines.
Both sequence database search and spectral library search tools are normally run on central processing units (CPUs). The scale of such operations can range from single computers to large clusters of hundreds of CPUs, the latter of which can cost hundreds of thousands of dollars to build and maintain. Because of the coarse grained nature of this problem, both search methodologies can take advantage of the inherent parallelism in MS/MS searching and run in a distributed fashion using multiple threads on a multi-core CPU or run across a computer cluster environment. As noted above, the comparisons used by various algorithms to assign a sequence to query spectra can be represented as a comparison of two vectors. This is a highly parallelizable computational process because the core computational element, when implemented as a dot product, is a simple but arithmetically intense multiplication of a vector (the query spectrum) against a matrix of vectors (the potential candidate spectra from the database or library). In many ways this task is much better suited for the massively parallel computing available on graphics processing units (GPUs) compared with modern CPUs.
Graphics processing units GPUs were developed in the 1980’s in response to a rapid increase in the computational complexity associated with the rendering of computer graphics. CPU cores are designed to execute a single thread of sequential, complex instructions while GPUs are designed for the simultaneous execution of many parallel instruction threads. GPUs are designed specifically to perform floating-point calculations to offload graphical rendering tasks from the more general-purpose CPU. Modern personal computers contain GPUs for 3D graphics acceleration, either integrated on the system motherboard sharing system random access memory (RAM) or as more sophisticated add-in graphics cards with dedicated RAM. In the last decade, consumer demand for more realistic and complex graphics, largely driven by computer gaming, has led to the evolution of highly parallel, multi-core GPUs with net computational power many times that of modern CPUs.
NVIDIA's Compute Unified Device Architecture (CUDA) is currently the most mature and feature-rich interface for developing high-performance computing applications on the GPU. CUDA is a framework that allows developers to write programs that execute on GPUs using extensions to the C programming language. OpenCL is a related, relatively new framework for writing programs that run across a heterogeneous collection of GPUs, CPUs and other processors and is a viable alternative to CUDA. General purpose computation on GPUs (GPGPU) was originally attempted using existing graphics libraries such as OpenGL, not to be confused with OpenCL. However, these libraries require that all operations be cast in terms of geometric or graphics primitives. Support for GPGPU using a widely adopted general purpose language such as C has helped bring GPU computing to a larger development community.
CUDA compatible hardware includes Nvidia GeForce 8, 9, 100, 200, and 400-series GPUs as well as dedicated Tesla GPGPUs. The NVIDIA GPU architecture consists of an array of multiprocessors each of which contains eight scalar processors. The multiprocessor executes threads in groups of 32 using a new architecture created by NVIDIA called SIMT, short for single-instruction multiple threads. Within this architecture, optimal performance is achieved when the multiprocessor SIMT unit creates, manages, schedules, and executes threads in groups of 32. The most fundamental element of a CUDA program is the kernel which defines the operations to be performed by a single thread and is invoked as a set of concurrently executing threads. When called, a kernel is executed by N different CUDA threads in parallel. For our application, the primary development considerations involved creating an optimized kernel for rapid spectral computations while at the same time optimizing data transfers to and from the GPU to keep the whole process running efficiently.
While GPUs have been used for high-performance computing in physics, chemistry, mathematics, and geology for quite a while, their use is only just gaining traction in the biosciences. A number of groups have demonstrated performance enhancements for DNA sequence alignment17, 18. Others have used the GPU for modeling anisotropic viscoelasticity of soft tissues19, and a proteomics group has used the GPU to implement a feature finding algorithm based on an adaptive wavelet transform20. There have been no reports of using the GPU for mass spectrometry spectral searching. In this paper we describe a proof of concept study in which we have successfully implemented tandem mass spectrometry spectral library searching on the GPU. Using the NVIDA CUDA architecture, we have emulated the spectral library software SpectraST in a code base we have named FastPaSS that demonstrates 8 to 26 fold speed improvement over CPU based search strategies.
METHODS
FastPaSS was written in the C for CUDA version 2.3 programming language and has been compiled on both Linux and Mac OS X platforms. It currently supports only the search mode capabilities of SpectraST13, 21. The SpectraST search algorithm involves three preliminary scoring metrics that all contribute to a final linear discriminant score termed the F-value shown in equation 1. The F-value is used to determine the best library match for a query. The three preliminary metrics that are components of the F-value score implemented by SpectraST are the dot product (D), dot bias (DB), and delta dot (ΔD) as denoted by equations 2–4.
| (1) |
| (2) |
| (3) |
| (4) |
In equation 1, the F-value is calculated as a linear combination of the dot product, delta dot, and a constant b where the constant ranges from 0 to 0.24 as a function of dot bias. The calculation of the dot product is shown in equation 2. The dot product, also referred to a scalar product, is the sum of the products between the library spectrum (Ilibrary) and query spectrum (Iquery) where the intensity value in each m/z bin in the library spectrum is multiplied by the corresponding intensity value in the query spectrum. Each of the products across the entire m/z range, from m/z 1 to the maximum mass, are summed to give the dot product score. The dot bias is a related calculation where the square of the intensities are multiplied between the library and query spectra. These products are calculated across the entire m/z range and summed. The square root of this sum, divided by the dot product score from equation 2, is the dot bias. The delta dot calculation in equation 4 is the difference between the highest and second highest dot products for a search.
The dot product measures spectral similarity, while the dot bias measures how much of the spectrum is dominated by a few peaks. The dot bias attains a value of 1.0 when all of the signal is from a single peak and approaches 0.0 when the signal is evenly distributed across the spectrum. In FastPaSS, the dot bias and dot product calculations are executed on the GPU using a custom kernel we developed; the delta dot and the F-value are calculated on the CPU after results are returned.
FastPaSS library binary format
The creation of a FastPaSS library file is accomplished using a program named sptxt2fpbin. This program reads in a spectral library in a SpectraST text format and creates an appropriately formatted binary library file for FastPaSS. The specific details of the library binary format are discussed in Supplemental C. It should be noted that the library binary format is optimized for performance. This entails not only performing all possible spectral processing steps prior to storing spectra in the library but also formatting the binary file for optimized reading. Ancillary information, such as comments associated with spectra which are present in the SpectraST library format, are not stored in the FastPaSS binary library.
Preparation of the test dataset
Publicly available mzXML files from the Human Plasma Proteome Project22 were downloaded from the Tranche distributed file share network23. The Tranche key for this dataset (PPP lab 22) is available in Supplemental D. Because SpectraST includes filters for excluding low quality spectra, all tandem mass spectra were first searched by SpectraST against the NIST human spectral library24. Datasets of various sizes (10,000, 20,000, 30,000, 40,000, and 50,000 tandem mass spectra) were generated for analysis from a pool of those spectra that passed SpectraST’s spectral filters. This was done to ensure that all query spectra in each dataset were searched rather than being discarded due to low quality. The data were converted to the Mascot generic format (MGF) for use with FastPaSS. Because SpectraST searches are most efficiently performed using mzXML files, the datasets were also converted to this format for the SpectraST searches.
FastPaSS workflow
In brief, the FastPaSS workflow includes the processing of the query file where the range of the query spectra’s precursor mass-to-charge (m/z) values are parsed and sorted in ascending order for sequential access. Optimal sets or batches of query spectra are selected, processed and represented as a matrix that is transferred from main memory to GPU memory. The query matrix is represented internally as a two dimensional array of floating point numbers. Each row of the matrix is a query spectrum, each column index represents an m/z value (where masses are rounded to nearest 1 m/z unit), and each matrix cell value is the intensity of the respective query spectrum (row) peak at the m/z location (column). A corresponding batch of library spectra, spanning the same mass range as the set of query spectra in the batch, are read and also transferred to GPU memory. To account for the user specified precursor mass tolerance, the set of library spectra loaded in the library matrix spans +/− the mass tolerance of the given query matrix mass range. A custom kernel then performs both the dot product and dot bias calculations on the GPU (see Supplemental B and E). The kernel was developed to perform both sets of calculations on the data in the GPU in one function call. By performing both calculations in the same kernel, performance is optimized by minimizing the number of data transfers between host and GPU memory that would otherwise be needed if the calculations were done independent of each other. Results are returned from GPU to the CPU where F-values scores are calculated and reported. This process is repeated until all query spectra have been analyzed. The workflow is shown in Figure 1. Specific details of the actual implementation are described more thoroughly in the Supplemental Materials.
Figure 1.
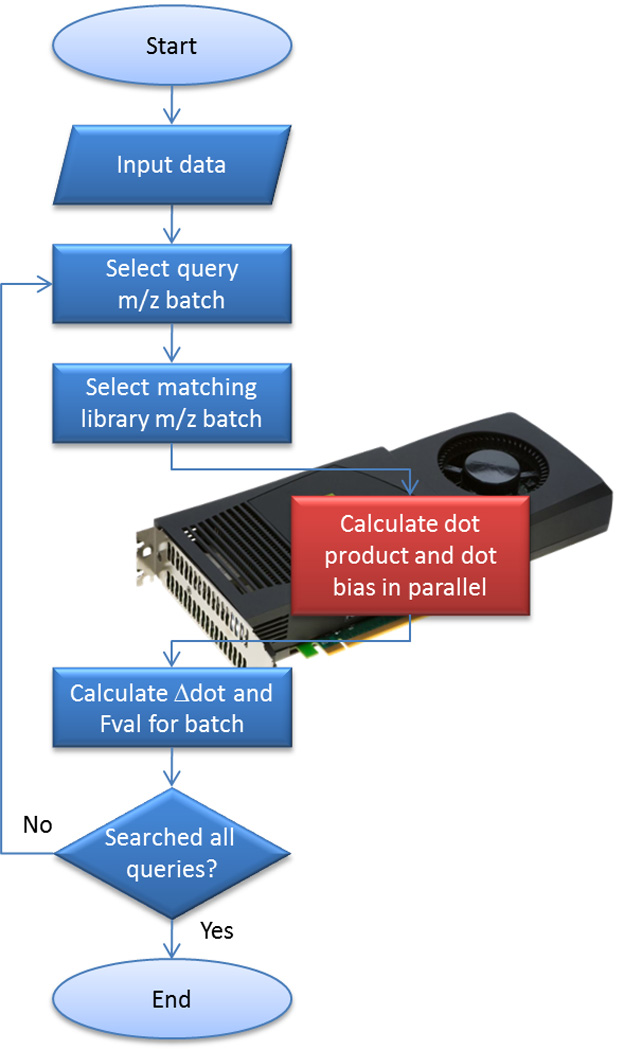
Simplified FastPaSS workflow. Elements processed on the CPU are colored blue while elements processed on the GPU are colored red.
RESULTS
The collection of input query spectra was searched against a NIST human spectral library containing 261,778 entries. FastPaSS, SpectraST, X!Tandem, and X!P325 searches were performed using the same search parameters on a Fedora 9 linux workstation with the Nvidia CUDA 2.3 SDK installed. The relevant hardware in the workstation were an AMD Phenom II X4 940 3.0 GHz CPU and an Nvidia Tesla C1060 GPU containing 240 streaming processor cores. Because we noticed significant performance differences due to the operating system caching recently accessed spectral library files, the searches were performed both with and without clearing the system cache between runs. Run times of sequential library searches against the same spectral library would reflect the cached run times reported. The cleared cache run times reflect the expected performance of an initial search, when a spectral library has not been recently accessed and thus not cached, or a query on a heavily used system where other memory access would cause the spectral library to no longer be cached by the operating system. Searches were repeated in triplicate and reported run times are the average of 3 consecutive runs.
FastPaSS was also run on a system containing an AMD Athlon 64 X2 6000+ 3.0GHz CPU and an Nvidia 8600GTS GPU. The 8600GTS GPU contains 32 streaming processor cores compared to the 240 on the Tesla C1060. The performance of FastPaSS on this system gives an indication of expected FastPaSS throughput on an extremely modest and arguably outdated GPU.
The X!Tandem sequence database searches were performed on the same set of query spectra for comparison. The spectra were searched against version 3.62 of the human International Protein Index26 database containing 83,947 sequence entries. Search parameters include tryptic and semi-tryptic cleavage (no refinement mode) allowing 2 missed cleavages, a −2.0 to +4.0 peptide mass tolerance, static modification for carbamidomethyl cysteine and a variable modification for oxidized methionine.
X!P3 or Proteotypic Peptide Profiler is a variant of the X!Tandem program that searches a sequence database composed of proteotypic peptides. To benchmark this tool, a P3 peptide sequence database was generated by extracting 160,075 unique peptides, without modifications, from the NIST human spectral library database. P3 searches were performed on the same set of query spectra using the same X!Tandem search parameters with the exception of enzymatic cleavage which has no relevance to the P3 searches.
Sensitivity and error analysis
In order to validate that the custom FastPaSS kernel faithfully reproduces the dot product and dot bias calculations of FastPaSS, a correlation was calculated between the dot product and dot bias values for FastPaSS and SpectraST. Scatter plots, which are available in Supplemental A, show a 45 degree line both with an R2 correlation value of 1.0. This indicates that the GPU based calculations performed by FastPaSS faithfully replicate the respective calculations performed by SpectraST on the CPU.
In evaluating peptide identification performance, we found over 99.99% concordance between FastPaSS and SpectraST top ranked identifications for the largest dataset (50,000 queries). The SpectraST algorithm includes a variety of filtering, spectral processing, and post dot-product analysis to arrive at a top scoring identification. The two mismatches in the 50,000 dataset, low scoring with the top scoring peptide in SpectraST is in the second position in FastPaSS, suggests that the FastPaSS implementation still contains a minor spectral processing discrepancy. The other 49,998 spectra returned the same top hit matches between FastPaSS and SpectraST with no divergence in dot product, dot bias, delta dot and F-value greater than 0.05.
Speed
The average run times for FastPaSS, SpectraST (version 4.3.1), X!Tandem (version 2007.07.01.3), and X!P3 (version 2010.10.10.4) on a set of query files of various sizes is shown in Table 1. On the AMD Tesla system, FastPaSS was 22 to 26 fold faster than SpectraST without caching, and 8 to 9 fold faster when allowing operating system caching of previously accessed files. Although not directly comparable analysis, FastPaSS was also significantly faster than the corresponding Tandem sequence database search using 4 concurrent threads. Compared to the P3 searches, FastPaSS was faster by a more modest 2 to 4 fold.
Table 1.
Run times for FastPaSS, SpectraST, P3, and Tandem. Reported times, in seconds, are the average of triplicate runs. The individual run times are presented in Supplemental Materials.
| # spectra |
FP | FP* | ST | FP1 | ST1 | P3 | Tandem tryptic |
Tandem semi |
|---|---|---|---|---|---|---|---|---|
| 10K | 8.3 | 18.0 | 68.3 | 42.0 | 1096.7 | 16.0 | 74.0 | 1214.3 |
| 20K | 11.0 | 28.0 | 93.3 | 46.3 | 1121.7 | 32.7 | 156.7 | 2582.7 |
| 30K | 13.7 | 39.0 | 121.0 | 49.0 | 1149.3 | 52.3 | 272.0 | 4494.3 |
| 40K | 16.7 | 49.0 | 145.7 | 52.3 | 1173.3 | 72.0 | 404.0 | 6552.7 |
| 50K | 19.0 | 59.0 | 173.3 | 54.3 | 1200.7 | 92.0 | 518.3 | 8507.3 |
FP=FastPaSS, ST=SpectraST, FP1=FastPaSS uncached, ST1=SpectraST uncached. All analysis were run on an AMD/Tesla workstation with the exception of the column labeled “FP*” which were run on an AMD/8600GTS personal computer.
FastPaSS was also benchmarked on a personal computer containing an AMD 3.0 GHz CPU paired with an 8600GTS graphics card. On this extremely modest consumer system, where the graphics card with 32 stream processors might be considered obsolete, the FastPaSS run times were still 3 times faster than the corresponding SpectraST times. This particular example demonstrates the clear potential of parallel GPU based computing given the promising performance of such modest graphics hardware.
DISCUSSION
We have successfully implemented the first GPU-based tandem mass spectrometry search algorithm which we have named FastPaSS for Fast Parallel Spectral Searching. This software successfully implements spectral library searching by reproducing the computational analysis performed by SpectraST. The choice to use SpectraST as a model was guided by a number of considerations including the desire to work with a familiar code base, the GPU compatibility of scoring spectral similarity using a dot product, the existence of an infrastructure to create library spectra from MS/MS datasets, the ability to quickly validate the quality of the results through direct comparison of output with SpectraST search results, and most importantly, the ability to focus implementing a parallel GPU algorithm without having to develop and optimize the tools for generating spectra from sequence databases.
FastPaSS operates quite differently than other search engines. In FastPaSS the calculation of dot products is achieved simultaneously for multiple query spectra against all possible library entries through the process of matrix multiplication on the GPU. In short, a matrix of query spectra and a corresponding matrix of candidate library spectra are transferred to the GPU and a modified matrix multiplication algorithm (kernel) is called using the NVIDIA CUDA architecture that calculates a dot product and dot bias score (equations 2 and 3) for all query spectra against all library spectra. The results for all dot products are returned to the CPU for the final calculation of an F-value composite score.
With the current matrix multiply kernel, the size of batches of spectra transferred to the GPU are limited primarily by the program's search parameters (comparison tolerance) and not by the available memory on the GPU. The average sizes of batches transferred during a typical search are much smaller than the total available memory on the Tesla C1060 GPU. This is because as the number of query files in a batch increases, the library batch size increases as well resulting in the calculation of unnecessary dot products for query-library pairs that are outside the precursor m/z tolerance. This effect of batch size versus unnecessary calculations is demonstrated in Figure 2. As the batch size grows to accommodate additional query entries, the set of corresponding library entries also grows. This results in unnecessary dot product calculations which occurs when the precursor m/z value of the library entry is outside the specified m/z tolerance range. Thus, there is a tradeoff between smaller batch sizes, which requiresmore CPU to GPU memory transfer events with more efficient matrix multiplication versus larger batch sizes resulting in more unnecessary calculations but fewer data transfer events
Figure 2.
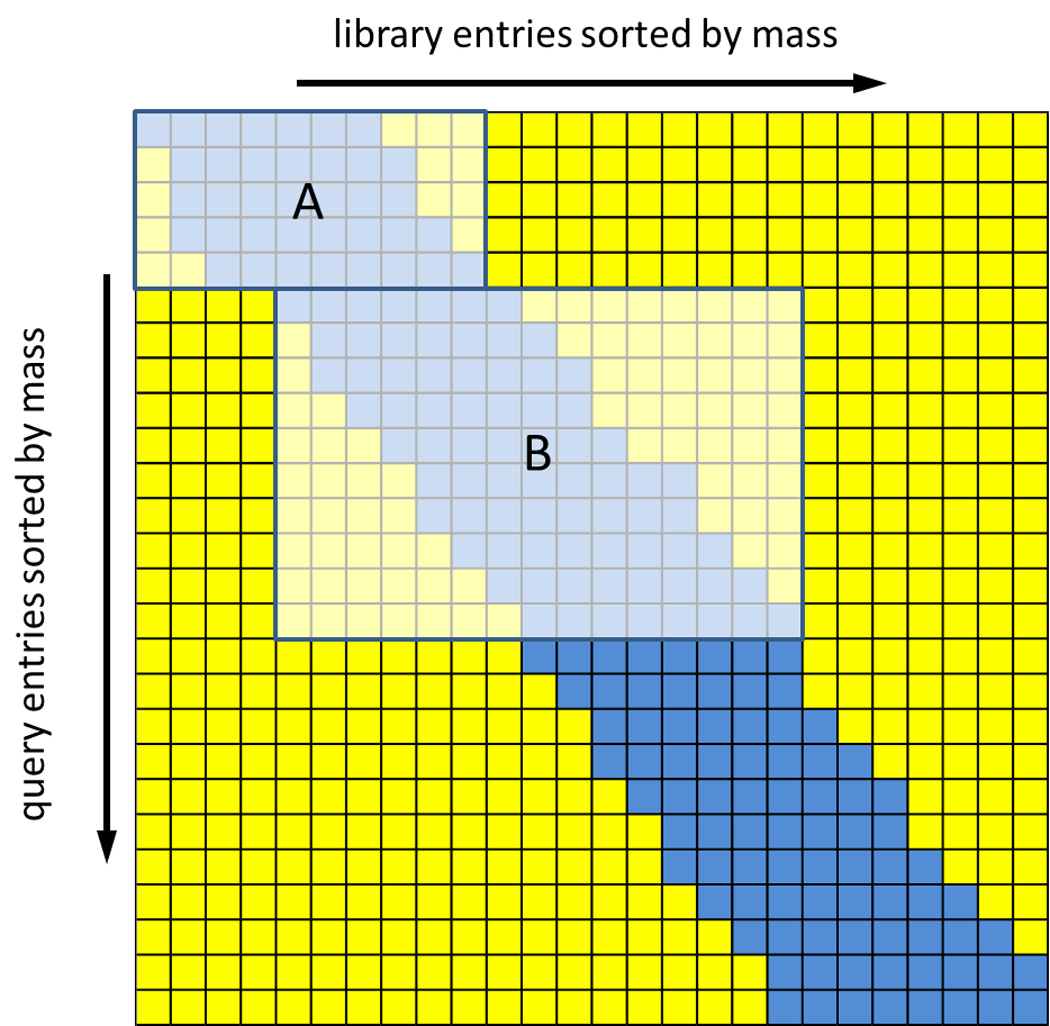
Effects of matrix multiplication batch size on performance.
This matrix is an example of the dot product results matrix where the blue tiles correspond to relevant necessary calculations (where query mass and library mass match within the search tolerance) and the yellow tiles correspond to unnecessary calculations (where the query mass and library mass differ greater than the search tolerance). The two inset boxes A and B correspond to two different batch sizes, both of which are much smaller than the GPU memory. The fraction of unnecessary calculations is much smaller for the smaller batch size A.
It is also worth noting that run times faster than those seen on the Tesla card could be achieved using a more modestly priced NVIDIA GTX 460 GPU, which is a consumer level graphics card now priced less than $200. This card has more processing cores (336 vs. 240) but smaller memory than the Tesla (~1 GB versus 4 GB). Since our current implementation of FastPaSS does require the additional memory available in the Tesla card, the smaller memory would not be detrimental to the demonstrated performance.
A closer evaluation of the results indicates that FastPaSS performance certainly benefits from GPU parallel computing but the results also show that other optimizations made in FastPaSS also have a significant impact on performance. Analysis of the run times, highlighted in Figure 3, indicates that FastPaSS using the Tesla GPU takes roughly 3 seconds to process 10,000 spectra whereas SpectraST takes about 26 seconds to process 10,000 spectra, giving the 8 to 9 fold speed increase attributable just to the GPU versus CPU implementation differences of the core scoring routines. This 8–9 fold improvement is consistent for both cached and un-cached run times. However, there are many other computational steps involved in the entire library search workflow that have been optimized in FastPaSS which contributes to its overall performance gains.
Figure 3.
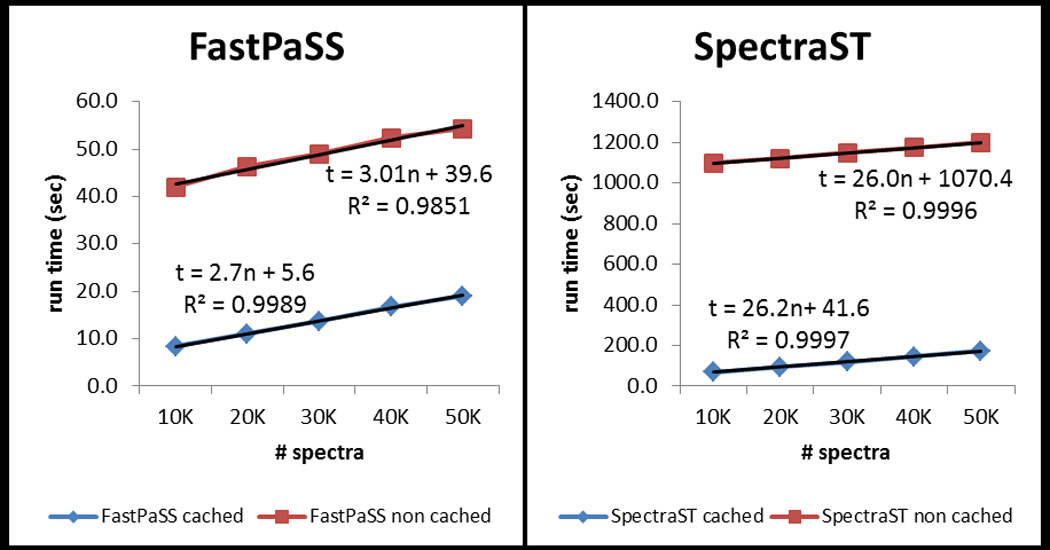
Plot of FastPaSS (Tesla GPU) and SpectraST cached and un-cached run times. In the equations representing the regression lines, “n” is the number of queries and “t” is the runtime in seconds.
The primary ‘overhead’ costs contributing to run times are file I/O and spectral processing of each library entry prior to dot product analysis. For the cached searches, FastPaSS overhead is estimated to be about 6 seconds whereas SpectraST overhead is 41 seconds. For the un-cached searches, FastPaSS and SpectraST overhead are 40 seconds and 1070 seconds, respectively. FastPaSS benefits from incorporating the spectral processing in its library building stage, thereby removing that requirement during search. Its simpler, structured binary format also allows for optimized file parsing and is able to reduce the non-computational overhead tremendously as demonstrated in the un-cached search times. We acknowledge these advantages and the fact that they are optimizations that SpectraST could benefit from as well.
With FastPaSS, we have achieved a substantial speed increase and developed a foundation on which we will base further work to perform sequence database searching using GPU computing. We remain cognizant of the fact that spectral library searching is currently quite fast and could benefit from optimization and multi-threading. We also are aware that the incremental improvement in speed achieved by FastPaSS is not likely to result in a dramatic change in practices for much of the proteomics community. However, the success of this pilot work, along with the speed increase, clearly demonstrates the promise of this method for future applications. As noted above, our primary goal was to focus immediately on the GPU related aspects this projects while avoiding the complexities of generating theoretical spectra. Spectral library searching with its existing library format presented precisely such an opportunity.
We would like to stress that any comparisons of runtimes between GPU and CPU applications is fraught with difficulty because the comparison requires using not only completely different computing hardware architectures but also completely different software implementations of the underlying search tools. There is a continuum of hardware in both the GPU and CPU space that can easily change the relative performance of the tools described here. We compare FastPaSS, SpecraST, and Tandem performance on a reasonable set of hardware but acknowledge that these are just sparse data points in the potential comparison space given the extensive range of faster and slower hardware for both GPU and CPU.
Future development will have to address the critical questions that arise with sequence database searching: the exponential growth in theoretical database size associated with post translational modifications and relaxed enzyme constraints. Solutions will require clever ideas that allow the development of library spectra either in real time or prior to analysis that facilitate matrix multiplication on the GPU. These solutions must address the challenges and limitations of data storage and transfer from the hard drive or the time constraints of real time library spectra generation. We are currently developing solutions to these problems. We are optimistic that they are surmountable by us or other members of the proteomics community and can be implemented using the work described herein as a foundation. The FastPaSS project is hosted on SourceForge at http://sourceforge.net/projects/fastpass. Source code, distributed under the Apache 2.0 license, can be downloaded from this site.
CONCLUSIONS
We have implemented a tandem mass spectral library search algorithm which runs on GPU processors. We demonstrate 8 to 26 fold speed improvement over the reference SpectraST algorithm running on a single CPU. The results presented here show that GPU processing can be a viable alternative to existing CPU based tools for high throughput proteomics data analysis. Peptide identifications can be available in a matter of seconds for large queries against the largest currently available spectral libraries. FastPaSS is freely available, open source, and its current version is immediately useful for library searching. More importantly, the code base serves as an excellent starting point for future computational research towards GPU based sequence database searching.
Supplementary Material
ACKNOWLEDGMENT
This work has been supported in part by the University of Washington's Proteomics Resource (UWPR95794). Funding: NIH grant P50 GM076547/Center for Systems Biology (to D.B.M).
REFERENCES
- 1.Pan S, Aebersold R, Chen R, Rush J, Goodlett DR, McIntosh MW, Zhang J, Brentnall TA. Mass spectrometry based targeted protein quantification: methods and applications. J Proteome Res. 2009;8(2):787–797. doi: 10.1021/pr800538n. [DOI] [PMC free article] [PubMed] [Google Scholar]
- 2.Yates JR, Ruse CI, Nakorchevsky A. Proteomics by mass spectrometry: approaches, advances, and applications. Annu Rev Biomed Eng. 2009;11:49–79. doi: 10.1146/annurev-bioeng-061008-124934. [DOI] [PubMed] [Google Scholar]
- 3.Second TP, Blethrow JD, Schwartz JC, Merrihew GE, MacCoss MJ, Swaney DL, Russell JD, Coon JJ, Zabrouskov V. Dual-pressure linear ion trap mass spectrometer improving the analysis of complex protein mixtures. Anal Chem. 2009;81(18):7757–7765. doi: 10.1021/ac901278y. [DOI] [PMC free article] [PubMed] [Google Scholar]
- 4.Kapp E, Schutz F. Overview of tandem mass spectrometry (MS/MS) database search algorithms. Curr Protoc Protein Sci. 2007;Chapter 25(Unit25):2. doi: 10.1002/0471140864.ps2502s49. [DOI] [PubMed] [Google Scholar]
- 5.Nesvizhskii AI. Protein identification by tandem mass spectrometry and sequence database searching. Methods Mol Biol. 2007;367:87–119. doi: 10.1385/1-59745-275-0:87. [DOI] [PubMed] [Google Scholar]
- 6.Sadygov RG, Cociorva D, Yates JR., 3rd Large-scale database searching using tandem mass spectra: looking up the answer in the back of the book. Nat Methods. 2004;1(3):195–202. doi: 10.1038/nmeth725. [DOI] [PubMed] [Google Scholar]
- 7.Eng JK, McCormack AL, Yates JR., 3rd An approach to correlate tandem mass spectral data of peptides with amino acid sequences in a protein database. Journal of the American Society for Mass Spectrometry. 1994;5:976–989. doi: 10.1016/1044-0305(94)80016-2. [DOI] [PubMed] [Google Scholar]
- 8.Craig R, Beavis RC. TANDEM: matching proteins with tandem mass spectra. Bioinformatics. 2004;20(9):1466–1467. doi: 10.1093/bioinformatics/bth092. [DOI] [PubMed] [Google Scholar]
- 9.Perkins DN, Pappin DJ, Creasy DM, Cottrell JS. Probability-based protein identification by searching sequence databases using mass spectrometry data. Electrophoresis. 1999;20(18):3551–3567. doi: 10.1002/(SICI)1522-2683(19991201)20:18<3551::AID-ELPS3551>3.0.CO;2-2. [DOI] [PubMed] [Google Scholar]
- 10.Geer LY, Markey SP, Kowalak JA, Wagner L, Xu M, Maynard DM, Yang X, Shi W, Bryant SH. Open mass spectrometry search algorithm. J Proteome Res. 2004;3(5):958–964. doi: 10.1021/pr0499491. [DOI] [PubMed] [Google Scholar]
- 11.Desiere F, Deutsch EW, King NL, Nesvizhskii AI, Mallick P, Eng J, Chen S, Eddes J, Loevenich SN, Aebersold R. The PeptideAtlas project. Nucleic Acids Res. 2006;34(Database issue):D655–D658. doi: 10.1093/nar/gkj040. [DOI] [PMC free article] [PubMed] [Google Scholar]
- 12.Falkner JA, Falkner JW, Yocum AK, Andrews PC. A spectral clustering approach to MS/MS identification of post-translational modifications. J Proteome Res. 2008;7(11):4614–4622. doi: 10.1021/pr800226w. [DOI] [PubMed] [Google Scholar]
- 13.Lam H, Deutsch EW, Eddes JS, Eng JK, King N, Stein SE, Aebersold R. Development and validation of a spectral library searching method for peptide identification from MS/MS. Proteomics. 2007;7(5):655–667. doi: 10.1002/pmic.200600625. [DOI] [PubMed] [Google Scholar]
- 14.Liu J, Bell AW, Bergeron JJ, Yanofsky CM, Carrillo B, Beaudrie CE, Kearney RE. Methods for peptide identification by spectral comparison. Proteome Sci. 2007;5:3. doi: 10.1186/1477-5956-5-3. [DOI] [PMC free article] [PubMed] [Google Scholar]
- 15.Wu X, Tseng CW, Edwards N. HMMatch: peptide identification by spectral matching of tandem mass spectra using hidden Markov models. J Comput Biol. 2007;14(8):1025–1043. doi: 10.1089/cmb.2007.0071. [DOI] [PMC free article] [PubMed] [Google Scholar]
- 16.Yates JR, 3rd, Morgan SF, Gatlin CL, Griffin PR, Eng JK. Method to compare collision-induced dissociation spectra of peptides: potential for library searching and subtractive analysis. Anal Chem. 1998;70(17):3557–3565. doi: 10.1021/ac980122y. [DOI] [PubMed] [Google Scholar]
- 17.Liu Y, Maskell DL, Schmidt B. CUDASW++: optimizing Smith-Waterman sequence database searches for CUDA-enabled graphics processing units. BMC Res Notes. 2009;2:73. doi: 10.1186/1756-0500-2-73. [DOI] [PMC free article] [PubMed] [Google Scholar]
- 18.Schatz MC, Trapnell C, Delcher AL, Varshney A. High-throughput sequence alignment using Graphics Processing Units. BMC Bioinformatics. 2007;8:474. doi: 10.1186/1471-2105-8-474. [DOI] [PMC free article] [PubMed] [Google Scholar]
- 19.Taylor ZA, Comas O, Cheng M, Passenger J, Hawkes DJ, Atkinson D, Ourselin S. On modelling of anisotropic viscoelasticity for soft tissue simulation: numerical solution and GPU execution. Med Image Anal. 2009;13(2):234–244. doi: 10.1016/j.media.2008.10.001. [DOI] [PubMed] [Google Scholar]
- 20.Hussong R, Gregorius B, Tholey A, Hildebrandt A. Highly accelerated feature detection in proteomics data sets using modern graphics processing units. Bioinformatics. 2009;25(15):1937–1943. doi: 10.1093/bioinformatics/btp294. [DOI] [PubMed] [Google Scholar]
- 21.Lam H, Deutsch EW, Eddes JS, Eng JK, Stein SE, Aebersold R. Building consensus spectral libraries for peptide identification in proteomics. Nat Methods. 2008;5(10):873–875. doi: 10.1038/nmeth.1254. [DOI] [PMC free article] [PubMed] [Google Scholar]
- 22.Omenn GS. The Human Proteome Organization Plasma Proteome Project pilot phase: reference specimens, technology platform comparisons, and standardized data submissions and analyses. Proteomics. 2004;4(5):1235–1240. doi: 10.1002/pmic.200300686. [DOI] [PubMed] [Google Scholar]
- 23.Falkner JA, Hill JA, Andrews PC. Proteomics FASTA archive and reference resource. Proteomics. 2008;8(9):1756–1757. doi: 10.1002/pmic.200701194. [DOI] [PubMed] [Google Scholar]
- 24.Stein SE, Rudnick PA. NIST Peptide Mass Spectral Libraries. Human Peptide Mass Spectral Reference Data, H. sapiens, ion trap. 2009 Official Build Date: Feb. 4, 2009. [Google Scholar]
- 25. http://http://www.thegpm.org/PPP/
- 26.Kersey PJ, Duarte J, Williams A, Karavidopoulou Y, Birney E, Apweiler R. The International Protein Index: an integrated database for proteomics experiments. Proteomics. 2004;4(7):1985–1988. doi: 10.1002/pmic.200300721. [DOI] [PubMed] [Google Scholar]
Associated Data
This section collects any data citations, data availability statements, or supplementary materials included in this article.