

Abstract
Human immunodeficiency virus type 1 (HIV-1) infects both activated CD4+ T cells and macrophages. We tested if liquid chromatography-tandem mass spectrometry (LC-MS/MS) technology can monitor metabolic alterations induced by HIV-1 in the infected cells. Here we monitored glucose uptake and conducted LC-MS/MS-based metabolomic analysis in HIV-1 infected primary human CD4+ T cells and a macrophage model system: differentiated U1 (HIV-1 producing) and differentiated U937 (control) cells. HIV-1 infected CD4+ T cells have higher glucose uptake and increases in several metabolite pool sizes, whereas HIV-1 producing macrophages had substantial reductions in glucose uptake and steady state glycolytic intermediates. This data suggests that the two HIV-1 target cell types exhibit very different metabolic outcomes during viral production. This study also validates the LC-MS/MS technology as an effective metabolomic approach to monitor various metabolic alterations made by HIV-1 infection.
Keywords: HIV-1, metabolism, CD4+ T cells, macrophages, LC-MS/MS
Background
Cellular metabolic pathways, such as glycolysis, tricarboxylic acid cycle (TCA cycle), lipid metabolism, amino acid and nucleotide synthesis, are targeted during viral infections to support the production of 1,000 to 20,000 new viral progeny per infected cell (Chen et al., 2007; Horsfall, 1954). Recently studies show that human cytomegalovirus (HCMV) alters numerous aspects of host-cell metabolism, some of which were found to be critical for viral replication (Chambers, Maguire, and Alwine, 2010; McArdle, Schafer, and Munger; Munger et al., 2006; Munger et al., 2008). Hepatitis virus type C infection has been shown to induce dysregulation of glucose utilization and lipid biosynthesis (Blackham et al., 2010; Herker et al.; Mankouri et al., 2010). Many viruses, including poliovirus, Dengue, Epstein Barr virus and Human Immunodeficiency Virus type 1 (HIV-1), usurp the autophagy pathways, which are involved in sensing nutrient deprivation and energy stress, for the benefit of viral infection, immune evasion, and viral replication (Heaton and Randall; Shoji-Kawata and Levine, 2009).
HIV-1 causes acquired immune deficiency syndrome, and it uniquely infects both activated CD4+ T cells and terminally differentiated macrophages during the course of HIV-1 pathogenesis. While HIV-1 infection of CD4+ T cells induces G2 arrest and cell death within 2–3 days (Jowett et al., 1995), HIV-1 infection of macrophages leads to long-lived survival and low constitutive viral production, generating viral reservoirs (Cosenza, Zhao, and Lee, 2004; Kilareski et al., 2009), which contribute to HIV-1 associated neurodegenerative diseases in the CNS (Cysique and Brew, 2009).
Collectively, it is becoming increasingly apparent that upon viral infection changes occur in the metabolic profile of the cell, which are critically important for viral replication. With this in mind, we sought to determine how HIV-1 impacts the cellular metabolic environments in activated CD4+ T cells and macrophages. Recent advances in metabolomic methodologies, such as LC-MS/MS technology, enable the simultaneous measurement of numerous cellular metabolic intermediates allowing for the elucidation of highly complex metabolic outcomes induced by viral infections at steady state level (Munger et al., 2006; Munger et al., 2008). Our previous HCMV findings indicate increased glucose uptake in HCMV-infected fibroblasts as compared to mock-infected cells. These data were further supported by increased steady state glycolytic and TCA-cycle metabolite pool sizes within the cells coupled with faster metabolite flux through glycolysis and TCA intermediates upon HCMV infection (Munger et al., 2008).
Due to the long-lived nature of HIV-producing macrophages, we hypothesized that the cellular metabolic landscape of HIV-infected macrophages could be different from that of HIV-infected CD4+ T cells, which were previously reported to robustly upregulate some cellular metabolic events (Chan et al., 2009). In addition, no metabolomic analysis on long-living, persistently infected cells has yet been reported. Therefore, in this study, we tested our hypothesis by monitoring the metabolic alterations that occur during viral production from primary CD4+ T cells and an HIV-1 infected human macrophage model system. Indeed, we find that the two HIV-1 target cell types have very different metabolic profiles. HIV-1 infected CD4+ T cells have significantly increased uptake of tritiated glucose, whereas infected macrophages have significantly reduced uptake of tritiated glucose. Using LC-MS/MS-based metabolomic analysis, we find that several steady state glycolytic intermediates are significantly upregulated in CD4+ T cells, whereas macrophages have significantly reduced level of several metabolites. Moreover, we find significant changes in several metabolites in the PPP, TCA cycle, and UDP-sugars for both cell types. We also examined NTP pools and found significant changes only for macrophages. Lastly, we examined ATP/ADP, NAD+/NADH and NADP+/NADPH ratios and found only macrophages have a significant change in the NADP+/NADPH ratio. Our LC-MS/MS data help provide a clearer understanding of cell type specific metabolic changes associated with HIV-1 viral replication.
Materials and Methods
Cells
The U937 cell line was purchased from the American Type Culture Collection, whereas the U1 cell line was acquired through the NIH AIDS Research and Reference Program. Both cell lines were grown in RPMI 1640 media supplemented with 10% FBS and penicillin and streptomycin antibiotics (complete media). Cells were split 1:5 dilution and treated with 10 nM Vitamin D3 (Sigma) at day -2. At day -1, media was doubled and supplemented with Vitamin D3. At day 0, cells were transferred to 50 ml tubes and treated with 100 nM PMA for 2h. Cells were washed three times with PBS, resuspended in 10 ml of complete media and counted. Two million cells per well were plated in 6-well plate with final volume of 4 ml/well of RPMI 1640 media with 10% FBS. After two days of differentiation, U937 and U1 cells were used for experiments.
Primary human CD4+ T cells were positively selected for using MACS isolation from buffy coats (New York Blood Services, Long Island, NY). Cells were at 10 million cells/ml stored at −80° C before use. For CD4+ T cells activation, 60–120 million cells were thawed and placed in media. Cells were centrifuged at 1200 RPM for 7 min. The pellet was resuspended in 15 ml of DMEM media containing 5% FBS/30 million cells. The cell suspension was placed in a T75 flask and 5 ug/ml of PHA (Sigma) and 10 ng/ml IL-2 (Roche; NIH AIDS Research and Reference Reagents) were added. At day 2, 7.5 ml DMEM media and 10 ng/ml IL-2 was added. At day 3, cells were centrifuged at 1200 RPM for 7 min. Two T75 flasks were combined and pellets resuspended in 40 ml of DMEM media with 10 ng/ml IL-2. Cells were allowed to expand for two more days. At day 5, cells were harvested at 1200 RPM for 7 min. Cells were resuspended in 10 ml of media and counted.
HIV-1 virus generation
pNLEGN-1 was a kind gift from Dr. Levy (Kutsch et al., 2002). Plasmid was transfected into Stable 2 E.coli strain and then Qaigen Maxi preparation was done. 292FT cells (Invitrogen) grown in T225 flasks were transfected with 60 μg pNLEGN-1 and 10 μg pVSV-g plasmids using 140 μl polyethyenimine (1 mg/ml) in 37 ml DMEM media/flask. Day 1 HIV-1 production was discarded and fresh DMEM media + 0.1% DMSO was added. At day 2, media was harvested and replaced with fresh DMEM media + 0.1% DMSO. The media was centrifuged at 3500 RPM for 7 min to remove cellular debris. Media was stored at 4° C in T75 flask. Day 2 media was harvested and processed as day 1. Both days of collection were pooled and FBS was added to 5% volume. In addition, 10 ng/ml IL-2 was added to the T75 flask. This large cocktail was then used to infect the primary activated CD4+ T cells.
CD4+ T cell infection
Ten million activated CD4+ T cells were placed in 15 ml of HIV-1 media (TPP petri dishes). Dishes were placed on an orbital shaker for 24h in the incubator. We found that this led to the fastest increase in GFP+ cells. Cells were then harvested from the dishes and centrifuged. Pellets were resuspended in 2 ml of DMEM media and filtered into FACS tubes. Additional media was added to adjust cells/ml to under 50 million before sorting.
FACS Sorting
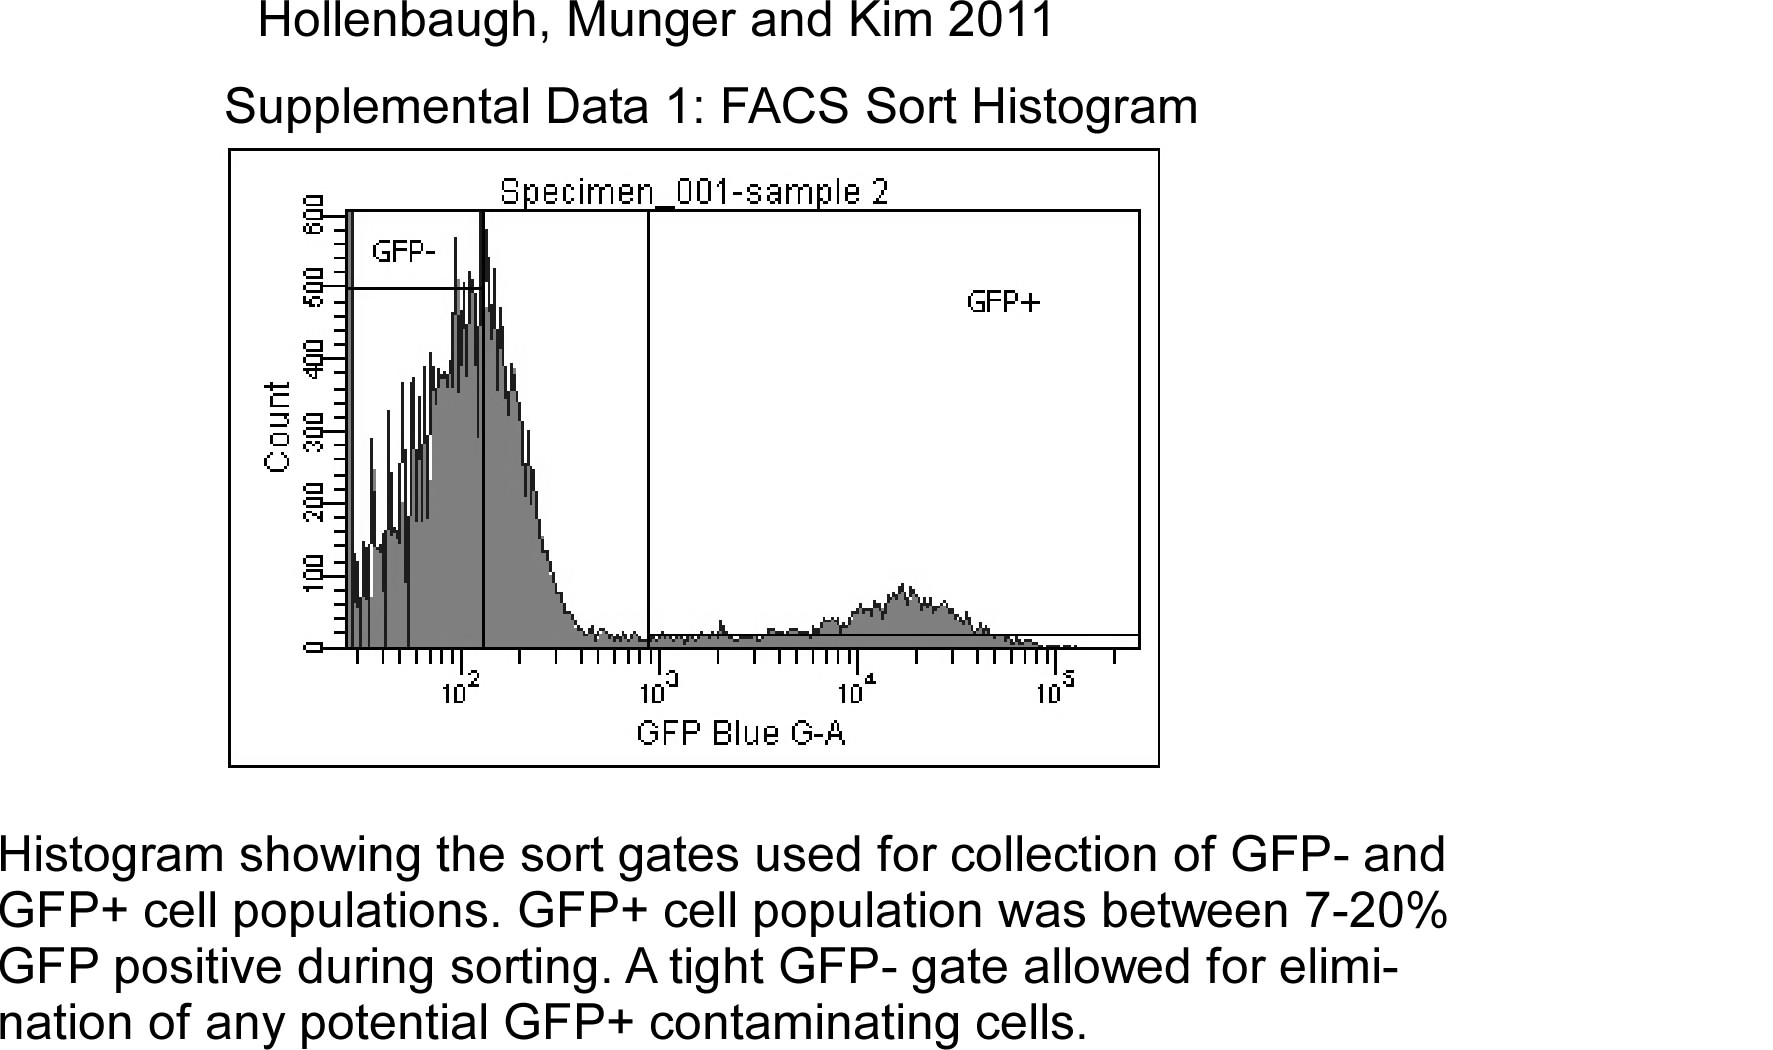
The University of Rochester has a FACS Core Facility. Cells were FACS Sorted using BD FACS Aria IIu machine, which is in a BioProtect III hood (The Baker Co.) using BSL-2+ conditions. Single T cells were discriminated using FSC and SSC parameters before sorting GFP+ (HIV-1+) and GFP− (HIV-1 negative) populations. The gating profile from the FACS sorter is shown in Supplemental Data 1 and shown a very tight gate GFP− cells and a liberal collection gate for GFP+ cells. We had between 7–20% GFP+ populations for the seven different donors. This determined as to which type of experiment was done after sorting. We needed 3 million cells/tube for LC-MS/MS, whereas the glucose uptake assay had 1.5–2 million cells/tube. CD4+ T cells were analyzed in duplicate for LC-MS/MS analysis, whereas triplicate samples for each of the GFP + and GFP− populations were analyzed for the glucose uptake assay.
Liquid chromatography-tandem mass spectrometry (LC-MS/MS)
For U1 and U937 cells steady state analysis, media was removed from day 2 differentiated cells and replaced with serum-free DMEM media lacking sodium pyruvate. After 1h at 37° C, the media was aspirated and dry ice cold 80% methanol was added. Samples were stored at −80° C for 5 min followed by processing with a rubber policeman to remove attached cells. Supernatant was transferred to a 15 ml conical tube and vortexed for 1 min. Samples were centrifuged at 3500 RPM for 5 min. The supernatant was transferred to a new tube. Pellets were washed with 1 ml of dry ice cold 80% methanol. Samples were centrifuged and supernatants consolidated for each sample. Samples were dried under nitrogen gas. Once dried, samples were stored at −80° C until analysis.
For FACS Sorted CD4+ T cells, 3 × 10⁶ cells were placed in cryovials with DMEM containing 10% dialyzed FBS serum. Cells were allowed to recover for 6h in the tissue culture incubator. After recovery time, each sample was centrifuged at 4K RPM for 10 sec. Supernatant was removed using vacuum and 1 ml of dry ice cold 80% methanol was added. Tubes were vortexed for 1 min, and then centrifuged at 15K RPM for 1 min. Supernatant was removed and placed in a 15 ml tube. Cell pellet was washed with 0.5 ml dry ice cold 80% methanol. Tubes were centrifuged again and supernatants pooled. Supernatants were dried using nitrogen gas. Once dried, samples were stored at −80° C until analysis.
Samples were removed from the −80° C and allowed to equilibrate to room temperature. The cell pellet was resuspended in 100 μl 50% methanol and liquid transferred to 1.5 ml centrifuge tube. Cellular debris was removed by 15K RPM centrifugation for 10 min and 75 μl of supernatant was transferred to a LC-MS/MS vial and capped. Ten microliters of sample were autoloaded into LC-20 AD HPLC system (Shimadzu) for metabolite separation. The LC was coupled to a mass spectrometer running in negative mode with an ESI source using reversed phase chromatography with an amine-based ion pairing agent. A Synergi Hydro-RP column (150 by 2 mm with a 5-μm particle size; Phenomenex) was used with the following LC parameters: autosampler temperature, 4°C; column temperature, 40°C; flow rate, 200 μl/min. The LC solvents were as follows: solvent A, 100% methanol; solvent B, 10 mM tributylamine and 15 mM acetic acid in 97:3 water-methanol. The HPLC gradients were as follows: for t=0, 100% B; for t=5, 100% B; for t=10, 80% B; for t=20, 80% B; for t =35, 35% B; for t =38, 5% B; for t =42, 5% B; for t=43, 100% B; and for t=50, 100% B. Mass spectrometric analyses were performed with a TSQ Quantum Ultra triple-quadrupole mass spectrometer (Thermo Fisher Scientific) with mass spectrometry parameters as per (Bajad et al., 2006).
Data analysis and graphing
MS data were acquired using Xcalibur software (Thermo Fisher Scientific). Each metabolite measurement was in the form of a selected reaction monitoring scan event (SRM) occurring at a specific HPLC retention time. Each SRM consists of: a metabolite specific parent ion m/z, a collision cell energy, and a metabolite-specific product ion resulting from collision with argon gas in the collision cell. Metabolite retention times and SRMS were previously empirically determined using pure chemical standards and have formerly been reported (Bajad et al., 2006). The resulting data were exported into mzRock free shareware (http://code.google.com/p/mzrock/), which allows automated analysis of targeted metabolomics data. To quantify metabolite levels, peak heights for different metabolite SRMs were determined for each sample. A metabolite was not analyzed further if: (i) its signal for all viral and mock samples was undetectable; (ii) its maximum signal for all viral or mock samples was less than 2-fold that of the maximum signal in the methanol control sample; or (iii) the observed signal likely resulted from a naturally occurring heavy isotope of another metabolite. Data from each donor set was compared pair wise as they were run and paired T-test used to evaluate significant differences. Data was plotted with standard error of mean (SEM) using Prism software (GraphPad Software).
2-DOG uptake assay
For U1 or U937 cells, 1 × 10⁶ cells/well were differentiated in 12-well plates. At day 2 of differentiation, media was removed and cells cultured for 2h under serum free conditions. After incubation, media was replaced with 0.5 ml DMEM media (glucose free) containing 1.0 μCi 2-DOG/ml. Cells were cultured for 10 min at 37°C. Preliminary assays were done with macrophage and 293FT cells and found that 2-DOG uptake was still in the linear range even after 30 minutes of incubation (data not shown). Afterwards, the plates were placed on ice, media removed, cells washed thrice with ice cold PBS. Cells were lysed using ELB buffer with 0.1% SDS for 20 minutes at 37° C. Scintillation counts were collected using 0.4 ml. Data was normalized to total protein (BioRad protein assay). Samples were done in triplicate.
For CD4+ T cells, 1.5–2 × 10⁶ cells were placed in cryovials with complete DMEM media after FACS sorting. The cells were allowed to recover for 6h. The vials were then closed and centrifuged at 4K RPM for 10 sec. The media was removed by aspiration, and 0.5 ml DMEM media (glucose free) containing 1.0 μCi 2-DOG/ml was added. The cells were incubated at 37° C for 10 min, before being centrifuged at 4K RPM for 15 sec. Media was carefully removed and cell pellet washed once with ice cold PBS. After centrifugation, the pellet was lysed using ELB buffer with 0.1% SDS for 20 min at 37° C. Scintillation counts were collected using 0.4 ml. Data was normalized to total protein. Samples were done in triplicate for three independent donors.
Results and Discussion
In this study, our goal is to test if the LC-MS/MS technology can monitor HIV-1 induced cellular metabolic alterations in CD4+ T cells and macrophages. To test this we compared HIV-1 infected versus non-infected primary human CD4+ T cells from the same donor (Figure 1a). CD4+ T cells were infected with NLEGN-1 HIV-1 virus, which is the infectious HIV-1 NL4-3 stain that has all viral genes expressed in addition to GFP (Kutsch et al., 2002). CD4+ T cells were FACS-sorted into GFP+ (HIV-1 producing) and GFP− cells from the same donor, achieving 7–20% infection at the time of sorting. All CD4+ T cell experiments compared infected versus uninfected T cells at the same time for individual donors.
Figure 1.

Diagram of methods. A) Primary CD4+ T cells were expanded in culture in the presence of 5 μg/ml PHA and 10 ng/ml IL-2. After five days the cells were infected with NLEGN-1 HIV-1 virus for 24h before FACS sorting the cells into GFP+ (HIV-1 producing cells) and GFP− (control) populations. The cells were allowed to recover for 6h in DMEM media containing 10% FBS before using used for LC-MS/MS or glucose uptake assays. B) U1 and U937 cells were maturated in the presence of 10 nM Vitamin D3 for two day prior to 100 nM PHA treatment for 1h. Cells were then washed three times with media, counted and plated at 2 million cells/well. At day 2 of differentiation, macrophages were used for experiments.
Due to the nature of macrophages being difficult to infect completely with HIV-1 and their tendency not to re-adhere once detached, we utilized a cell line model to mimic human HIV-1 infected macrophages (Figure 1b). The human promonocytic U937 cells are the most commonly used HIV-1 monocyte/macrophage model system (Cassol et al., 2006). U1 cells are chronically HIV-1 infected U937 cells (Folks et al., 1987) and are widely used as a model system to study HIV-1 biology in macrophages (Bristow et al., 2008; Cassol et al., 2006; Fernandez Larrosa et al., 2008; Olivares et al., 2009; Spector and Zhou, 2008). U937 and U1 cells were differentiated into macrophages using Vitamin D3 and PMA treatment (Figure 1b). U1 cells produced virus within 2 days as measured by intracellular expression and secreted p24 (Supplemental Data 2a and b). In addition, U1 cells remained alive and have comparable cell death to U937 cells (Supplemental Data 2c and d), indicating that HIV-1 production does not induce apoptosis for U1 cells, which is similar to what we observe with primary human macrophages.
A basic overview of metabolic pathways is illustrated in Figure 2a showing the many different pathways that glucose can travel once entering the cell (Wamelink, Struys, and Jakobs, 2008). First, we used tritiated 2-deoxyglucose (2-DOG) to monitor the cellular capacity for glucose uptake (Reusch et al., 1991). As shown in Figure 2b and Supplemental Data 3a, HIV-1 infected CD4+ T cells (GFP+) from three different human donors have a significant increase in 2-DOG uptake as compared to GFP− CD4+ T cells (control) from the same donor under the same culture conditions. In contrast, when we examined glucose uptake of the U937 and U1 macrophage model system, and observed that U1 macrophages have a significant reduction in 2-DOG uptake as compared to U937 macrophages (Figure 1b and Supplemental Data 3b). Since U1 and U937 cells have been passaged for many years, there may be additional, subtle changes that have occurred to both cell lines. However, both U1 and U937 cells have comparable 2-DOG uptake before differentiation (Supplemental Data 3c), suggesting no predisposed gross changes in glucose uptake in latently infected U1 cells is observed. Overall, the absence of glucose uptake enhancement in U1 macrophages (HIV-1 producing) versus U937 macrophages implies that HIV-1 production does not induce additional glucose uptake during virus production. This finding is in contrast to our HIV-1 infected CD4+ T cell data (Figure 2b) and the observations of another lytic viral infection (Munger et al., 2006; Munger et al., 2008).
Figure 2.

Diagram of metabolic pathways. FBP is the major regulatory metabolite for glycolysis. It influences its own production and pyruvate, to stimulation more glucose consumption. Pyruvate can be converted into lactate or further be processed to enter the TCA cycle. Alternative pathways of glucose use are the PPP, glycogen synthesis and glycosylation of proteins. The oxidative PPP is unidirectional and generates NADPH, whereas the non-oxidative PPP is reversible, allowing excess ribose to be converted into glycolytic intermediates or ribose generation from intermediates. B) Glucose uptake assay was performed as described in methods. Glucose uptake is shown for CD4+ T cells as the ratio of GFP+/GFP− (HIV-1+ positive/HIV-1 negative cells) and the ratio of U1/U937 macrophages (HIV-1 producing/control cells). Three independent experiments were done in triplicate for each cell type. Data displayed as Log2 converted and SEM.
Next we used LC-MS/MS to examine steady state levels of metabolic intermediates during viral infection. For HIV-1 infected CD4+ T cells and macrophage model system, a total of 66 metabolic small molecules were identified during steady state analysis (Supplemental Table 1: complete list). Our data for HIV-1 infected CD4+ T cells (analyzed as ratio of GFP+/GFP) indicate that several glycolytic key metabolites: hexose-P, fructose 1,6-bisphosphate (FBP), glyceraldehyde-3P (G3P) and 3-phosphoglycerate (3PG) have significantly increased pool sizes by T-test analysis (Figure 3a; shown as Log2 converted data). This data together with the increased glucose uptake (Figure 2b), suggest an increased rate of glycolysis for HIV-infected CD4+ T cells. These observations parallel previous findings in which increases in glycolytic metabolite concentrations correlated with increased glycolytic flux (Munger et al., 2006; Munger et al., 2008).
Figure 3.

LC-MS/MS analysis of glycolysis and TCA cycle metabolic pools. A) LC-MS/MS analysis of glycolytic intermediates for CD4+ T cells (red) and macrophages (blue) are shown as fold change in data. Metabolites that have a significant difference are denoted with asterisks. B) TCA cycle intermediate pool sizes are compared as described above. For CD4+ T cells, the ratio of GFP+/GFP− metabolite intensities were compared, whereas the ratio of U1/U937 metabolite intensities are shown for macrophages. Significant differences were determined using paired T-test. For CD4+ T cells, four independent donors were done in duplicate (n=8). Seven LC-MS/MS runs were compared for U1 and U937 cells. Data displayed as Log2 converted and SEM.
Next, we examined metabolic pools in macrophage model system (analyzed as the ratio of U1/U937) and found significant reductions in glycolytic intermediates: hexose-P, FBP and G3P (Figure 3a). Coupled with the decrease in glucose uptake (Figure 2b), these results suggest an HIV-induced suppression of glycolysis in macrophages. One surprising aspect of these data is the increase in pyruvate pool size despite the reduction of glucose uptake and decreased FBP levels. This could reflect either decreased pyruvate consumption by the TCA cycle in macrophages or perhaps increased pyruvate production from other carbon sources such as amino acid oxidation. Regardless, these data indicate that HIV-1 infection in CD4+ T cells and macrophages has very different metabolic outcomes.
Next, we examined metabolite pool sizes for the TCA cycle. As shown in Figure 3b, aconitate and isocitrate are significantly increased for HIV-1 infected CD4+ T cells, while HIV-1 producing macrophages have a significantly larger malate pool. Collectively, the lack of detectable changes in multiple metabolite pool sizes suggests that the viral impact on the TCA cycle is not analogous to its impact on glycolysis. Ringrose et al. reported that several TCA cycle proteins are upregulated during late HIV-1 infection (Ringrose et al., 2008). While we do detect substantial changes to a few TCA metabolite pool sizes, we cannot clearly delineate this impact on the TCA cycle. Moreover, our data does not address HIV-modulation of TCA cycle flux or changes in metabolite pool sizes that feed into and out of the TCA cycle for other biosynthesis pathways. These data are in contrast to earlier findings for HCMV infection which showed increases in TCA cycle intermediates (Munger et al., 2006; Munger et al., 2008), suggesting that evolutionarily divergent viruses interact differently with the host-cell metabolic network. Alternatively, activation of glycolysis is sufficient to support HIV-1 production in CD4+ T cells, while HCMV, having a larger DNA genome (230 kb) as compared to the small RNA genome (9.5 knt) of HIV-1, may require greater metabolic resources thus promoting the activation of both glycolysis and the TCA cycle.
Next we examined metabolite pool sizes. For the PPP, HIV-1 infected CD4+ T cells have a significant increase in sedoheptulose 7-P (S7P; non-oxidative PPP) and ribose-P, whereas macrophages have a significant decrease in 6-P-gluconate (6PG; oxidative PPP) and no significant change in S7P and ribose-P (Figure 4a). These data suggest that infected CD4+ T cells may use the non-oxidative PPP to generate ribose at this late time point after infection. In addition, the PPP metabolite 6PG level is not significantly different (Log2 = −0.09). These data are consistent with Chan et al.; they showed no difference at the enzyme level for this metabolite at a late time point of infection (Chan et al., 2009). HIV-1 has an RNA genome; therefore we also examined nucleotide triphosphates (NTP) pool sizes in CD4+ T cells and macrophages. We recently reported macrophages have slightly lower NTP pools than activated PBMC, and the concentrations of pyrimidines are lower than purines (Kennedy et al., 2010). As shown in Figure 4b, no significant differences in NTP pool sizes were detected for CD4+ T cells. Yet for the macrophage model system, the pyrimidines: CTP and UTP pool sizes were significantly increased. We detected a decrease in GTP, yet this did not reach the level of significant difference using paired T-test.
Figure 4.

LC-MS/MS analysis of metabolites used in viral production. A) PPP pathway was examined for CD4+ T cells (red) and macrophages (blue). Significantly different metabolites are indicated by asterisks. B) NTP pools were examined and found to change more for macrophages than T cells. C) The APT/ADP, NAD+/NADPH and NADP+/NADPH ratios were examined for the different cell types. D) Sugar derivative pool sizes were examined using LC-MS/MS analysis. Data sets are stated and plotted as indicated in Figure 3 legend.
We next examined the ATP/ADP, NAD+/NADH and NADP+/NADPH ratios (Figure 4c and Supplemental Data 4). For both cell populations, the ATP/ADP and NAD+/NADH ratios were not significantly different. These data supported our conclusion of very little change in the TCA cycle by HIV-1 infection. It has been well established for HIV-1 and other viruses that the redox levels: glutathione and NADPH, change within the infected cells (Gu et al., 2001; Jana and Pahan, 2004; Korenaga et al., 2005; Sagi and Fluhr, 2001). The NADP+/NADPH ratio for macrophages was significantly different, but not for CD4+ T cells (Figure 4c). This data and the 6PG PPP metabolite data suggest an overall reduction in the ability to generate NADPH. Furthermore, these data suggest that HIV-1 producing U1 macrophages may be compromised in their ability to generate de novo nucleotides and fatty acids. This can be addressed in future studies using more tradition biochemical assays.
Finally, we examined the UDP-sugar pools within the different cell types. UDP-sugars are metabolic intermediates used in glycosylation of proteins. HIV-1 gp120 and gp41proteins are highly glycosylated, are key targets for antibody binding to prevent infection, and are critical for HIV-1 pathogenesis (Montefiori, Robinson, and Mitchell, 1988; Pal, Hoke, and Sarngadharan, 1989; Raska et al., 2010). We detect a significant increase in UDP-glucose pool size for CD4+ T cells (Figure 4d). UDP-D-glucurononate pool size was not significantly changed in either CD4+ T cells or macrophages. UDP-N-acetyl-glucosamine pool size was significantly increased in both CD4+ T cells and macrophages, whereas N-acetyl-glucosamine-1P was significantly increased in macrophages only (Figure 4d). These data indicate that UDP-sugar pathways may be potential targets for metabolic chemical inhibitors, since they are increased in both cell types. Future experiments will need to be done in order to confirm that reducing UDP-sugar synthesis has an affect on HIV-1 viral replication.
Clearly our data indicates that LC-MS/MS technology is attractive when measurement of multiple metabolic intermediates is desired. Our strongest data using LC-MS/MS comes from analysis of glycolytic intermediates (Figure 3a), which will require additional future studies to examine both RNA and protein levels under these conditions. The limitations of these results are 1) the relative low detection sensitivity presumably due to the limited biomass sizes, compared to the previous HCMV data, particularly in PPP and TCA pathways (Munger et al., 2006; Munger et al., 2008), 2) the potential delay of sample preparation for suspension cells, which requires centrifugation before lysis, which may be problematic for metabolic kinetic readouts (i.e. flux analysis), as compared to adherent cells which can be directly methanol lysed on the plates, and finally, 3) the difficult nature of primary human macrophage infection from donor to donor. These technical limitations partially attribute cell types used during this study, and require further work.
Conclusion
Our data suggests that the two HIV-1 target cell types exhibit very different metabolic outcomes during viral production, and this study also validates the LC-MS/MS technology as an effective metabolomic approach to monitor various metabolic alterations made by HIV-1 infection.
Supplementary Material
Acknowledgments
This study was supported by NIH grants: R01AI081773 (JM), T32 DA07232 (JAH), and A1077401 (BK). We would like to thank the Rochester FACS Core for the sorting and AIDS Research and Reference Reagent Program for reagents. We would like to thank Edward Kennedy and Erin Noble for reading and comments on this manuscript.
Footnotes
Competing interests
The authors declare that they have no competing interests.
Authors’ contributions
JAH performed experiments. JAH, JM and BK reviewed the data and wrote the manuscript.
Publisher's Disclaimer: This is a PDF file of an unedited manuscript that has been accepted for publication. As a service to our customers we are providing this early version of the manuscript. The manuscript will undergo copyediting, typesetting, and review of the resulting proof before it is published in its final citable form. Please note that during the production process errors may be discovered which could affect the content, and all legal disclaimers that apply to the journal pertain.
References
- Bajad SU, Lu W, Kimball EH, Yuan J, Peterson C, Rabinowitz JD. Separation and quantitation of water soluble cellular metabolites by hydrophilic interaction chromatography-tandem mass spectrometry. J Chromatogr A. 2006;1125(1):76–88. doi: 10.1016/j.chroma.2006.05.019. [DOI] [PubMed] [Google Scholar]
- Blackham S, Baillie A, Al-Hababi F, Remlinger K, You S, Hamatake R, McGarvey MJ. Gene expression profiling indicates the roles of host oxidative stress, apoptosis, lipid metabolism, and intracellular transport genes in the replication of hepatitis C virus. J Virol. 2010;84(10):5404–14. doi: 10.1128/JVI.02529-09. [DOI] [PMC free article] [PubMed] [Google Scholar]
- Bristow CL, Wolkowicz R, Trucy M, Franklin A, Di Meo F, Kozlowski MT, Winston R, Arnold RR. NF-kappaB signaling, elastase localization, and phagocytosis differ in HIV-1 permissive and nonpermissive U937 clones. J Immunol. 2008;180(1):492–9. doi: 10.4049/jimmunol.180.1.492. [DOI] [PubMed] [Google Scholar]
- Cassol E, Alfano M, Biswas P, Poli G. Monocyte-derived macrophages and myeloid cell lines as targets of HIV-1 replication and persistence. J Leukoc Biol. 2006;80(5):1018–30. doi: 10.1189/jlb.0306150. [DOI] [PubMed] [Google Scholar]
- Chambers JW, Maguire TG, Alwine JC. Glutamine metabolism is essential for human cytomegalovirus infection. J Virol. 2010;84(4):1867–73. doi: 10.1128/JVI.02123-09. [DOI] [PMC free article] [PubMed] [Google Scholar]
- Chan EY, Sutton JN, Jacobs JM, Bondarenko A, Smith RD, Katze MG. Dynamic host energetics and cytoskeletal proteomes in human immunodeficiency virus type 1-infected human primary CD4 cells: analysis by multiplexed label-free mass spectrometry. J Virol. 2009;83(18):9283–95. doi: 10.1128/JVI.00814-09. [DOI] [PMC free article] [PubMed] [Google Scholar]
- Chen HY, Di Mascio M, Perelson AS, Ho DD, Zhang L. Determination of virus burst size in vivo using a single-cycle SIV in rhesus macaques. Proc Natl Acad Sci U S A. 2007;104(48):19079–84. doi: 10.1073/pnas.0707449104. [DOI] [PMC free article] [PubMed] [Google Scholar]
- Cosenza MA, Zhao ML, Lee SC. HIV-1 expression protects macrophages and microglia from apoptotic death. Neuropathol Appl Neurobiol. 2004;30(5):478–90. doi: 10.1111/j.1365-2990.2004.00563.x. [DOI] [PubMed] [Google Scholar]
- Cysique LA, Brew BJ. Neuropsychological functioning and antiretroviral treatment in HIV/AIDS: a review. Neuropsychol Rev. 2009;19(2):169–85. doi: 10.1007/s11065-009-9092-3. [DOI] [PubMed] [Google Scholar]
- Fernandez Larrosa PN, Croci DO, Riva DA, Bibini M, Luzzi R, Saracco M, Mersich SE, Rabinovich GA, Martinez Peralta L. Apoptosis resistance in HIV-1 persistently-infected cells is independent of active viral replication and involves modulation of the apoptotic mitochondrial pathway. Retrovirology. 2008;5:19. doi: 10.1186/1742-4690-5-19. [DOI] [PMC free article] [PubMed] [Google Scholar]
- Folks TM, Justement J, Kinter A, Dinarello CA, Fauci AS. Cytokine-induced expression of HIV-1 in a chronically infected promonocyte cell line. Science. 1987;238(4828):800–2. doi: 10.1126/science.3313729. [DOI] [PubMed] [Google Scholar]
- Gu Y, Wu RF, Xu YC, Flores SC, Terada LS. HIV Tat activates c-Jun amino-terminal kinase through an oxidant-dependent mechanism. Virology. 2001;286(1):62–71. doi: 10.1006/viro.2001.0998. [DOI] [PubMed] [Google Scholar]
- Heaton NS, Randall G. Dengue virus-induced autophagy regulates lipid metabolism. Cell Host Microbe. 2010;8(5):422–32. doi: 10.1016/j.chom.2010.10.006. [DOI] [PMC free article] [PubMed] [Google Scholar]
- Herker E, Harris C, Hernandez C, Carpentier A, Kaehlcke K, Rosenberg AR, Farese RV, Jr, Ott M. Efficient hepatitis C virus particle formation requires diacylglycerol acyltransferase-1. Nat Med. 2010;16(11):1295–8. doi: 10.1038/nm.2238. [DOI] [PMC free article] [PubMed] [Google Scholar]
- Horsfall FL., Jr On the reproduction of influenza virus; quantitative studies with procedures which enumerate infective and hemagglutinating virus particles. J Exp Med. 1954;100(2):135–61. doi: 10.1084/jem.100.2.135. [DOI] [PMC free article] [PubMed] [Google Scholar]
- Jana A, Pahan K. Human immunodeficiency virus type 1 gp120 induces apoptosis in human primary neurons through redox-regulated activation of neutral sphingomyelinase. J Neurosci. 2004;24(43):9531–40. doi: 10.1523/JNEUROSCI.3085-04.2004. [DOI] [PMC free article] [PubMed] [Google Scholar]
- Jowett JB, Planelles V, Poon B, Shah NP, Chen ML, Chen IS. The human immunodeficiency virus type 1 vpr gene arrests infected T cells in the G2 + M phase of the cell cycle. J Virol. 1995;69(10):6304–13. doi: 10.1128/jvi.69.10.6304-6313.1995. [DOI] [PMC free article] [PubMed] [Google Scholar]
- Kennedy EM, Gavegnano C, Nguyen L, Slater R, Lucas A, Fromentin E, Schinazi RF, Kim B. rNTPs as substrate of human immunodeficiency virus type 1 reverse transcriptase in human macrophages. J Biol Chem. 2010;285(50):39380–91. doi: 10.1074/jbc.M110.178582. [DOI] [PMC free article] [PubMed] [Google Scholar]
- Kilareski EM, Shah S, Nonnemacher MR, Wigdahl B. Regulation of HIV-1 transcription in cells of the monocyte-macrophage lineage. Retrovirology. 2009;6:118. doi: 10.1186/1742-4690-6-118. [DOI] [PMC free article] [PubMed] [Google Scholar]
- Korenaga M, Wang T, Li Y, Showalter LA, Chan T, Sun J, Weinman SA. Hepatitis C virus core protein inhibits mitochondrial electron transport and increases reactive oxygen species (ROS) production. J Biol Chem. 2005;280(45):37481–8. doi: 10.1074/jbc.M506412200. [DOI] [PubMed] [Google Scholar]
- Kutsch O, Benveniste EN, Shaw GM, Levy DN. Direct and quantitative single-cell analysis of human immunodeficiency virus type 1 reactivation from latency. J Virol. 2002;76(17):8776–86. doi: 10.1128/JVI.76.17.8776-8786.2002. [DOI] [PMC free article] [PubMed] [Google Scholar]
- Lu W, Kimball E, Rabinowitz JD. A high-performance liquid chromatography-tandem mass spectrometry method for quantitation of nitrogen-containing intracellular metabolites. J Am Soc Mass Spectrom. 2006;17(1):37–50. doi: 10.1016/j.jasms.2005.09.001. [DOI] [PubMed] [Google Scholar]
- Luo B, Groenke K, Takors R, Wandrey C, Oldiges M. Simultaneous determination of multiple intracellular metabolites in glycolysis, pentose phosphate pathway and tricarboxylic acid cycle by liquid chromatography-mass spectrometry. J Chromatogr A. 2007;1147(2):153–64. doi: 10.1016/j.chroma.2007.02.034. [DOI] [PubMed] [Google Scholar]
- Mankouri J, Tedbury PR, Gretton S, Hughes ME, Griffin SD, Dallas ML, Green KA, Hardie DG, Peers C, Harris M. Enhanced hepatitis C virus genome replication and lipid accumulation mediated by inhibition of AMP-activated protein kinase. Proc Natl Acad Sci U S A. 2010;107(25):11549–54. doi: 10.1073/pnas.0912426107. [DOI] [PMC free article] [PubMed] [Google Scholar]
- McArdle J, Schafer XL, Munger J. Inhibition of Calmodulin-dependent kinase kinase (CaMKK) blocks Human Cytomegalovirus-induced glycolytic activation and severely attenuates production of viral progeny. J Virol. 2010 doi: 10.1128/JVI.01557-10. [DOI] [PMC free article] [PubMed] [Google Scholar]
- Montefiori DC, Robinson WE, Jr, Mitchell WM. Role of protein N-glycosylation in pathogenesis of human immunodeficiency virus type 1. Proc Natl Acad Sci U S A. 1988;85(23):9248–52. doi: 10.1073/pnas.85.23.9248. [DOI] [PMC free article] [PubMed] [Google Scholar]
- Munger J, Bajad SU, Coller HA, Shenk T, Rabinowitz JD. Dynamics of the cellular metabolome during human cytomegalovirus infection. PLoS Pathog. 2006;2(12):e132. doi: 10.1371/journal.ppat.0020132. [DOI] [PMC free article] [PubMed] [Google Scholar]
- Munger J, Bennett BD, Parikh A, Feng XJ, McArdle J, Rabitz HA, Shenk T, Rabinowitz JD. Systems-level metabolic flux profiling identifies fatty acid synthesis as a target for antiviral therapy. Nat Biotechnol. 2008;26(10):1179–86. doi: 10.1038/nbt.1500. [DOI] [PMC free article] [PubMed] [Google Scholar]
- Olivares I, Ballester A, Lombardia L, Dominguez O, Lopez-Galindez C. Human immunodeficiency virus type 1 chronic infection is associated with different gene expression in MT-4, H9 and U937 cell lines. Virus Res. 2009;139(1):22–31. doi: 10.1016/j.virusres.2008.09.010. [DOI] [PubMed] [Google Scholar]
- Pal R, Hoke GM, Sarngadharan MG. Role of oligosaccharides in the processing and maturation of envelope glycoproteins of human immunodeficiency virus type 1. Proc Natl Acad Sci U S A. 1989;86(9):3384–8. doi: 10.1073/pnas.86.9.3384. [DOI] [PMC free article] [PubMed] [Google Scholar]
- Raska M, Takahashi K, Czernekova L, Zachova K, Hall S, Moldoveanu Z, Elliott MC, Wilson L, Brown R, Jancova D, Barnes S, Vrbkova J, Tomana M, Smith PD, Mestecky J, Renfrow MB, Novak J. Glycosylation patterns of HIV-1 gp120 depend on the type of expressing cells and affect antibody recognition. J Biol Chem. 2010;285(27):20860–9. doi: 10.1074/jbc.M109.085472. [DOI] [PMC free article] [PubMed] [Google Scholar]
- Reusch JE, Begum N, Sussman KE, Draznin B. Regulation of GLUT-4 phosphorylation by intracellular calcium in adipocytes. Endocrinology. 1991;129(6):3269–73. doi: 10.1210/endo-129-6-3269. [DOI] [PubMed] [Google Scholar]
- Ringrose JH, Jeeninga RE, Berkhout B, Speijer D. Proteomic studies reveal coordinated changes in T-cell expression patterns upon infection with human immunodeficiency virus type 1. J Virol. 2008;82(9):4320–30. doi: 10.1128/JVI.01819-07. [DOI] [PMC free article] [PubMed] [Google Scholar]
- Sagi M, Fluhr R. Superoxide production by plant homologues of the gp91(phox) NADPH oxidase. Modulation of activity by calcium and by tobacco mosaic virus infection. Plant Physiol. 2001;126(3):1281–90. doi: 10.1104/pp.126.3.1281. [DOI] [PMC free article] [PubMed] [Google Scholar]
- Shoji-Kawata S, Levine B. Autophagy, antiviral immunity, and viral countermeasures. Biochim Biophys Acta. 2009;1793(9):1478–84. doi: 10.1016/j.bbamcr.2009.02.008. [DOI] [PMC free article] [PubMed] [Google Scholar]
- Spector SA, Zhou D. Autophagy: an overlooked mechanism of HIV-1 pathogenesis and neuroAIDS? Autophagy. 2008;4(5):704–6. doi: 10.4161/auto.6105. [DOI] [PMC free article] [PubMed] [Google Scholar]
- Wamelink MM, Struys EA, Jakobs C. The biochemistry, metabolism and inherited defects of the pentose phosphate pathway: a review. J Inherit Metab Dis. 2008;31(6):703–17. doi: 10.1007/s10545-008-1015-6. [DOI] [PubMed] [Google Scholar]
Associated Data
This section collects any data citations, data availability statements, or supplementary materials included in this article.