

Abstract
Repeat expansion detection (RED) is a powerful tool for detection of expanded repeat sequences in the genome. In RED, DNA serves as a template for a repeat-specific oligonucleotide. A thermostable ligase is used to ligate oligonucleotides that have annealed at adjacent positions, creating multimers in a thermal cycling procedure. The products are visualized after gel electrophoresis, transfered to a membrane and subsequently hybridized. Multiple linear regression (MLR) and partial least square (PLS) techniques were used to reveal the most influential factors in the amplification reaction and to identify possible interacting factors. Ligation temperature proved to be the most important factor in the reaction: Temperatures far below the melting point of the oligonucleotide increased the yield considerably. Higher cycle number resulted in a continuous rise in intensity, indicating that the ligase remained active even after 700 cycles or 12 hr of cycling. In addition, the concentration of ligase was found to be important. Using optimal parameters, a 5.5- and 3.2-fold increase in the yield of 180- and 360-nucleotide products respectively was obtained. The improved sensitivity makes the method more robust and facilitates detection of repeat expansions. This improvement may be particularly useful in development of RED for diagnostic purposes as well as for nonradioactive detection of RED products. Based on these results, a new protocol for the RED method was developed taking into account the risk of introducing artifacts with increased enzyme concentrations and lowered annealing temperatures.
In the past few years, expansions of trinucleotide repeats have provided a molecular explanation for a number of genetic disorders, notably myotonic dystrophy (Aslanidis et al. 1992; Fu et al. 1992; Brook et al. 1992) and Huntington’s disease (Huntington’s Disease Collaborative Research Group 1993) as well as several others (for review, see Lindblad and Schalling 1996; Reddy and Housman 1997). A common feature of these disorders is that they cause dysfunction of the central nervous system, with strong phenotypic variability even within families. Increasingly severe phenotypes are observed in subsequent generations, a phenomenon referred to as genetic anticipation. There is evidence for genetic anticipation in other disorders including bipolar affective illness (McInnis et al. 1993; Nylander et al. 1994; Grigoroiu-Serbanescu et al. 1997), schizophrenia (Asherson et al. 1994; Bassett and Honer 1994; Thibaut et al. 1995), and familial hereditary tremor (Chritchely et al. 1949; Jankovic et al. 1997). It is possible that a number of these disorders are caused by genes containing repeat sequences that may expand and lead to dysfunction. Trinucleotide disease genes identified to date contain CAG/CTG, CCG/CGG, GAA/TTC (see Reddy and Housman 1997) and GCG/CGC (Brais 1998). It is possible that expansions resulting in disease may occur in other motifs as a number of genes containing short but polymorphic triplet repeats have been described (Riggins et al. 1992). We have focused on optimizing detection of the most commonly occurring expansion (CAG/CTG) (Riggins et al. 1992; Lindblad et al. 1994).
The repeat expansion detection (RED) (Schalling et al. 1993) technique was developed to make possible the identification of repeat expansions from total genomic DNA without knowledge of flanking sequences. RED has been used to detect expansions in genomic DNA from patients with the trinucleotide diseases myotonic dystrophy (Schalling et al. 1993), Machado-Joseph disease (Lindblad et al. 1996), and spinocerebellar ataxia type 7 (Lindblad et al. 1996). The technique has also been used to map a new CAG/CTG expansion to chromosome 18 (RED-1) (Schalling et al. 1993), to detect four other repeat sequence motifs that may expand (Lindblad et al. 1994), as well as to associate CAG/CTG expansions with bipolar affective illness (Lindblad et al. 1995; O’Donovan et al. 1995, 1996; Oruc et al. 1997) and schizophrenia (Morris et al. 1995; O’Donovan et al. 1995, 1996). RED can also serve as a tool in cloning of new trinucleotide repeat-containing genes (Koob et al. 1998). In RED, the presence of a long repeat in genomic DNA serves as a template for a repeat-specific oligonucleotide. A thermostable ligase is used to ligate oligonucleotides that have annealed at adjacent bases. A large pool of multimers can be generated by multiple cycles of denaturation and annealing in a thermocycling device. The products are separated by gel electrophoresis, electroblotting, and subsequently visualized by hybridization with a labeled repeat probe complementary to the oligonucleotide used in the RED reaction. An advantage with RED is that it can detect expansions anywhere in the genome even when the position of the locus is unknown. In addition, the method can detect long repeated sequences that PCR often fails to amplify such as the expanded allele in myotonic dystrophy.
In the present study, a multivariate optimization technique (Ståhle and Wold 1988) was used to make the RED method more sensitive and reliable. Multivariate analysis was used because several variables may interact in the RED reaction. Multivariate optimization permits identification of interacting variables and makes it possible to reveal which variables have the greatest influence on reaction efficiency. The interaction between variables is here monitored through a response surface in which an optimum can be detected as a convex plane in a coordinate system (Fig. 1), based on a central composite design (Fig. 2). The analysis identified a number of potentially important factors. These were studied with respect to yield, stringency of amplification and detection, and total time consumption. Ligation temperature was identified as the most important single factor among reaction variables. As a result of the optimization procedure we changed the ligation temperature and increased the number of cycles and the enzyme concentration compared to the original protocol (Schalling et al. 1993).
Figure 1.
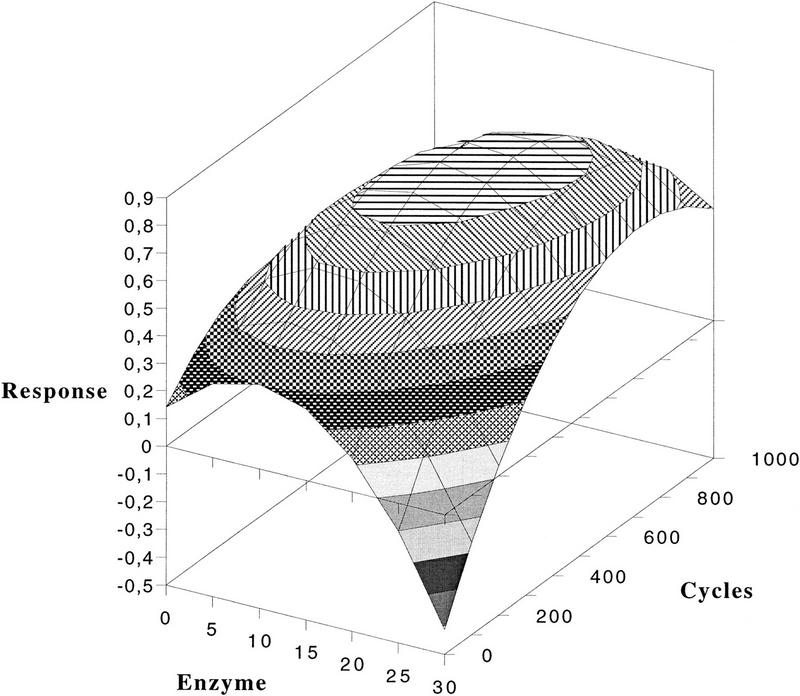
An example of a response surface plot illustrating the effects of variations in enzyme concentration and cycle number.
Figure 2.

Distribution of the experimental points in a factorial design. The corners in the cube represent the +/− levels in the design, the central point is in the middle of the cube, and the −α/+α levels should be at the same distance from the central point.
RESULTS
Six factors that could possibly influence RED efficiency were chosen manually (selection, Table 1). An initial screening identified variation in ligation temperature and cycle number as major factors influencing the yield of both 180- and 360-nucleotide RED products (first two columns in Table 2). The third factor in order of importance affecting 180-nucleotide product synthesis was DNA concentration, whereas ligase concentration was more important for 360-nucleotide products. Variations in oligonucleotide concentration, ligation time, ligase concentration for 180-nucleotide products did not significantly influence the reaction yield. For 360-nucleotide products, variations in ligation time, DNA and oligonucleotide concentration did not have a significant influence (Table 2).
Table 1.
Computer-Assisted Value Selection for RED Optimization
| Levels | Selection | Optimization 1–180 | Optimization 1–360 | Optimization 2 180/360 | |||||||||
|---|---|---|---|---|---|---|---|---|---|---|---|---|---|
| − | + | −α | 0 | +α | −α | 0 | +α | −α | − | 0 | + | +α | |
| Ligation temp. (°C) | 75 | 85 | 72 | 80 | 88 | 72 | 80 | 88 | 57 | 60 | 65 | 70 | 73 |
| Ligation time (sec) | 20 | 60 | 40 | 40 | 3 | 10 | 20 | 30 | 37 | ||||
| Number of cycles | 200 | 800 | 50 | 500 | 950 | 50 | 500 | 950 | 500 | ||||
| Enzyme (units) | 5 | 25 | 15 | 1 | 15 | 29 | 7 | 10 | 15 | 20 | 23 | ||
| DNA (μg) | 0.5 | 2.0 | 0.2 | 1.25 | 2.3 | 1.25 | 1.25 | ||||||
| Oligonucleotide (ng) | 50 | 150 | 100 | 100 | 100 | ||||||||
Table 2.
PLS Regression Analysis
| X variables | Results of Selection | Results of first (1) and second (2) optimization | 1 and 2 (180 nt) | 1 and 2 (360 nt) | ||||
|---|---|---|---|---|---|---|---|---|
| 180 nt | 360 nt | 1 (180 nt) | 1 (360 nt) | 2 (180 nt) | 2 (360 nt) | |||
| Ligation temp. | −0.45 ± 0.16 | −0.23 ± 0.11 | −0.64 ± 0.02 | −0.41 ± 0.06 | NS | NS | −0.22 ± 0.04 | −0.18 ± 0.02 |
| Cycles | 0.35 ± 0.16 | 0.28 ± 0.11 | 0.17 ± 0.05 | 0.34 ± 0.07 | 0.077 ± 0.04 | 0.046 ± 0.02 | ||
| Enzyme conc. | NS | 0.24 ± 0.11 | 0.20 ± 0.07 | 0.32 ± 0.07 | 0.10 ± 0.09 | NS | 0.088 ± 0.04 | |
| DNA conc. | 0.22 ± 0.16 | NS | NS | NS | ||||
| Oligo conc. | NS | NS | ||||||
| Ligation time | NS | NS | 0.19 ± 0.05 | 0.22 ± 0.06 | −0.078 ± 0.04 | −0.12 ± 0.02 | ||
| Temp. (2) | 0.32 ± 0.05 | 0.22 ± 0.16 | −0.24 ± 0.07 | −0.25 ± 0.08 | −0.13 ± 0.02 | −0.081 ± 0.03 | ||
| Cycles (2) | −0.02 ± 0.01 | −0.31 ± 0.05 | 0.10 ± 0.03 | −0.16 ± 0.03 | ||||
| Enzyme conc. (2) | NS | 0.19 ± 0.09 | 0.12 ± 0.10 | −0.14 ± 0.06 | 0.15 ± 0.03 | |||
| DNA conc. (2) | −0.190 ± 0.08 | −0.076 ± 0.04 | ||||||
| Time (2) | 0.16 ± 0.04 | 0.14 ± 0.05 | −0.062 ± 0.02 | −0.039 ± 0.01 | ||||
| Temp. × cycles | 0.09 ± 0.04 | −0.11 ± 0.07 | −0.10 ± 0.08 | NS | 0.047 ± 0.03 | |||
| Temp. × enzyme conc. | NS | NS | NS | −0.072 ± 0.03 | ||||
| Temp. × DNA conc. | NS | NS | ||||||
| Temp. × time | −0.11 ± 0.06 | NS | −0.12 ± 0.02 | −0.12 ± 0.02 | ||||
| Cycles × enxyme conc. | 0.16 ± 0.10 | 0.090 ± 0.05 | ||||||
| Cycles × DNA conc. | −0.08 ± 0.04 | |||||||
| Cycles × time | 0.089 ± 0.05 | |||||||
| Enzyme conc. × time | NS | −0.14 ± 0.05 | NS | |||||
Regression coefficients are given with the confidence limits at P = 0.05. (nt) = Nucleotides.
In a second set of experiments, the four most influential parameters identified in the initial screening, columns marked 1–180 and 1–360 nucleotides in Table 2, were further analyzed. We focused on finding the optimal values for the top three of the four parameters at each RED product size.
An increased yield was observed with decreasing ligation temperature for all RED products [partial least square (PLS) r = −0.64 and PLS r = −0.41 at P = 0.05 for 180- and 360-nucleotide products, respectively (columns marked 1–180 and 1–360-nucleotides]. There was also a correlation between cycle number and product yield. An increased cycle number gave a higher yield (up to 700 cycles). The 180-nucleotide product gave a maximum yield when just above 1.0 μg DNA/sample were used. Higher ligase concentrations (up to 29 U/sample) increased the yield of larger products (360 nucleotides) (PLS r = 0.20; P = 0.05) (Table 2). DNA concentration and the number of cycles were also inter-related at 180-nucleotides (PLS r = −0.08; P = 0.05), but in a negatively synergistic manner, such that a lower DNA concentration required an increased number cycles to maintain the same amount of product (Table 2). In the 360-nucleotide model, increased enzyme concentration and cycle number had a positive synergistic effect on yield (PLS r = 0.16; P = 0.05) (Table 2). All experiments run at 88°C, all experiments with 0.2 μg of DNA as well as all experiments with a combination of ≤0.5 μg of DNA and ⩾85°C failed to generate any detectable 180- or 360-nucleotide products. Based on this, all of the 15 out of 80 experiments that did not give a 180-nucleotide product were excluded from the data set. In analogy, 28 of 80 experiments failed to produce 360-nucleotide product and were excluded. In addition, three 360-nucleotide outliers were detected and subsequently excluded.
The cross-validation analysis indicated that 80% of the variation of the response (y) is predicted by our models for both the 180- and 360-nucleotide products. Results were analyzed both with PLS and MLR (multiple linear regression) methods, with approximately the same result.
The new protocol optimized for product yield at 180- and 360-nucleotide product, respectively, was compared with the original protocol (Schalling et al. 1993) in a separate experiment. The protocol optimized for 360-nucleotide products gave the most significant improvement with 5.5 (P < 2 × 10⁻¹⁰) and 3.2 (P < 2 × 10⁻⁸) times more of the 180- and 360-nucleotide product, respectively (Fig. 3). This protocol included a reduced ligation temperature (72°C), an increased cycle number (950), and a higher enzyme concentration (29 units).
Figure 3.
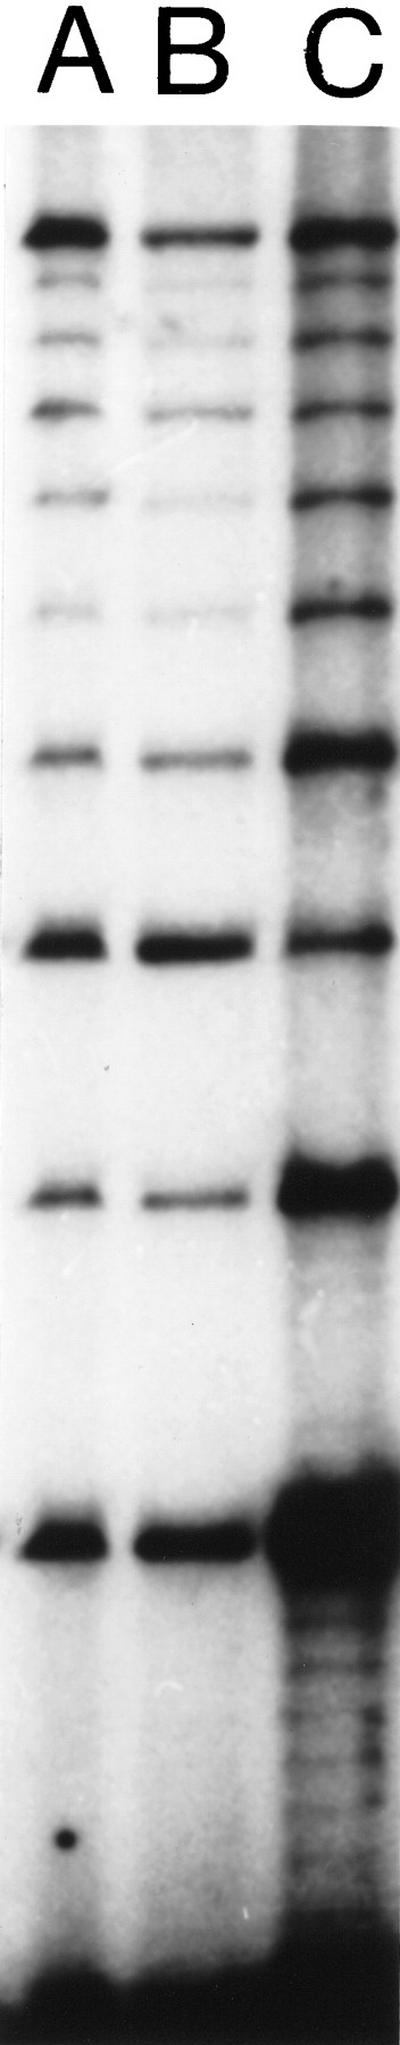
Results of RED performed on DNA from cell line GM 10 850. (A) A sample from the RED protocol used prior to improvement. (B) A standardized RED sample, i.e., a batch of pooled runs of the RED protocol used in A, see under Quantitation. Because of evaporation, the amount of sample applied to the electrophoresis gel was slightly smaller for individual runs (A) than for pooled runs. Thus the amount of product is slightly higher in lane B. (C) A RED sample from the new protocol predicted to give a higher yield. It included a low annealing/ligation temperature (72°C), higher Ampligase concentration (29 units), and was cycled cycled 950 times. We observed a 3.2-fold higher yield of the 360-nucleotide band than an average RED run with the protocol of Schalling and coworkers (1993).
A new set of experiments was defined to further explore the domain outlined by the results from the first design (columns marked 2–180 and 2–360 nucleotides in Table 2). In this set, ligation temperature (57°C–73°C), ligation time (3–37 sec) and enzyme concentration (7–23 units) were investigated. A negative synergistic effect was seen between ligation time and ligation temperature: A low temperature was more important for 180-nucleotide product yield when a short ligation time was used. The enzyme concentration and the ligation time also interacted in a negative synergistic manner in the formation of the 360-nucleotide (PLS r = −0.14; P = 0.05) products. This was demonstrated by a shorter ligation time requiring more enzyme. The two sets of experiments defined above were superimposed onto each other and a larger domain investigated [columns marked 1 and 2 (180 nucleotides) and 1 and 2 (360 nucleotides) in Table 2]. This composite analysis showed the same synergism as described above, but also revealed a positive synergistic effect involving enzyme concentration and cycle number for 180-nucleotide products (PLS r = 0.09; P = 0.05).
The specificity of the reaction was tested using a plasmid containing a 141-bp cloned repeat fragment from a myotonic dystrophy patient. The plasmid was used with annealing temperatures spanning from 67°C–82°C. We observed no artifactual band at a concentration of plasmid DNA equimolar in repeat copy number to that of the amount of genomic DNA normally used (1 μg) (not shown). With more than two times the equimolar plasmid DNA concentrations, 1–2 additional bands were seen above the accurate 150-nucleotide band even at 77°C and below. However, DNA from patients with Huntington’s disease, containing a repeat with known length, produced additional bands at temperatures lower than 77°C. When genomic DNA from cell line GM 10850 was used as a substrate, the longest product observed remained 360 nucleotides even with ligation temperatures as low as 57°C (not shown).
The yield of RED products was investigated with different blotting and hybridization procedures. Dry capillary blotting (Sirugo et al. 1994 and M. Litt, pers. comm.), wet capillary blotting (Hoefer News 1994), and electroblotting (Schalling et al. 1993) were compared. Dry capillary blotting was found to give the same yield of RED products as electrotransfer with a reduced occurrence of artifacts (Fig. 4). The transfer by wet capillary blotting is technically difficult as the gel does not adhere to a wet filter paper making the procedure prone to artifacts (Fig. 4). Hybridization in Amersham Rapid Hybe allowed hybridization time to be shortened to 45 min with similar results as previous overnight incubations. The improved RED protocol is presented in Table 3.
Figure 4.
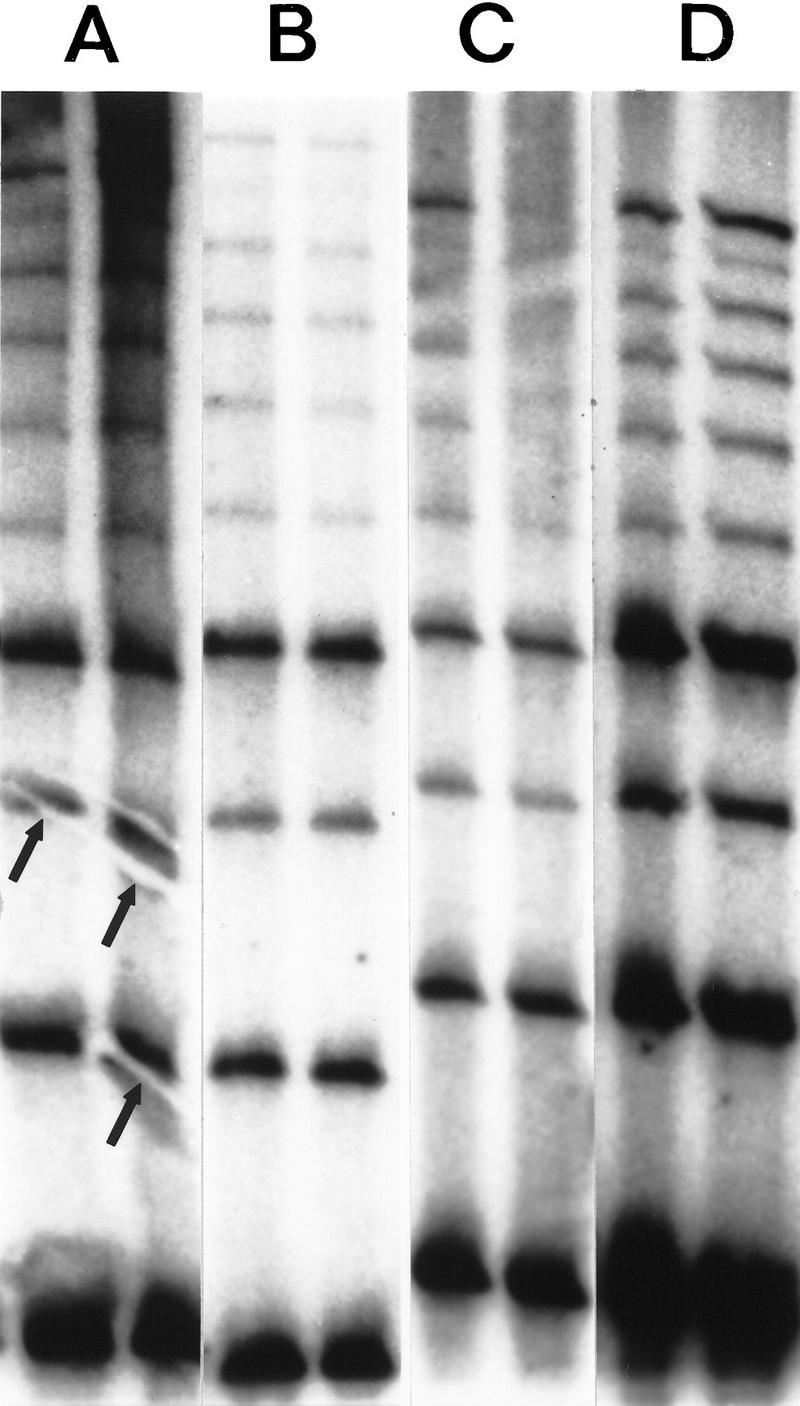
The effects of various blotting and hybridization techniques on RED of DNA from cell line GM 10850 using a (CTG)10 oligonucleotide. (A) Electrotransfer, 2 A for 40 min in 1× TBE. Prehybridization and hybridization in Amersham Rapid Hybe for 30 min and 45 min, respectively. The membrane was washed for 20 min at room temperature and for 2 × 15 min at 60°C in 1× SSC, 0.1% SDS. Typical electroblotting artifacts are shown (arrows). (B) Wet capillary gel transfer. The completed gel was placed on top of a stack of wet filter papers, overlaid with a sheet of wet membrane, covered with another sheet of wet filter paper, then topped with a stack of dry filter sheets and a weight for 2 hr. (C) The DNA was transferred from the gel onto a membrane by dry capillary blotting. A wet (1× TBE) Hybond N+ membrane was placed on the gel, overlaid with three dry 3M papers and a weight for 2 hr. Following UV immobilization the membrane was prehybridized for 30 min and hybridized for 45 min at 60°C in CHURCH solution. Thereafter the same washing procedure were used as in A and B. (D) Dry capillary blotting as described above in C. Hybridization and washing conditions as in A and B.
Table 3.
RED Protocol
| Ligation temp. | 77°C |
| Ligation time | 20 sec |
| Denaturation temp. | 94°C |
| Denaturation time | 10 sec |
| Cycle number | 500 |
| Enzyme | 15 units |
| DNA | 1.0 μg |
| Oligonucleotide | 100 ng |
DISCUSSION
We have optimized the RED method using a statistical experimental design to pinpoint the factors that exert greatest influence on the reaction. We hypothesized that several factors could be interacting in the enzymatic reaction, thereby affecting the reaction yield. Accordingly, the multivariate approach allowed us to study the entire reaction system in one set up. Using this approach, we avoided the methodological pitfalls associated with a more traditional approach, that is, changing one factor at a time (Box et al. 1978).
The experimental design suggested ligation temperature to be the most important factor in all domains investigated. A lower ligation temperature (57°C–77°C) than used previously, increased the product yield. At a temperature >88°C no product could be detected. Reactions containing a smaller amount of DNA (0.5 μg/sample) yielded no product at 85°C. Thus, more DNA is required for generation of detectable amounts of product when stringent conditions are used. This could be caused by less complete annealing of the oligonucleotide. The calculated Tm of the oligonucleotide used varies between 73°C with the OSP software (oligonucleotide selection program, Hillier and Green 1991) and 86°C with the %GC content method. An alternative explanation for the increased substrate requirement would be reduced enzyme activity at high temperatures. There is, however, evidence that the thermostable enzyme used has a half-life >1 hr at 95°C (Epicentre Technologies).
In general, the specificity of the ligation is enhanced by performing the reaction at or near the Tm of the oligonucleotide (Barany 1991). However, when genomic DNA from cell line GM 10850 was used as a substrate, the size of the longest product neither increased nor decreased even with extremely low annealing/ligation temperatures (57°C). One might argue that even at low temperatures the ligation products generated from long templates remains stable. However, longer artifactual products were observed at temperatures <77°C, when genomic DNA containing shorter expansions were used as substrates. No shift in product formation was observed at low temperatures when an equimolar concentration of plasmid DNA containing a 141-bp repeat was used. Perhaps extra bands are produced more easily in the shorter size range, because of the presence of multiple short loci in the genome where ligations could occur. Alternatively, loci containing imperfect repeats might serve as substrates for ligation at a low annealing temperature. Both phenomena would increase the concentration of 90- to 120-nucleotide products to such a level that these products effectively compete with the monomer in the RED reaction, resulting in artefactual size representation. These extra products would also be generated from reactions using DNA containing a repeat of several hundred nucleotides as substrate. It is possible that the absence of extra bands at low temperatures in DNA containing long repeats is because the above mechanism contributes only artefactual products <200 nucleotides in length. A high DNA concentration in combination with a low ligation temperature would increase the likelihood that such short products would be recycled in the ligation reaction.
There was a continuous rise in product yield up to 700 cycles, indicating that the Ampligase is active even after 12 hr of cycling time; subsequently, the intensity leveled off. DNA concentration was not of great importance in the broader model; however, concentrations <0.2 μg/sample produced no detectable yield. Runs at a low number of cycles or at high temperatures together with a fairly low DNA concentration (<0.5 μg/sample) produced a low yield or no yield at all. Oligonucleotide concentration did not significantly affect the reaction yield in the experimental domain that we explored. However, it is likely that a severalfold decrease in oligonucleotide concentration would affect the yield significantly. Shorter ligation times appear to influence the yield. A short ligation time in conjunction with a low annealing/ligation temperature was observed to yield more product, suggesting that the total time within a temperature range during which oligonucleotides may anneal and become ligated is of importance. An inverse correlation was observed between ligation time and enzyme concentration such that a shorter ligation time required more enzyme.
In a set of preliminary experiments, we found that the optimal buffer concentration varied from one DNA sample to another. The use of microgram amounts of DNA in 10-μl reaction volumes make the DNA source or variations in the DNA isolation procedure more important than in other amplification reactions and problems encountered may be analogous to those seen in restriction digests for Southern blots. Buffer concentration may thus need to be adjusted depending on DNA source and the preparation method (data not provided).
In screening for expanded repeats in DNA from patients we observed 120-nucleotide products in all individuals (Lindblad et al. 1995). Because the human genome contains a high number of trinucleotide repeats (Gastier et al. 1995), it is most likely that products ≤120 nucleotides result from annealing of oligonucleotides to multiple CAG repeats in the genome where repeat size permits ligation of three or four oligonucleotides. Ninety to 120 nucleotides may be considered a lower limit in size for detection of expansions using RED. This baseline could not be lowered by varying the size of the oligonucleotide used, leading to the conclusion that it is substrate dependent.
From the GM 10 850 cell line we usually observed strong 60-, 90-, 120-, 180-, and 360-nucleotide products but much weaker 150- and 210- to 330-nucleotide products. One possible explanation for this pattern is that the cell line contains two repeat expansions sized ∼180- and 360-nucleotides. The reason that in particular the 180- and 360-nucleotide products appear strong could be that the sizes of the expanded repeats allow for a particularly good fit of a certain number of oligonucleotides. Such a correlation was indeed observed in a RED study of repeat expansions in Machado-Joseph disease, in which PCR was used to identify the actual repeat size (Lindblad et al. 1996b).
The trinucleotide disease group consist of several disorders, analysis of which accounts for a significant share of diagnostic DNA analysis. It is likely that several disorders will be added to this group in the future because a number of diseases for which the genetic defect remains unknown show anticipation, a hallmark of repeat expansion disorders. The RED method has proven useful both in the discovery and diagnosis of repeat expansions. The novel protocol presented here using multivariate statistical approaches is robust and hence a useful tool in the search for, and cloning of, novel expansions. In addition, it may prove useful when nonradioactive automatic analysis systems are used. The new protocol may also facilitate the use of the RED technique with samples containing low amounts of DNA.
METHODS
Sources of DNA and Oligonucleotides
Genomic DNA was prepared from the cell line GM 10 850 (Coriell, Camden, NJ) from individual 134402, Centre d’Etude Polymorphism Humain (CEPH, Paris, France) using a standard phenol/chloroform extraction method. This individual had earlier been shown to have a long CAG/CTG expansion (Schalling et al. 1993) here represented by a 360-nucleotide RED ligation product. Oligonucleotides were synthesized and when appropriate, phosphorylated and FLPC-purified by Pharmacia Biotech (Uppsala, Sweden). The RED procedure was optimized using a 30-mer CTG oligonucleotides.
RED Reaction Conditions
All reactions were performed on a GeneAmp PCR System 9600 (Perkin Elmer Cetus, Norwalk, CT). Reactions contained between 0.2 and 2.3 μg of genomic DNA, 50–150 ng of phosphorylated (CTG)10 oligonucleotide, and 1–29 units of Ampligase (Epicentre, Madison, WI) with 1× the supplied Ampligase buffer. Total reaction volume was 10 μl. For specific amounts in each set of experiments see Experimental Design and Multivariate Data Analysis. The cycling process always started with a 5-min denaturation at 95°C, followed by 50–950 cycles of ligation and denaturation. Ligation and denaturation were performed at 57°C–88°C for 3–60 sec and at 94°C for 10 sec, respectively.
Electrophoresis and Hybridization
RED products were heat denatured in a loading buffer containing 50% formamide, bromphenol blue, and xylene cyanol for 5 min prior to electrophoresis on a 6% polyacrylamide/6 m urea gel. The gel was subsequently transferred to 3MM filter paper (3MM, Maidstone, UK) and the DNA electrotransferred to Hybond N+ membrane (Amersham, Little Chalford, UK) using 2 A for 40 min in 1× TBE. Following the UV immobilization, membranes were hybridized for 16 hr at 60°C to a (CAG)10 oligonucleotide, that had been 3′-end labeled using terminal deoxynucleotidyl transferase (Bethesda Research Laboratories, Bethesda, MD) and 32P dATP (NEG 012Z, NEN, DuPont, Boston, MA) to a specific activity of 2–9 × 10⁹ cpm/μg. Membranes were washed in 1× SSC, 0.1% SDS for 2 hr at 60°C, and autoradiographed for 14 hr on Du Pont Reflection (NEN, DuPont, NEF 495) X-ray film using an intensifying screen.
Quantitation
Membranes were exposed to PhosphorImager storage screens and scanned with a Molecular Dynamics 400A PhosphorImager (Sunnyvale, CA), which gives quantitative measurement of product yield (Johnston 1990). The PhosphorImager was used to analyze 90-, 180-, and 360-nucleotide products. The value for each band was given as the ratio of that band to the corresponding band average, derived from three standardized RED reaction runs, placed at intervals of 10 lanes on the same gel.
Experimental Design and Multivariate Data Analysis
A statistical experimental design (Carlson 1992) was used to optimize the RED method. The conditions for each experiment were predefined and all experiments were carried out in a random order. All the investigated variables were continuous and easily adjustable from one experiment to another. The model required two sets of experiments.
Screening for the Most Important Parameters in RED
A fractional factorial two-level design (Box and Draper 1987) was used to find the most influential among potentially important factors. An interval was defined for each factor based on previous experience and on practical limitations such as enzyme cost and DNA consumption. Two levels were chosen for each factor: an upper (+ level) and a lower (− level), bracketing the interval of interest. In a set of 16 experiments the following seven variables were included: annealing temperature/ligation temperature; ligation time; number of cycles; enzyme, DNA, and oligo concentration (see Table 1, Selection). Two to three of these variables were changed during each of the individual runs according to a computer-generated schedule (Box and Draper 1987).
Results were represented as points in a coordinate system, with as many axes as there are variables, a multivariate space. Just as when one fits a line to points in a two-dimensional coordinate system, a hyperplane or a response surface was fitted to the measured responses in the multivariate space. A response surface (Carlson 1992) defines a surface in the space spanned by (Y, X1, X2, X3, ..., Xk). The response is represented as convex and concave planes near the maximum and minimum responses, respectively. As a result of the interactions between different factors, this plane may appear twisted. A part of the model, with two variables (X1 and X2) and their response (Y) are presented in a three-dimensional space (Fig. 1).
Optimization of Ligation Temperature, Cycle Number, and Ligase and DNA Concentrations
The preliminary analysis revealed the four most influential factors: ligation temperature, cycle number, and the concentrations of ligase and DNA. These parameters were then investigated with regard to the shape of the response surface around and out (−α, +α) from the experimental domain investigated previously (see optimization 1, Table 1). The addition of 12 centerpoints to the central composite design gave stronger orthogonality and thereby a more stable model. The centerpoints also allowed an estimation of the variance of the experimental error and made it possible to assess the presence of curvature indicating a nonlinear response. A central composite design was used for creation of response surfaces for those four factors (see Fig. 2). The analysis focused on the three most influential factors for the yield of 180- and 360-nucleotide products, respectively (see Table 1). Another central composite design was used to explore the experimental domain outlined by the results from the first design (see optimization 2, Table 1). The two designs were partly overlapping, making it possible to superimpose them and evaluate a larger domain. In optimization 1, we also measured the yield of the 180-nucleotide product in the model designed for the 360-nucleotide product (see Table 1; data not shown) and vice versa. The results from this analysis were used only when values from optimization 1 and 2 were combined (see last two columns of Table 2).
Statistical Analysis
The response surfaces used in the present paper are polynomial models describing the measured response (Y) as a functional effect of the experimental variables (X1, X2, X3, etc.). We used a Taylor polynomial model, an approximation of an unknown function:
 |
The model parameter β0 estimates the response when all variables are set to zero, that is, the measured response. The βi coefficient is a measure of the linear dependence of the corresponding variable. A cross-product coefficient, βij, is an estimate of the effect of interaction between the effect variables. Y is the measured response and X represents the different variables. Square terms describe nonlinear influence of X on the response and ɛ is the unexplained variation or residuals. The variables are normalized with the maximum value corresponding to 1 and the minimum value to −1. Normalization makes it possible to compare the effects of different variables.
The model parameters in our experiments were estimated by multiple linear regression and partial least-squares regression methods (Geladi and Kowalski 1986), which also were used later for data analysis. The analysis allowed us to study trends and to detect outliers (samples that did not fit with the model). Cross validation (Wold 1978) was used to assess the quality of each observation. Data from a small number of samples were then excluded from the data set. The PLS or MLR model was then computed using data from the remaining samples and the Y-values of the removed values were thereafter predicted from the model and compared with the actual Y. Codex software (Codex 2.5′, Sum IT System AB, Solna, Sweden) was used to evaluate the design and for the analysis of the responses.
Acknowledgments
We thank G. Akkusjärvi for use of the PhosphorImage Analysis system and M. Nordenskjöld, M. Anvret, and T. Hudson for contributing DNA samples. This study was funded by the EC Biomed 1 (grant Gene CT93-0060) and EC Biomed 2 (grant BMH4-97-2466), Swedish Medical Reseach Council (grants 10995 and 10909), Svenska Läkaresällskapet, Thuring stiftelse, Söderström-Königska stiftelse, funds from the Karolinska Institute and Karolinska Hospital, and the Ireland Established Investigator Award (NARSAD) to M.S. C.Z. is the holder of a grant from Association Francaise d’Ataxie de Friedriech (AFAF).
The publication costs of this article were defrayed in part by payment of page charges. This article must therefore be hereby marked “advertisement” in accordance with 18 USC section 1734 solely to indicate this fact.
Footnotes
E-MAIL Martin.Schalling@cmm.ki.se; FAX 46 8 5177 3909.
REFERENCES
- Asherson P, Walsh C, Williams J, Sargeant M, Taylor C, Clements A, Gill M, Owen M, Mc Guffin P. Imprinting and anticipation: Are they relevant to genetic studies of schizophrenia? Br J Psychiatr. 1994;164:619–624. doi: 10.1192/bjp.164.5.619. [DOI] [PubMed] [Google Scholar]
- Aslandis C, Jansen G, Amemiya C, Shutler G, Mahadevan M, Tsilfidis C, Chen C, Alleman J, Wormskamp NG, Vooijs M, et al. Cloning of the essential myotonic dystrophy region and mapping of the putative defect. Nature. 1992;355:548–551. doi: 10.1038/355548a0. [DOI] [PubMed] [Google Scholar]
- Barany F. Genetic disease detection and DNA amplification using cloned thermostable ligase. Proc Natl Acad Sci. 1991;88:189–193. doi: 10.1073/pnas.88.1.189. [DOI] [PMC free article] [PubMed] [Google Scholar]
- Bassett AS, Honer WG. Evidence for anticipation in schizophrenia. Am J Hum Genet. 1994;54:864–870. [PMC free article] [PubMed] [Google Scholar]
- Hoefer News. Blotting Sequencing Gels. 1994. 3: 1. [Google Scholar]
- Brais B, Bouchard JP, Xie YG, Rochefort DL, Chretien N, Tome FM, Lafreniere RG, Rommens JM, Uyama E, Nohira O, et al. Short GCG expansions in the PABP2 gene cause oculopharyngeal muscular dystrophy. Nat Genet. 1998;18:164–167. doi: 10.1038/ng0298-164. [DOI] [PubMed] [Google Scholar]
- Box GEP, Draper NR. Empirical model-building and response surfaces. New York, NY: Wiley; 1987. pp. 131–134. [Google Scholar]
- Box GEP, Hunter WG, Hunter JS. Statistics for experimenters. New York, NY: Wiley; 1978. [Google Scholar]
- Brook JD, McCurrach ME, Harley HG, Buckler AJ, Church D, Aburatani H, Hunter K, Stanton VP, Thirion JP, Hudson T, et al. Molecular basis of myotonic dystrophy: Expansion of a trinucleotide (CTG) repeat at the 3′ end of a transcript encoding a protein kinase family member. Cell. 1992;68:799–808. doi: 10.1016/0092-8674(92)90154-5. [DOI] [PubMed] [Google Scholar]
- Carlson R. Design and optimization in organic synthesis. Amsterdam, The Netherlands: Elsevier; 1992. [Google Scholar]
- Critchely E. Observations on essential (heredofamilial) tremor. Brain. 1949;72:113–139. doi: 10.1093/brain/72.2.113. [DOI] [PubMed] [Google Scholar]
- Fu YH, Pizzuti A, Fenwock RG, Jr, King J, Rajnarayan S, Dunne PW, Dubel J, Nasser GA, Ashizawa T, de Jong P, et al. An unstable triplet repeat in a gene related to myotonic muscular dystrophy. Science. 1992;255:1256–1258. doi: 10.1126/science.1546326. [DOI] [PubMed] [Google Scholar]
- Gastier JM, Pulido JC, Sunden S, Brody T, Buetow KH, Murray JC, Weber JL, Hudson TJ, Sheffield VC, Duyk M. Survey of trinucleotide repeats in the human genome: Assessment of their utility as genetic markers. Hum Mol Gen. 1995;4:1829–1836. doi: 10.1093/hmg/4.10.1829. [DOI] [PubMed] [Google Scholar]
- Geladi P, Kowalski BR. Partial least squares regression (PLS): A tutorial. Anal Chim Acta. 1986;185:1–17. [Google Scholar]
- Grigoroiu-Serbanescu M, Wickramaratne PJ, Hodge SE, Milea S, Mihailescu R. Genetic anticipation and imprinting in bipolar I illness. Br J Psychiatr. 1997;170:162–166. doi: 10.1192/bjp.170.2.162. [DOI] [PubMed] [Google Scholar]
- Hillier L, Green P. OSP: An oligonucleotide selection program. PCR Meth Appl. 1991;1:124–128. doi: 10.1101/gr.1.2.124. [DOI] [PubMed] [Google Scholar]
- Jankovic J, Beach J, Pandolfo M, Patel PI. Familial essential tremor in 4 kindreds: Prospect for genetic mapping. Arch Neurol. 1997;54:289–294. doi: 10.1001/archneur.1997.00550150047015. [DOI] [PubMed] [Google Scholar]
- Johnston R F, Pickett SC, Barker DL. Autoradiography using storage phosphor technology. Electrophoresis. 1990;11:355–360. doi: 10.1002/elps.1150110503. [DOI] [PubMed] [Google Scholar]
- Koob MD, Benzow KA, Bird TD, Day SW, Moseley ML, Ranum LPW. Rapid cloning of expanded trinucleotide repeat sequences from genomic DNA. Nat Genet. 1998;18:72–75. doi: 10.1038/ng0198-72. [DOI] [PubMed] [Google Scholar]
- Lindblad K, Schalling M. Clinical implications of unstable DNA sequences. Acta Paediatr. 1996;85:265–271. doi: 10.1111/j.1651-2227.1996.tb14011.x. [DOI] [PubMed] [Google Scholar]
- Lindblad K, Zander C, Hudson T, Schalling M. Growing triplet repeats. Nature Genet. 1994;7:124. doi: 10.1038/ng0694-124. [DOI] [PubMed] [Google Scholar]
- Lindblad K, Nylander PO, De bruyn A, Sourey D, Zander C, Engström C, Holmgren G, Hudson T, Chotai J, Mendlewicz J, et al. Detection of expanded CAG repeats in bipolar affective disorder using the repeat expansion detection (RED) method. Neurobiol Dis. 1995;2:55–62. doi: 10.1006/nbdi.1995.0006. [DOI] [PubMed] [Google Scholar]
- Lindblad K, Savontaus M-L, Stevanin G, Holmberg M, Digre K, Zander C, Ehrsson H, David G, Benomar A, Nikoskelainen E, et al. An expanded CAG repeat sequence in spinocerebellar ataxia type 7. Genome Res. 1996a;6:965–971. doi: 10.1101/gr.6.10.965. [DOI] [PubMed] [Google Scholar]
- Lindblad K, Lunkes A, Maciel P, Stevanin G, Zander C, Klockgether T, Ratzlaff T, Brice A, Rouleau GA, Hudson T, et al. Mutation detection in Machado-Joseph disease using repeat expansion detection. Mol Med. 1996b;2:77–85. [PMC free article] [PubMed] [Google Scholar]
- McInnis M G, McMahon FJ, Chase GA, Simpson SG, Ross CA, DePaulo JR., Jr Anticipation in bipolar affective disorder. Am J Hum Genet. 1993;53:385–390. [PMC free article] [PubMed] [Google Scholar]
- Morris AG, Gaitonde E, McKenna PJ, Mollon JD, Hunt DM. CAG repeat expansions and schizophrenia: Association with disease in females and with early age-at-onset. Hum Mol Genet. 1995;4:1957–1961. doi: 10.1093/hmg/4.10.1957. [DOI] [PubMed] [Google Scholar]
- Nylander PO, Engström C, Chotai J, Wahlström J, Adolfsson R. Anticipation in Swedish families with bipolar affective disorder. J Med Genet. 1994;31:686–689. doi: 10.1136/jmg.31.9.686. [DOI] [PMC free article] [PubMed] [Google Scholar]
- O’Donovan MC, Guy C, Craddock N, Murphy KC, Cardno AG, Jones LA, Owen MJ, McGuffin P. Expanded CAG repeats in schizophrenia and bipolar disorder. Nat Genet. 1995;10:380–381. doi: 10.1038/ng0895-380. [DOI] [PubMed] [Google Scholar]
- O’Donovan MC, Guy C, Craddock N, Bowen T, McKeon P, Macedo A, Maier W, Wildenauer D, Aschauer HN, Sorbi S, et al. Confirmation of association between expanded CAG/CTG repeats and both schizophrenia and bipolar disorder. Psychol Med. 1996;26:1145–1153. doi: 10.1017/s0033291700035868. [DOI] [PubMed] [Google Scholar]
- Oruc L, Lindblad K, Verheyen GR, Ahlberg S, Jakovljevic M, Ivezic S, Raeymaekers P, vanBroeckhoven C, Schalling M. CAG repeat expansions in bipolar and unipolar disorders. Am J Hum Genet. 1997;60:730–732. [PMC free article] [PubMed] [Google Scholar]
- Reddy PS, Housman DE. The complex pathology of trinucleotide repeats. Curr Opin Cell Biol. 1997;9:364–372. doi: 10.1016/s0955-0674(97)80009-9. [DOI] [PubMed] [Google Scholar]
- Riggins GJ, Lokey LK, Chastain JL, Leiner HA, Sherman SL, Wilkinson KD, Warren ST. Human genes containing polymorphic trinucleotide repeats. Nat Genet. 1992;2:186–191. doi: 10.1038/ng1192-186. [DOI] [PubMed] [Google Scholar]
- Schalling M, Hudson TJ, Buetow KH, Housman DE. Direct detection of novel expanded trinucleotide repeats in the human genome. Nat Genet. 1993;4:135–139. doi: 10.1038/ng0693-135. [DOI] [PubMed] [Google Scholar]
- Sirugo, G., J. Parnas, T. Haaf, P. Holzman, L. Wetterberg, S. Matthysse, and K. Kidd. 1994. Scanning for unstable trinucleotide repeats in neuropsychiatric disorders: Detection of a large CTG expansion in a patient. Am. J. Hum. Genet. (Suppl.) 55: 182.
- Ståhle L, Wold S. Multivariate data analysis and experimental design in biomedical research. In: Ellis GP, West GB, editors. Progress in medicinal chemistry. Vol. 25. Amsterdam, The Netherlands: Elsevier Science Publisher; 1988. pp. 292–338. [DOI] [PubMed] [Google Scholar]
- Thibaut F, Martinez M, Petit M, Jay M, Campion D. Further evidence for anticipation in schizophrenia. Psychiatr Res. 1995;59:25–33. doi: 10.1016/0165-1781(95)02778-5. [DOI] [PubMed] [Google Scholar]
- The Huntington’s Disease Collaborative Research Group. A novel gene containing a trinucleotide repeat that is expanded and unstable on Huntington’s disease chromosome. Cell. 1993;72:971–983. doi: 10.1016/0092-8674(93)90585-e. [DOI] [PubMed] [Google Scholar]
- Wold S. Cross-validatory estimation of the number of components in factor and principal components models. Technometrics. 1978;20:397–405. [Google Scholar]