Abstract
In neuroprosthetic applications, long-term electrode viability is necessary for robust recording of the activity of neural populations used for generating communication and control signals. The corrosion of tungsten microwire electrodes used for intracortical recording applications was analyzed in a controlled bench-top study and compared to the corrosion of tungsten microwires used in an in vivo study. Two electrolytes were investigated for the benchtop electrochemical analysis: 0.9% phosphate buffered saline (PBS) and 0.9% PBS containing 30 mM of hydrogen peroxide. The oxidation and reduction reactions responsible for corrosion were found by measurement of the open circuit potential and analysis of Pourbaix diagrams. Dissolution of tungsten to form the tungstic ion was found to be the corrosion mechanism. The corrosion rate was estimated from the polarization resistance, which was extrapolated from the electrochemical impedance spectroscopy data. The results show that tungsten microwires in an electrolyte of PBS have a corrosion rate of 300–700 µm/yr. The corrosion rate for tungsten microwires in an electrolyte containing PBS and 30 mM H2O2 is accelerated to 10,000–20,000 µm/yr. The corrosion rate was found to be controlled by the concentration of the reacting species in the cathodic reaction (e.g. O2 and H2O2). The in vivo corrosion rate, averaged over the duration of implantation, was estimated to be 100 µm/yr. The reduced in vivo corrosion rate as compared to the benchtop rate is attributed to decreased rate of oxygen diffusion caused by the presence of a biological film and a reduced concentration of available oxygen in the brain.
Keywords: tungsten corrosion, tungsten microwire array, neural recording electrode
1 Introduction
Electrochemical reactions at the metal/tissue interface constrain the suitability of biological implant materials for orthopedic, dental, and neuroprosthetic applications. Corrosion, for example, can cause failure of an implanted device, and the associated release of metal ions may itself provoke a toxic reaction. Corrosion of metal implants for orthopedic applications has been extensively studied and is still an ongoing issue (Jacobs et al., 1998). A large body of literature is available on the electrochemical analysis of metals and metal oxides used for neural stimulation purposes (Brummer and Turner, 1977; Norlin et al., 2005, 2002; Merrill et al., 2005), but less information is available on the corrosion properties of metals used for neural recording applications.
Tungsten is commonly used for recording sites on intracortical microelectrode arrays. Commercial microelectrode arrays, as well as many noncommercial arrays, are made with tungsten microwires (Williams et al., 1999; Carmena et al., 2003; Chapin et al., 1999; Patrick et al., 2008). The strength, rigidity, and recording properties of tungsten electrodes formed from 50 µm diameter microwires make them desirable for intracortical applications. The microwires can be inserted into neural tissue without buckling and are easily manipulated into arrays. However, tungsten is not impervious to corrosion. Corrosion of tungsten via-plugs has been found to be a failure mechanism for microelectronic integrated circuits (Bothra et al., 1999). Tungsten coils, due to their thrombo-genicity, had been used clinically to occlude unwanted vasculature and have since been taken off the market due to degradation of the coils (Peuster et al., 2003). Sanchez et al. (2006) found apparent modification of tungsten microwires by corrosion after four weeks of in vivo implantation. While corrosion-related effects are apparent for tungsten microwires used in neural recording applications, the nature of the electrochemical reactions are not known. For example, the formation of an oxide or the direct dissolution of tungsten are both possible outcomes of the corrosion process. Development of an understanding of the electrochemical reactions provides insight into the stability of tungsten microelectrodes for long-term in vivo recordings.
In addition to causing a potential for local toxicity due to diffusion of corrosion products into the cortex, corrosion of the tungsten electrodes may impede successful long-term recording. It has been shown that a microelectrode must be placed less than 200 µm from the cell body to record the action potential of a neuron (Henze et al., 2000). Over time, dissolution of the tungsten increases the distance between the recording surface and the neuron such that the action potential may become unmeasurable. Also, as the tungsten microwire dissolves, a hollow tube made of the insulation is formed. This tube may be subject to cellular build-up that would hinder the diffusion of ionic species and effectively increase the impedance at the electrode/electrolyte interface. The increased interface impedance would ultimately decrease the magnitude of the measured action potential. Moreover, the formation of a thick oxide could also increase the interface impedance and create a similar effect.
Although corrosion and anodic dissolution of tungsten are well documented for both acidic (Lillard et al., 1998; Anik, 2009; Anik and Osseo-Asare, 2002; Johnson and Wu, 1971) and basic environments (Kelsey, 1977; Anik and Osseo-Asare, 2002; Johnson and Wu, 1971), the rate and electrochemical mechanism of tungsten corrosion in biological solutions are not well documented. In a comprehensive study, Anik and Osseo-Asare (2002) showed that the dissolution of tungsten depends on specific system conditions such as potential and pH. One study used conditions similar to those seen by tungsten microwires in neural recording applications. Peuster et al. (2003) performed an in vitro assessment of the corrosion of tungsten coils in Ringer’s solution, a type of physiological saline solution, via weight loss measurements and concluded that one coil would dissolve in 6 years. Their analysis however, did not specify a corrosion rate in units of mass per area per time and thus cannot be used to estimate corrosion in other systems.
Therefore, a study that determines the corrosion mechanism and quantifies the corrosion rate for tungsten microelectrodes used in intracortical recording applications is needed. However, the measurement of a corrosion rate characteristic of an electrode in dynamic in vivo conditions and a controlled analysis of the electrochemical reactions taking place cannot be performed by the same experiment. The electrochemical analysis requires a tungsten electrode and reference electrode that are not suited for implantation. These experiments are most effectively preformed on the bench-top. Conversely, the dynamic composition of the extracellular fluid near an implanted electrode undergoing a foreign-body inflammatory response is challenging to simulate in bench-top experiments. Oxidizing species such as hydrogen peroxide, the superoxide anion, and the hydroxyl radical are produced by the reactive microglia during the inflammatory response (Burke and Lewis, 2002). Of these, only hydrogen peroxide is easily combined into a solution. Moreover, the absence of documented concentrations of the mentioned species and relative pH changes that may be associated with the inflammatory response make it difficult to model accurately the in vivo conditions.
The object of this work is to explore the stability of tungsten microelectrodes in a controlled bench-top study using physiological saline and physiological saline with hydrogen peroxide. The electrochemical behavior of tungsten microelectrodes are compared to the behavior of platinum microelectrodes, which are also widely used for neural recording applications and considered inert for such applications (de Haro et al., 2002; Kipke, 2003; Maynard et al., 1997). The goal is to provide physical understanding of the corrosion of tungsten microelectrodes in saline-based, bench-top environments that can help explain observations made in vivo.
2 Experimental Methods
This section provides a description of the materials and electrochemical instrumentation used. The principal electrochemical technique employed was Electrochemical Impedance Spectroscopy (EIS). Electrochemical impedance spectroscopy is an experimental technique in which sinusoidal modulation of an input signal is used to obtain the transfer function for an electrochemical system (Orazem and Tribollet, 2008). In its usual application, the modulated input is potential, the measured response is current, and the transfer function is represented as an impedance. The impedance is obtained at different modulation frequencies, thus invoking the term spectroscopy. Through use of system-specific models, the impedance response can be interpreted in terms of kinetic and transport parameters. Frateur et al. (1999), for example, show how impedance spectroscopy can be used to determine the corrosion rate for cast iron pipes used in France for water distribution. Impedance spectroscopy is a powerful and sensitive in-situ technique, and it was used here to explore the sensitivity of electrode materials to corrosion reactions.
2.1 Materials
Microelectrodes approximating disc electrodes with a semi-infinite insulation layer and well-defined surface areas were fabricated and used as the working electrode in the EIS measurements. For electrochemical characterization of the metal-to-electrolyte interface, an electrode surface with a well-defined surface area and a perfect seal between electrode and insulation is needed. Artifacts caused by imperfect insulation seals confound interpretation of electrochemical phenomena at the interface, and exposed sidewalls affect the accuracy of the estimation of the surface area needed for calculation of the corrosion rate. Thus, the electrodes made for EIS differ from the electrodes typically used in vivo. The EIS electrodes were made with tungsten or platinum wires encased in glass or epoxy. The glass insulation process was performed by placing the wires in borosilicate glass tubes and heating the structure in a furnace at a temperature (800°C) that softens the glass. Electrodes insulated in epoxy were made by placing the microwire in a glass tube and filling the tube with epoxy resin (Epo-tek 302-3M). With glass or epoxy sealed tightly around the wire, one end-face was polished with SiC sandpapers resulting in a final roughness of 1 µm and the other end was secured to a gold connector with silver epoxy (Ablebond 84-1LMI). The polishing process, used in the present work to ensure an accurate assessment of the surface area, is not performed on tungsten microwires typically used in vivo. Working electrodes were made using 50 µm diameter gold-plated tungsten, tungsten, or platinum microwires (California Fine Wire). The gold-plated tungsten and platinum working electrodes were insulated with glass, and the tungsten-only electrode was insulated in epoxy. Glass or epoxy insulation was chosen for ease of fabrication. Each has sufficient insulating characteristics.
Many (3–20) replicates of each electrode type were used in this study. However, because of the sensitivity of the EIS results to electrodes with an imperfect insulation seal, many of the data were not used for the calculation of the corrosion rate. The impedance results reported in the present work are those determined by a new impedance technique (Patrick, 2010) to have a good seal between the insulator and the electrode. All electrodes of the same type showed a similar impedance trend.
The electrolytes chosen were 0.9% phosphate buffered saline (PBS) and phosphate buffered saline with H2O2 added to simulate one byproduct of an inflammatory response. Since H2O2 is produced by reactive microglia that surround the implanted microwire (Burke and Lewis, 2002), local concentrations are difficult to estimate. Pan et al. (1996) and Fonesca and Barbosa (2001) used hydrogen peroxide and PBS to assess corrosion of titanium for structural implant materials. They used concentrations that ranged from 10 mM to 100 mM. A conservative concentration of 30 mM H2O2 was chosen for this study. A salt mixture (Sigma P-5368) was used to make the PBS with composition given in Table 1 and pH of 7.4.
Table 1.
Composition of Phosphate Buffered Saline (PBS)
| Chemical Compounds | Concentration (M) |
|---|---|
| NaCl | 0.138 |
| HCl | 0.0027 |
| Na2HPO4 | 0.01 |
| KH2PO4 | 0.00176 |
| *H2O2 | 0.03 |
Concentration of H2O2 for electrolyte including PBS and H2O2
2.2 Instrumentation
Electrochemical impedance spectroscopy measurements were performed under potentiostatic control using a Gamry 300 G series potentiostat/glavanostat. Cyclic voltammetry was also performed with the Gamry system with voltage sweep rates of 50 and 100 mV/s. A silver/silver chloride reference electrode (BioAnalytical Systems RE-5B) was used in this study. A large-area Pt counterelectrode was used for measurements in PBS electrolyte. A large-area titanium counterelectrode was used for the experiments in electrolytes containing H2O2 because Pt was shown to be reactive with hydrogen peroxide. The EIS perturbation voltage amplitude was 10 mV. The frequency range for all experiments was 0.1 Hz to 20 kHz, and all measurements were taken at the open circuit potential (OCP). The low-frequency value of 0.1 Hz was chosen to limit the influence of nonstationary behavior, and the high-frequency value of 20 kHz was the largest frequency found to have minimal influence of instrumental artifacts. The resulting frequency range was sufficient to characterize the reaction and transport processes associated with the electrochemical reactions. The microelectrodes were polished and thoroughly rinsed in deionized water immediately prior to immersion in the electrolyte. An elapsed period of 5 minutes allowed the OCP to stabilize before the impedance measurements were taken.
3 Experimental Results
Impedance spectroscopy was used to identify potential electrochemical reactions for the microelectrodes in simulated body fluids. The conclusions drawn from the impedance results were supported by optical photographs, thermodynamic analysis, and comparison to in vivo results.
3.1 Impedance Response in PBS
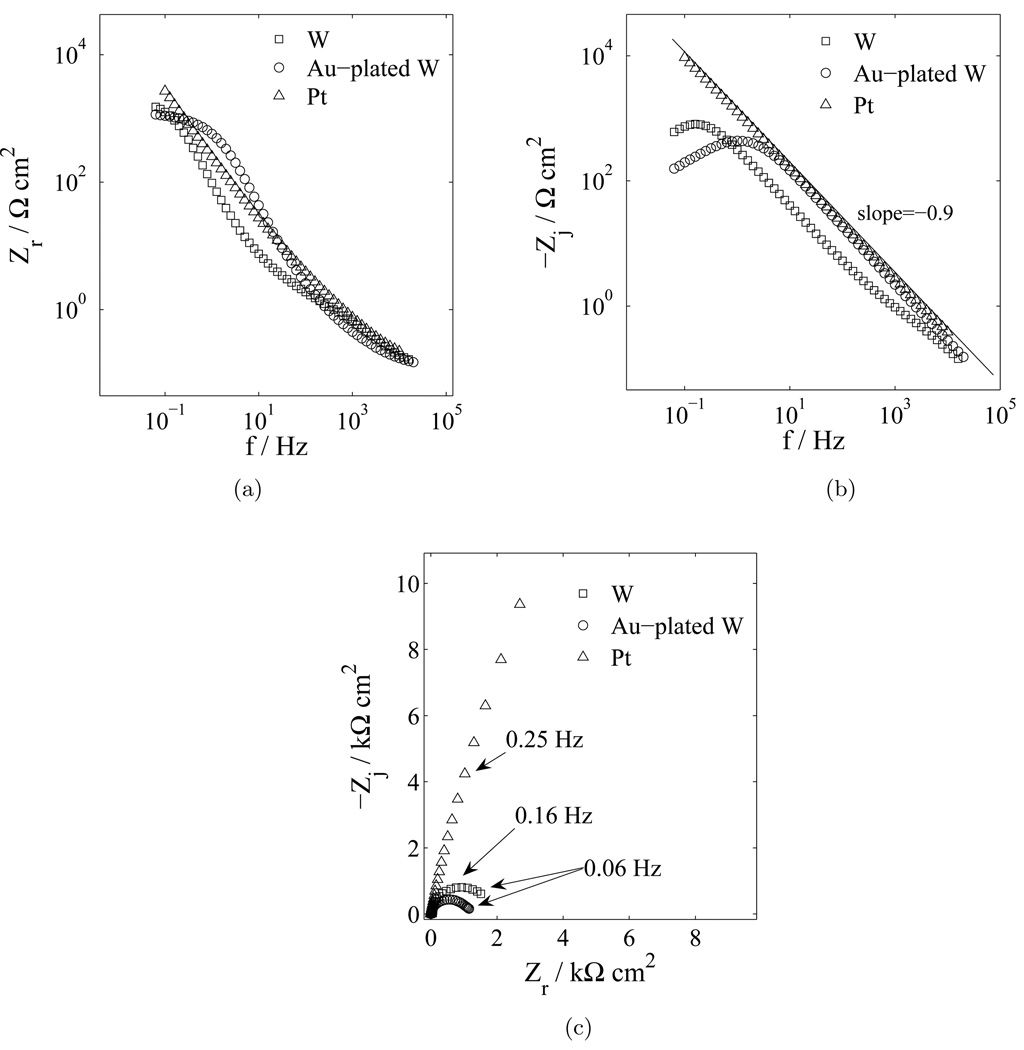
The impedance response obtained for platinum and tungsten microelectrodes immersed in PBS is presented in Figure 1. The results obtained for the three electrode materials are not easily differentiated in plots of real impedance as a function of frequency, as shown in Figure 1(a). In contrast, significant differences are apparent in plots of the logarithm of the imaginary impedance as a function of frequency, Figure 1(b), and Nyquist plots, Figure 1(c). While the plot of the real impedance as a function of frequency is presented in Figure 1 for completeness, similar plots are not presented for other experimental systems due to the lack of sensitivity to experimental condition.
Figure 1.
Impedance response in PBS with electrode material as a parameter: a) real part of the impedance as a function of frequency; (b) imaginary part of the impedance as a function of frequency; and c) complex impedance plane (Nyquist) plot.
The impedance response for the platinum electrode is seen as a straight line in Figure 1(b) and in Figure 1(c). This response is characteristic of a blocking or nonreactive electrode. The line passing through platinum impedance data presented as the logarithmic plot of imaginary impedance as a function of frequency for the platinum, shown in Figure 1(b), has a slope equal to −0.9. This result is consistent with constant-phase-element (CPE) distributed-time-constant behavior. All electrodes showed similar (CPE) behavior as indicated by the slopes of the imaginary impedance as a function of frequency differing from negative one (Orazem et al., 2006) in Figure 1(b). The finite value of impedance observed in Figure 1(c) at low frequencies for the tungsten microelectrodes suggests the presence of faradaic reactions.
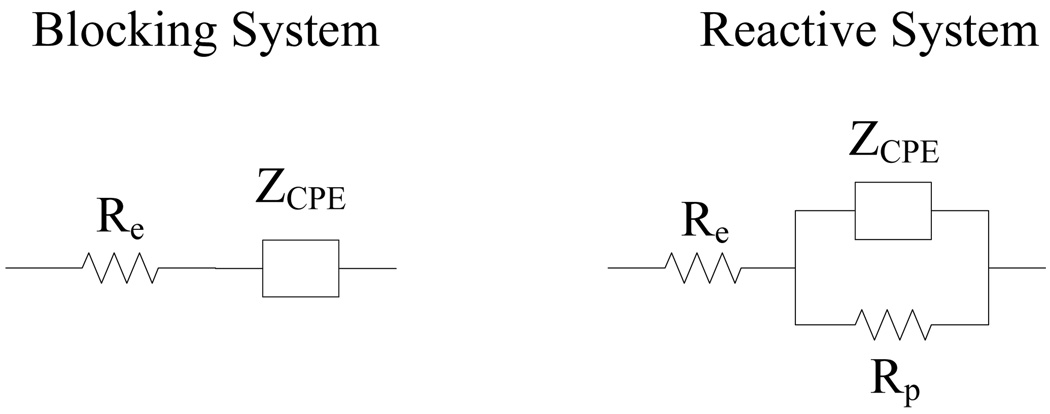
The blocking and reactive systems can be modeled with a resistor, Re, in series with a constant phase element, ZCPE, or the parallel combination of a resistor, Rp, and constant phase element, respectively, as shown in Figure 2 (see, e.g., Orazem and Tribollet (2008)) where Re is the resistance of the electrolyte, Rp is the polarization resistance, and ZCPE is the constant phase element impedance given by
| (1) |
where ω is the frequency, α is a number from 0 to 1, and Q is the CPE coefficient with units sα/Ωcm2 (Brug et al., 1984). As discussed by Orazem et al. (2006), the high-frequency slopes of the lines presented in Figure 1(b) are equal to −α. When α = 1, the parameter Q is the double-layer or interfacial capacitance.
Figure 2.
Equivalent circuits for blocking and reactive electrochemical systems (see, e.g., Orazem and Tribollet (2008)).
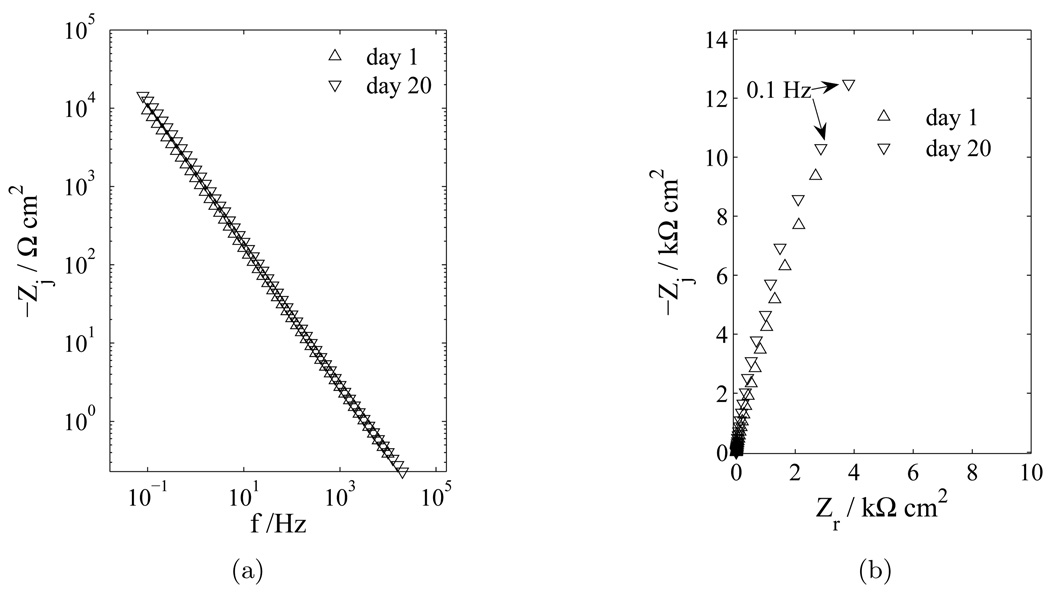
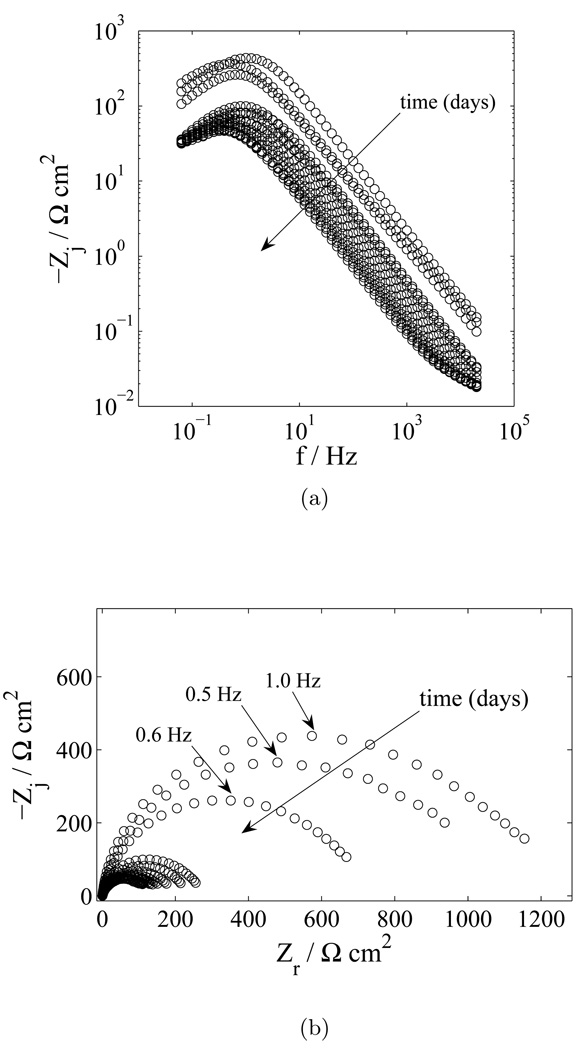
Impedance measurements taken after long periods of immersion in the electrolyte illustrate the nonreactive nature of platinum and give insight into the reactive nature of the tungsten electrode. Impedance spectra for platinum microelectrodes, presented in Figure 3 with elapsed time as a parameter show that, after 20 days in the PBS electrolyte, the platinum still exhibits blocking, or nonreactive, behavior. In contrast, the impedance results for a gold-plated tungsten microelectrode in PBS electrolyte presented in Figure 4 with elapsed time as a parameter show a decrease in polarization resistance over a period of 15 days. The influence of time for the impedance response of the pure tungsten electrode was similar to that shown for the gold-clad tungsten in Figure Figure 4, and, at each comparable time, the impedance of the pure tungsten was always larger than that of the gold-clad tungsten.
Figure 3.
Impedance response of a platinum electrode in PBS with elapsed time as a parameter: a) imaginary part of the impedance as a function of frequency; and b) complex impedance plane (Nyquist) plot.
Figure 4.
Impedance response of gold-plated tungsten electrodes in PBS over a 15 day period with elapsed time as a parameter: (a imaginary part of the impedance as a function of frequency; and b) complex impedance plane (Nyquist) plot.
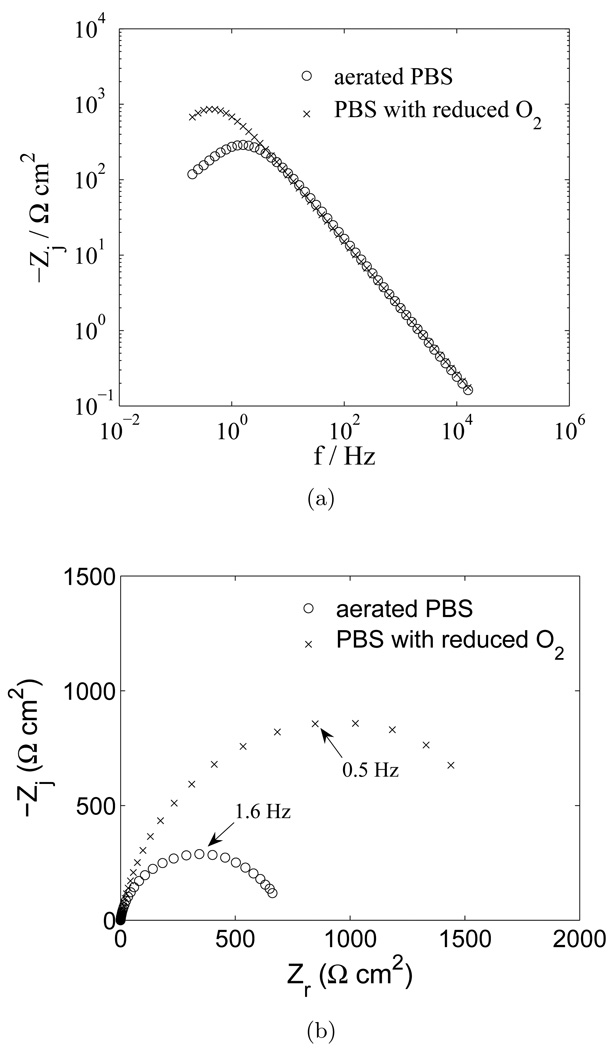
Under open circuit conditions, the net current is equal to zero, and anodic faradaic reactions, if present, must be balanced by one or more cathodic reactions. The dominant cathodic reaction on the tungsten electrode was found by testing the system reactivity to the oxygen concentration. Impedance results showing the dependence of the faradaic reaction to the concentration of oxygen are presented in Figure 5. The concentration of oxygen was decreased by bubbling N2 into the solution. After one hour of O2 displacement by nitrogen bubbling, the EIS results show that the polarization resistance increased with decreased O2 content. These results suggest that the reduction of oxygen was the rate-limiting cathodic reaction at the electrode surface.
Figure 5.
Impedance response of a tungsten electrode in PBS with O2 content as a parameter: a) imaginary part of the impedance as a function of frequency; and b) complex impedance plane (Nyquist) plot.
3.2 Impedance Response in PBS with 30 mM H2O2
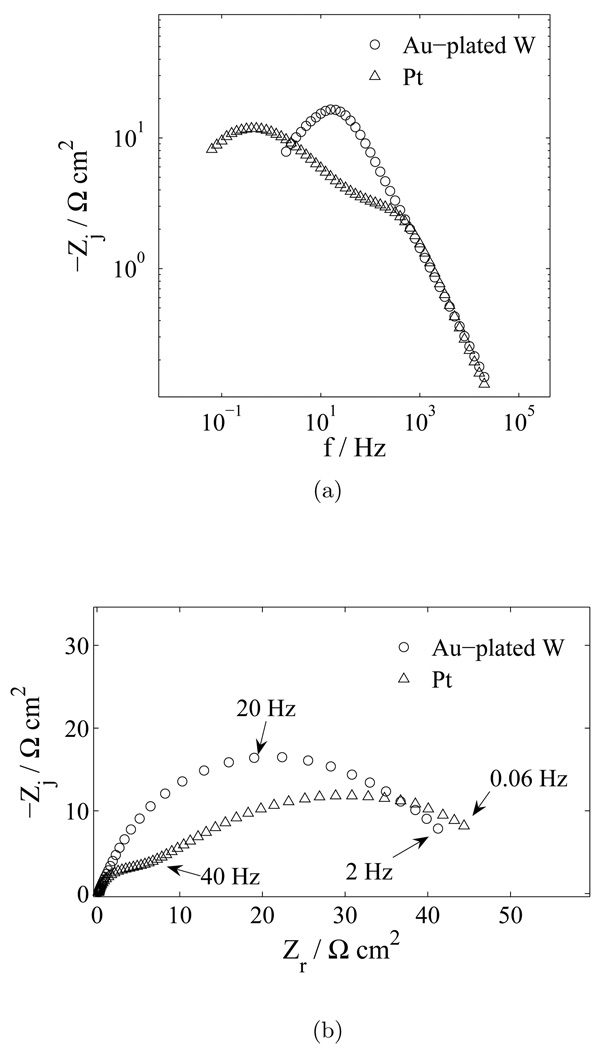
The oxidizing effect of H2O2 allows another cathodic pathway for charge transfer via the reduction of H2O2. EIS results were again used to experimentally ascertain the presence of a faradaic reaction on both platinum and gold-plated tungsten electrodes. The impedance response for platinum and gold-plated tungsten electrodes in an electrolyte containing PBS and H2O2 is presented in Figure 6. The tendency toward a finite impedance at low frequencies indicates that faradaic reactions occurred on both the gold-plated tungsten and platinum electrodes when H2O2 was present. The impedance response of the platinum electrode is more complex and cannot be modeled by the equivalent circuit for a simple reactive system illustrated in Figure 2; however, the complete model of the platinum electrochemical reaction is not the focus of this work and more detail on its impedance response can be found elsewhere (Yoo et al., 2009). The main result is that both platinum and tungsten systems show faradaic behavior at low frequencies.
Figure 6.
Impedance response in an electrolyte containing PBS and H2O2 with electrode material as a parameter: a) imaginary part of the impedance as a function of frequency; and b) complex impedance plane (Nyquist) plot.
3.3 Photographic Evidence for Tungsten Corrosion
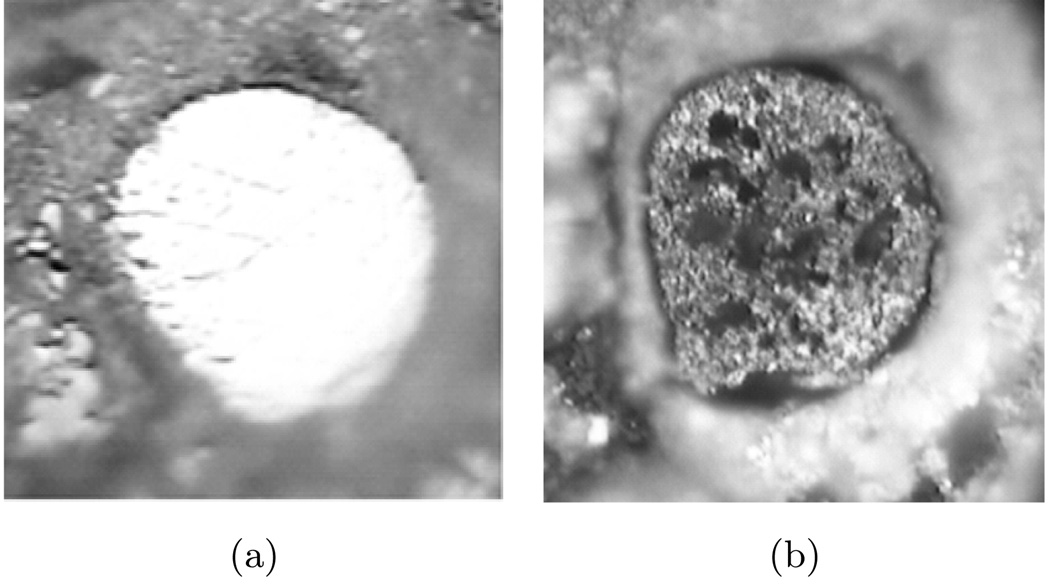
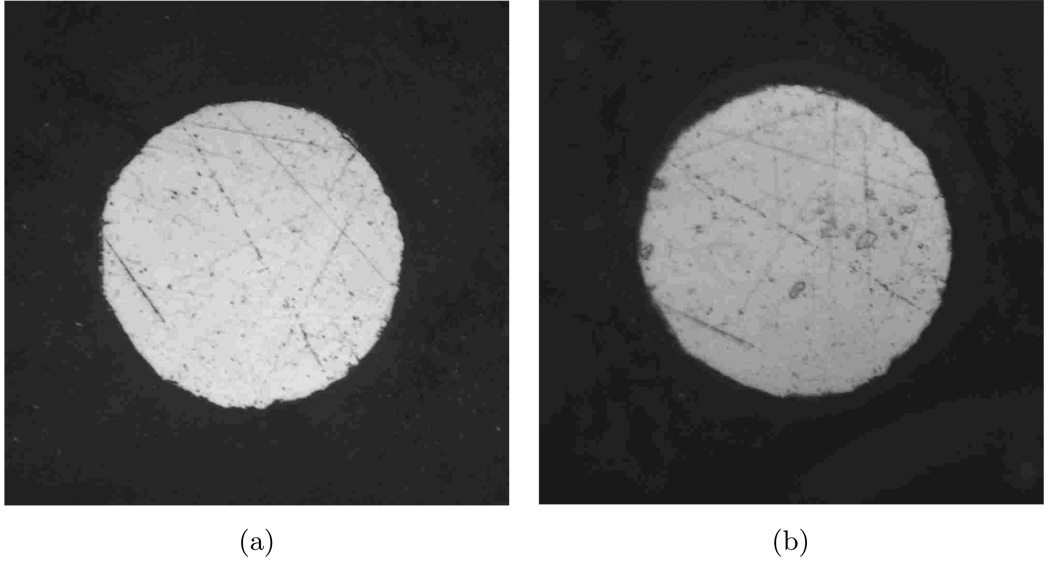
An optical photograph of the polished surface of a tungsten electrode before immersion in PBS is presented in Figure 7(a). The image presented in Figure 7(b) was taken after immersion in PBS for 23 days. The electrode is covered by a porous layer and is visibly roughened.
Figure 7.
Optical photographs of a tungsten electrode (a) before and (b) after immersion in PBS for 23 days. The nominal diameter of the electrode is 50 µm.
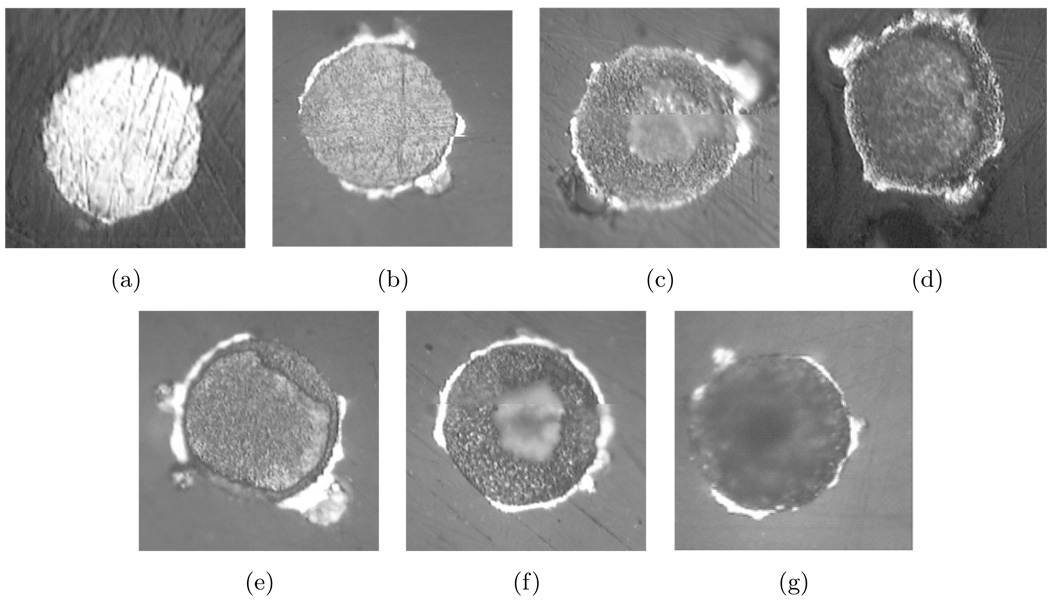
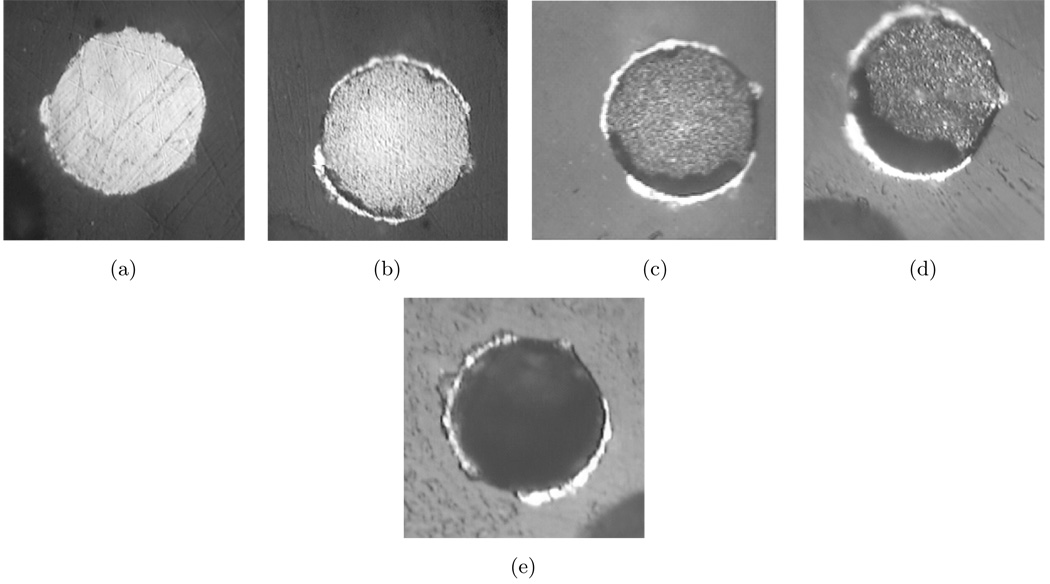
Optical photographs in Figure 8 reveal the condition of six different gold-plated tungsten electrodes before and after immersion in PBS from one to six days. A photograph of an electrode surface characteristic of the condition of all the electrodes before immersion is shown in Figure 8(a). After one day in saline, the surface looked roughened as compared to the previous state. For the electrode immersed for two days in PBS, manipulation of the depth of field revealed a circular section in the center of the electrode that was depressed from the surface by approximately 0.5 µm. This circular region is out of focus in the photograph. A similar trend was seen for the other electrodes left in PBS for longer periods. Each image displays a circular depression in the center of the electrode that grows deeper with time. For the electrode left in saline for five days, the center was depressed approximately 4 µm and was covered by a porous layer. The image of the electrode left in PBS for six days shows that the entire tungsten surface was recessed from the polished surface with the center being even more depressed. These photographs suggest that the gold-plated tungsten electrodes experienced general rather than pitting corrosion. An oxide layer is not apparent in the photographs.
Figure 8.
Optical photographs of gold-plated tungsten electrodes (a) before and after immersion in PBS for (b) one day, (c) two days, (d) three days, (e) four days,(f) five days, (g) and six days. The nominal diameter of each electrode is 50 µm.
Optical photographs of the surface of one gold-plated tungsten electrode immersed in PBS and 30 mM H2O2 are shown in Figure 9 for an elapsed time extending to 24 hours. After one hour in the electrolyte, recesses were seen around the edges of the gold-tungsten interface and the tungsten surface was roughened. The recesses on the perimeter of the electrode are expected for a primary or secondary current distribution, where, due to the disk geometry, the current density is the highest at the perimeter (Newman, 2004). As time progressed, the recesses expanded inward to the center of the electrode and after 24 hours, the bulk of the tungsten was depressed on the order of 10 µm below the original surface. These photographs suggest a much higher corrosion rate for gold-plated tungsten in saline solutions containing H2O2 than was seen for the other two cases without H2O2. These photographs also show no evidence of an oxide layer.
Figure 9.
Optical photographs of a gold-plated tungsten electrodes (a) before and after immersion in an electrolyte containing PBS and 30 mM H2O2 for (b) one hour, (c) two hours, (d) three hours, and (e) 23 hours. The nominal diameter of the electrode is 50 µm.
The comparative stability of the platinum electrode is evident from images taken before immersion and after 14 days of immersion in PBS, as shown in Figure 10. No difference is evident between the photographs taken before and after immersion.
Figure 10.
Optical photographs of a platinum electrode (a) before and (b) after immersion in PBS for 14 days. The nominal diameter of the electrode is 50 µm.
The in vitro results presented here are consistent with scanning electron microscope (SEM) images presented in Figure 11 of gold-plated tungsten microelectrodes, insulated with polyimide and used for in vivo neuronal recording in another study (Patrick et al., 2010). All the steps involved with the animal were approved by the University of Florida IACUC (Institutional Animal Care and Use Committee). The electrode array was inserted using a stereotaxic positioner into a craniotomy located (+1 mm anterior to bregma, 2.5 mm lateral) in an adult male Sprague-Dawley rat (Patrick et al., 2010). The images presented in Figure 11 shows the tungsten microwires used in the intracortical microelectrode array before and after 87 days implantation. Images labeled a and b show electrode surfaces (cross section of the insulated wires) after they have been cut with a dicing saw prior to implantation. The microwires typically have a sub-micron layer of gold on the outside surface of the tungsten wires, beneath the polyimide insulation, to facilitate soldering of the wire to the connecting substrate. Though not easily seen in the SEM images, a thin ring of gold between the polyimide and tungsten is exposed to the biological environment. Image c shows the changed state of the tungsten wire after 87 days in vivo. The inset in c highlights the area of gold exposed to the tissue. Notable differences between the before and after images include a larger area of gold exposed in the after state as well as a swelling of the polyimide insulation and the presence of a film on the surface of the electrode.
Figure 11.
SEM images of tungsten micro-wires: a) and b) typical electrodes before implantation; and c) typical electrodes after implantation in vivo for 87 days (Patrick et al., 2010). The inset in (c) highlights the area of gold exposed to the tissue. The scale bar in (a) and (c) is 100 µm. The scale bar in (b) is 50 µm.
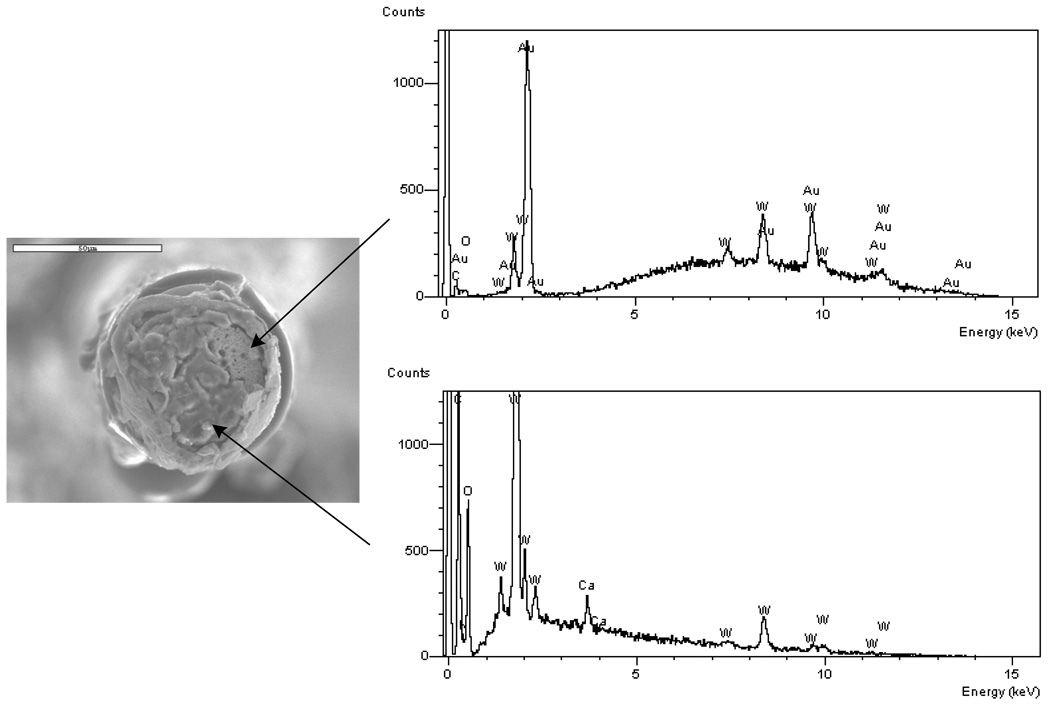
Energy-dispersive X-ray spectroscopy (EDS) results for two exposed regions on the electrode surface are presented in Figure 12. The top EDS result is characteristic of a bare tungsten surface. The bottom EDS result is characteristic of a bio-film that is rich in carbon, oxygen, and nitrogen. Thus, it is assumed that part of the bio-film became dislodged on the top right portion of the electrode and is exposing the tungsten surface. The SEM image shows that the tungsten is recessed within the gold plating and the structure of the tungsten surface has changed from smooth to rough, similar to the general trend with the tungsten electrodes in the bench-top study. To quantify how far the tungsten surface was recessed with the gold plating and insulation, three wires from the implanted array were cleaned in a dilute solution of bleach (sodium hypochlorite) until the adherent bio-film was removed. A single rinsing operation was found to be sufficient to remove the biofilm. Inspection under an optical microscope was used to confirm that the bio-film was removed by this procedure. The distance from the top surface of the existing gold plating and polyimide insulation to the tungsten was measured by manipulation of the focal length of an optical microscope. The optical microscope was equipped with digital readout (Quadra-Chek 200) and the precision of this measurement was estimated to be within 1 µm. In three of the electrodes in the array, the average distance that the tungsten surface was recessed within the gold plating was measured to be 24±8µm.
Figure 12.
EDS results for two sites on one electrode after implantation in vivo for 87 days. The results are characteristic of a bare tungsten and gold surface (top graph) and of a bio-film (bottom graph). The scale bar in the photograph is 50 µm.
4 Analysis and Discussion
This section analyzes faradaic reactions occurring on the electrodes and discusses their implications on in vivo applications. Analysis using Pourbaix diagrams provides information on possible electrochemical reactions. The Pourbaix diagram shows the potential at which chemical and electrochemical reactions may occur on an electrode surface in a specific electrolyte as a function of pH (Pourbaix, 1966). The thermodynamic stability of chemical species at various potential and pH ranges may be ascertained from the diagram. The Pourbaix diagrams shown in this study are generated by a computer program (CorrosionAnalyzer 1.3 Revision 1.3.33 by OLI Systems Inc), which uses a publicly available database that takes into account nonidealities not found in Pourbaix (1966).
4.1 Thermodynamic Analysis of Electrochemical Reactions on Tungsten
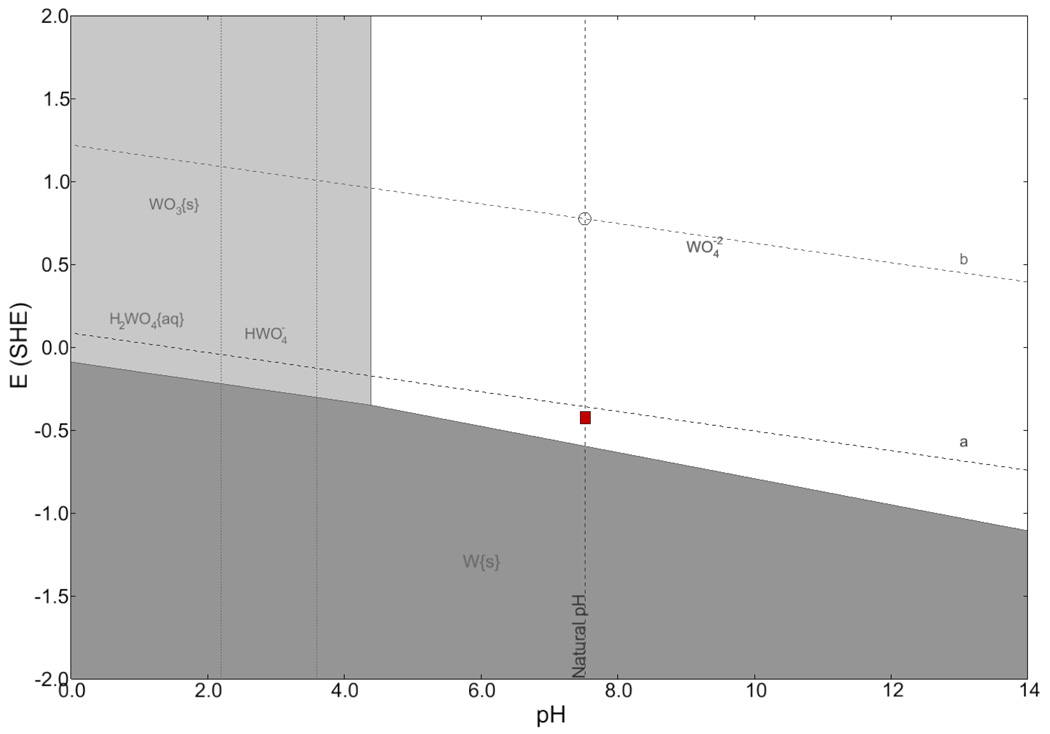
A thermodynamic analysis of the stability of tungsten in PBS is given in Figure 13 in the form of a Pourbaix diagram, generated by a computer program (CorrosionAnalyzer 1.3 Revision 1.3.33 by OLI Systems Inc). Theoretical calculations based on the Nernst equation for different chemical species at room temperature were used to generate the lines on the diagram (Pourbaix, 1966). The diagonal lines labeled a and b correspond to the limits of the stability of water. Above line a, oxidation of water (i.e., oxygen evolution) is possible and below line b, reduction of water (i.e., hydrogen evolution) is possible. Between those lines, water is stable. The vertical dashed line gives the natural pH of the electrolyte as 7.4. The shaded regions designate states of passivation (WO3(s)), immunity (W(s)), and corrosion . The box shows the range of the experimentally measured values of the open-circuit potential for a gold-plated tungsten electrode in PBS over a period of 15 days. A list of all chemical species considered in the formation of the Pourbaix diagram is given in Table 2. The diagram shows that the tungstic ion is stable at the open-circuit potential and that corrosion reactions are possible in this system since the box is in the white area. The overall anodic electrochemical reaction producing the tungstic ion is given by (Kelsey, 1977; Pourbaix, 1966).
| (2) |
Possible cathodic reactions are reduction of water and oxygen given by
| (3) |
and
| (4) |
The strong effect of electrolyte oxygen content seen in Figure 5 suggests that the reduction of oxygen is the dominant cathodic reaction, given by reaction (3).
Figure 13.
Pourbaix diagram for tungsten in PBS. The box shows range of open circuit potential measured over a period of 15 days. The diagrams were generated by CorrosionAnalyzer 1.3 Revision 1.3.33 by OLI Systems Inc.
Table 2.
Species considered in the calculation of the Pourbaix diagram presented as Figure 13. The list of species was generated by CorrosionAnalyzer 1.3 Revision 1.3.33 by OLI Systems Inc.
| Aqueous Phase | Solid Phase | Vapor Phase |
|---|---|---|
| Water | Pentasodium triphosphorous decaoxide | Water |
| Chloride ion(−1) | Pentasodium triphosphorous decaoxide hexahydrate | Hydrogen |
| Dihydrogen orthophosphate(V) ion(−1) | Phosphorus pentoxide (dimer) | Hydrogen chloride |
| Dihydrogen pyrophosphate(V) ion(−2) | Potassium chloride | Oxygen |
| Hydrogen | Potassium dihydrogen orthophosphate(V) | |
| Hydrogen chloride | Potassium hydrogen orthophosphate(V) hexahydrate | |
| Hydrogen ion(+1) | Potassium hydrogen orthophosphate(V) trihydrate | |
| Hydrogen orthophosphate(V) ion (−2) | Potassium hydrogen phosphate(V) | |
| Hydrogen pyrophosphate(V) ion(−3) | Potassium hydroxide | |
| Hydrogen tungstate(VI) ion(−1) | Potassium hydroxide dihydrate | |
| Hydroxide ion(−1) | Potassium hydroxide monohydrate | |
| Orthophosphoric acid | Potassium orthophosphate(V) | |
| Oxygen | Potassium orthophosphate(V) heptahydrate | |
| Phosphate ion(−3) | Potassium orthophosphate(V) trihydrate | |
| Potassium chloride | Potassium tungstate(VI) | |
| Potassium ion(+1) | Sodium chloride | |
| Pyrophosphate ion(−4) | Sodium dihydrogen orthophosphate dihydrate | |
| Pyrophosphoric(V) acid | Sodium dihydrogen orthophosphate monohydrate | |
| Sodium ion(+1) | Sodium dihydrogen orthoporthohosphate | |
| Trihydrogen pyrophosphate(V) ion(−1) | Sodium hydrogen orthophosphate | |
| Tungsten(VI) tetraoxide ion(−2) | Sodium hydrogen orthophosphate dihydrate | |
| Tungstic(VI) acid | Sodium hydrogen orthophosphate dodecahydrate | |
| Sodium hydrogen orthophosphate heptahydrate | ||
| Sodium hydroxide | ||
| Sodium hydroxide monohydrate | ||
| Sodium orthohosphate | ||
| Sodium orthophosphate hexahydrate | ||
| Sodium orthophosphate hydroxide dodecahydrate | ||
| Sodium orthophosphate monohydrate | ||
| Sodium orthophosphate octahydrate | ||
| Sodium pyrophosphate decahydrate | ||
| Sodium tungstate(VI) | ||
| Sodium tungstate(VI) dihydrate | ||
| Tungsten | ||
| Tungsten(VI) oxide | ||
Another possible chemical reaction is the dissolution of a tungsten oxide. Lillard et al. (1998) showed via surface-enhanced-Raman spectroscopy that tungsten exposed to air has a native oxide WO3. The Pourbaix diagram suggests that WO3 dissolves at the cell equilibrium potential (0.4 V vs. SHE) and pH as given by reaction (5).
| (5) |
Therefore, even if a native oxide layer exists initially on the tungsten surface that inhibits dissolution, eventually the oxide will dissolve and expose the tungsten surface.
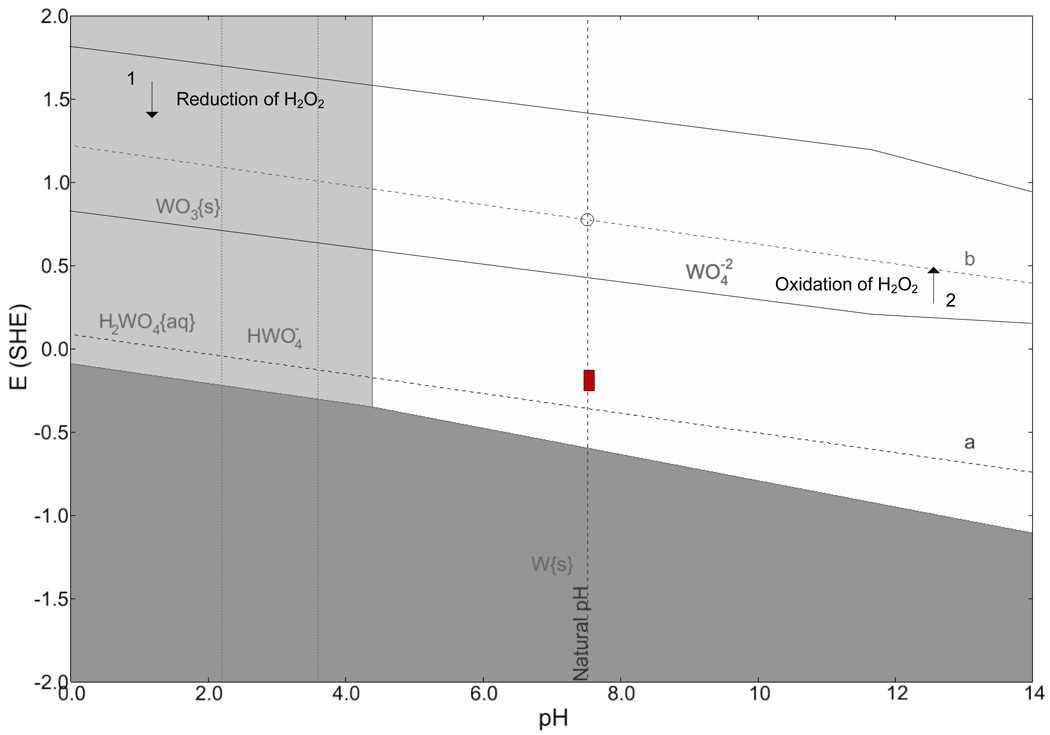
The addition of hydrogen peroxide to the PBS allows another cathodic reaction, the reduction of H2O2, to occur on the tungsten electrode surface. A Pourbaix diagram showing the OCP range for a gold-plated tungsten electrode in an electrolyte containing PBS and 30 mM of H2O2 is given in Figure 14. The chemical species considered for the Pourbaix diagram are the same as listed in Table 2 with the addition of H2O2. The regions of stability of H2O2 given by Pourbaix (Pourbaix, 1966) are overlayed on the diagram. Below the line labeled 1, reduction of H2O2 is possible and above line 2, oxidation of H2O2 is possible, e.g.,
| (6) |
Thus, for an electrochemical system containing a tungsten electrode in PBS and H2O2, the possible anodic reaction is given by reaction (2) and possible cathodic reactions are given by reaction (3) and reaction (6). This thermodynamic analysis at experimentally observed potentials suggests that the corrosion mechanism for tungsten is dissolution into the tungstic ion and not the formation of a stable metal oxide. This result supports the experimental results of Figures 7–11 which show the disappearance of tungsten from the surface of the electrodes over time.
Figure 14.
Pourbaix diagram for tungsten in an electrolyte containing PBS and 30 mM H2O2. The box shows the measured range of the open-circuit potential over a period of 2 days. The diagrams were generated by CorrosionAnalyzer 1.3 Revision 1.3.33 by OLI Systems Inc.
4.2 Gold-Tungsten Galvanic Couple
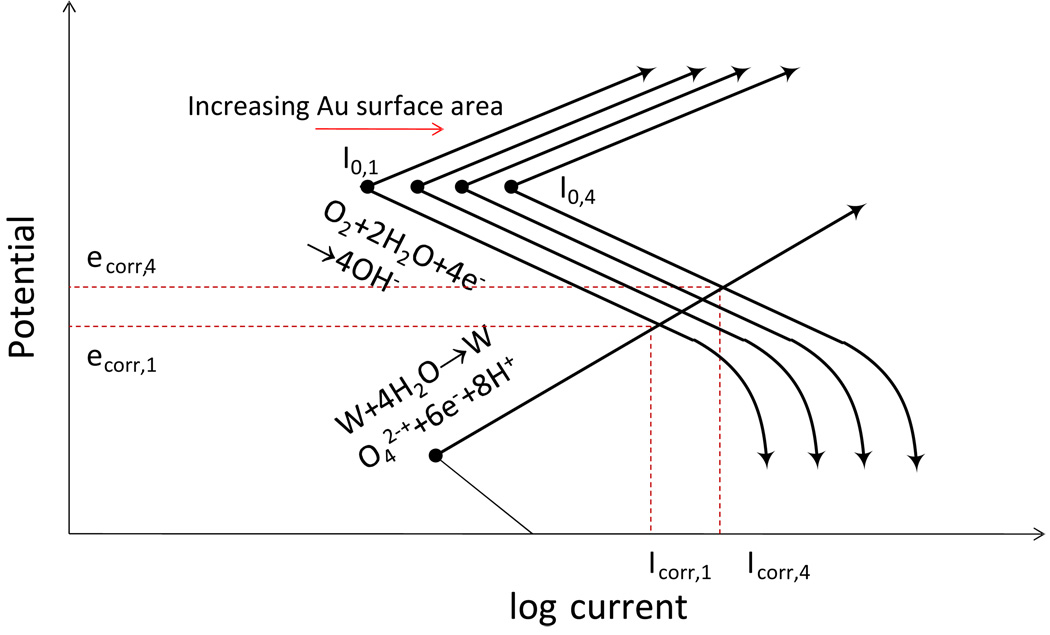
The gold-plated-tungsten electrode constitutes a galvanic couple, giving gold a significant role in the reactivity of the system. Gold is stable at the equilibrium potential and pH of the system (Pourbaix, 1966) and thus will not corrode. However, it provides a surface for the cathodic reaction and thereby increases the corrosion rate of the tungsten (Jones, 1992). As the tungsten dissolves, gold that was plated on the outer surface of the tungsten becomes further exposed. The surface area of the gold increases, thereby increasing the exchange current for the cathodic reaction, and consequently the anodic reaction rate must increase to compensate, since the net current at the open-circuit potential must be equal to zero.
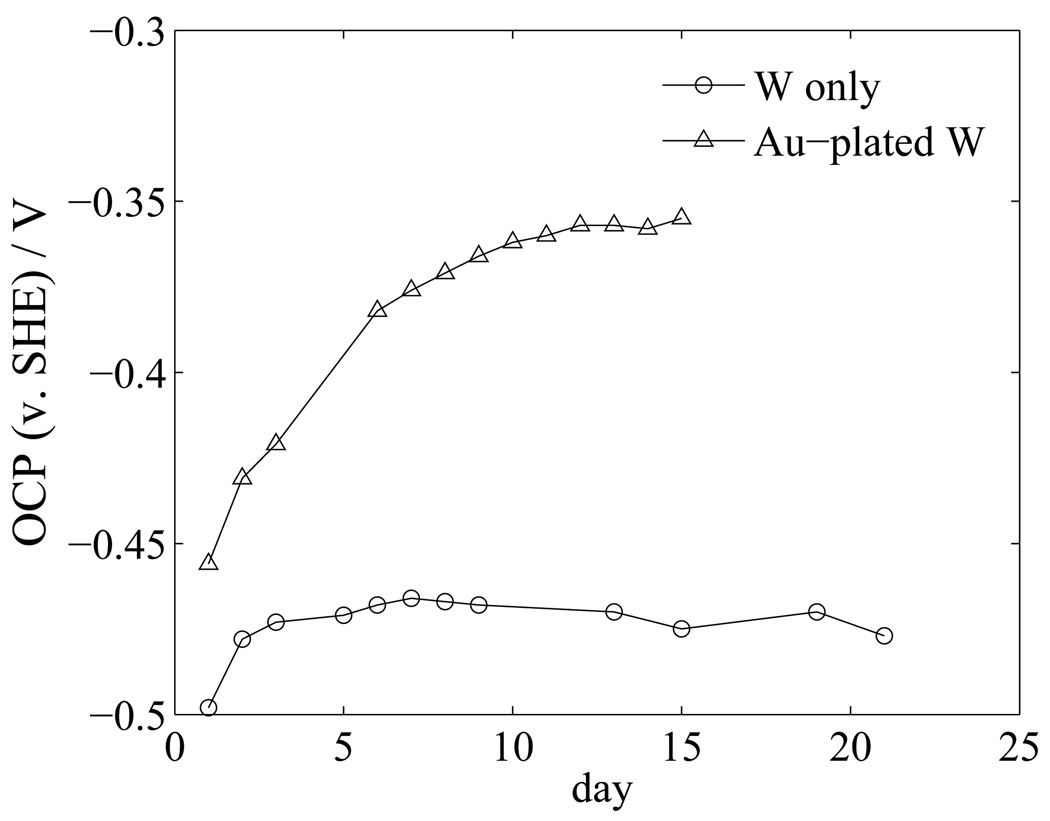
This process may be modeled using mixed potential theory. A diagram showing a proposed mixed potential theory is given in Figure 15. For simplicity, only the dominant reactions (reaction (2) and reaction (3)), are included. It is assumed that the oxidation reaction occurs only on the tungsten (anode), and the reduction reaction occurs only on the gold (cathode). As the cathodic current increases in response to the increasing cathode surface area for the reduction of oxygen, a larger corrosion current is established, as shown by the shift from Icorr,1 to Icorr,4. Under the assumption that the tungsten area is constant, the resulting corrosion rate for tungsten is increased, and the potential of the system increases to more noble values. This explanation is supported by observations of the open-circuit potential for the gold-plated tungsten electrodes and gold-free tungsten electrodes in PBS, shown in Figure 16 as functions of elapsed time. The gold-plated tungsten system shows a nonlinear trend toward more positive potentials; whereas, the gold-free tungsten system shows a more stable open-circuit potential after air-formed oxides are removed.
Figure 15.
Hypothetical Evans diagram for the gold-plated tungsten electrode showing the effect of increased cathode surface area on the galvanic interaction of tungsten and gold.
Figure 16.
Open-circuit potential as a function of elapsed time for gold-plated tungsten and tungsten electrodes in PBS electrolyte.
Two factors control the corrosion rate of tungsten in biological saline solutions. The rate of corrosion of tungsten is limited by the cathodic reaction. Moreover, the corrosion rate of the tungsten is increased by the gold-tungsten galvanic couple existing in microelectrodes used for intracortical applications.
4.3 Rate of Tungsten Corrosion
Since experimental results and thermodynamic analysis show that the mechanism of tungsten corrosion is dissolution to form tungstic ion, the corrosion rate can be calculated easily from the polarization resistance via the Stern-Geary equation (Stern and Geary, 1957; Jones, 1992)
| (7) |
where βa and βc are the anodic and cathodic Tafel constants, respectively, and icorr is the corrosion current density. (Stern and Geary, 1957; Jones, 1992). The polarization resistance may be estimated from the impedance data by subtracting the low frequency asymptotic value from the high frequency asymptotic value on a Nyquist plot. The corrosion current density is related to the corrosion rate by
| (8) |
where a is the atomic weight, n is the oxidation number, and F is Faraday’s constant. Equation 8 gives a corrosion rate in terms of mass loss per unit area per time and is divided by the density of the metal to obtain a corrosion penetration rate, e.g., µm/yr.
If the Tafel constants are not known, the corrosion rate may still be approximated. The Tafel constants range between 0.06 V and 0.12 V for βa and between 0.12 and infinity for βc (Jones, 1992). If the most extreme values are used, the corrosion rate varies by only a factor of two. These values are used for the calculation of the corrosion rate in this work.
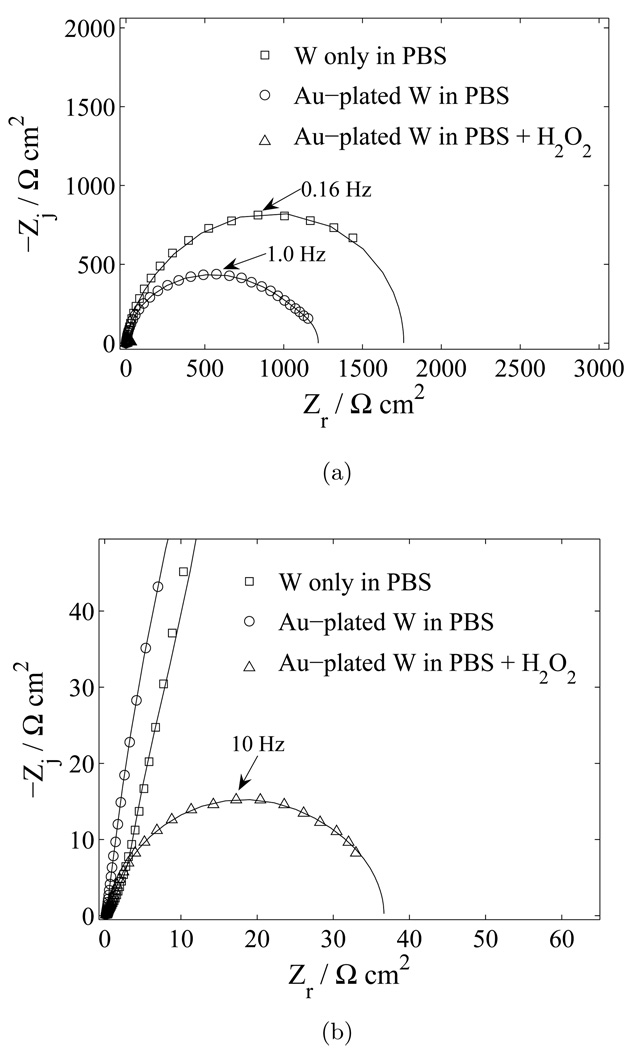
The corrosion rates of the three tungsten systems (tungsten in PBS, gold-plated tungsten in PBS, and gold-plated tungsten in PBS and 30 mM H2O2) were quantified by extrapolating the polarization resistance from EIS data. Complex nonlinear least squares regression was used to fit the experimental data to the measurement model given as (Orazem, 2004).
| (9) |
The measurement model consists of a resistor, R0, modeling the electrolyte resistance, in series with k Voigt elements, where a Voigt element is a capacitor in parallel with a resistor that has a characteristic time constant τk = 2π RC. Nyquist plots of the impedance response of the three systems are shown in Figure 17(a). All electrodes were polished immediately prior to submersion in the electrolyte. Impedance measurements were performed after a settling period of five minutes. The corresponding corrosion rate for each system was calculated from equation 8, and the results are given in Table 3. The impedance results predict that tungsten in aerated PBS will corrode at a rate of 200–500 µm/yr. The galvanic couple of the gold-plated tungsten microwire acts to increase the corrosion rate of the system in PBS alone to 300–700 µm/yr. However, the corrosion rates predicted for the gold-plated tungsten systems are for the initial electrode area; the rates could increase as more of the gold surface becomes exposed as described previously. The addition of 30 mM of hydrogen peroxide to the PBS significantly increases the corrosion rate of a gold-plated tungsten electrode to 10,000–20,000 µm/yr. Previous EIS results showed that the corrosion rates are limited by the cathodic reaction. Thus, the corrosion rates for each system are dependent on the concentrations of oxygen or hydrogen peroxide, respectively, and may also be controlled by diffusion of the species.
Figure 17.
Estimation of polarization resistance, Rp, for three tungsten systems. The lines represent the results of regression of a Voigt model, equation (9) to the data. A) complex impedance plane (Nyquist) plot with electrode material and electrolyte as a parameter; and b) enlarged section of (a) emphasizing the results for gold-plated tungsten in PBS with added H2O2.
Table 3.
Corrosion rates for tungsten estimated from the impedance response.
| System | Rp (MΩ cm2) | rcorr (µm/yr) |
|---|---|---|
| W in PBS | 1700 | 200 ≤ rcorr ≥ 500 |
| W/Au in PBS | 1200 | 300 ≤ rcorr ≥ 700 |
| W/Au in PBS + H2O2 | 40 | 10,000 ≤ rcorr ≥ 20,000 |
The bench-top results may be compared to the corrosion rate determined for the tungsten microelectrodes that were implanted in vivo. The average recession of the tungsten surface after an 87 day implant period of three different microelectrodes was 24 ± 8 µm yielding an estimated annual rate of 100 ± 33 µm/yr.
The corrosion rate results from the bench-top experiments correspond to a worst-case scenario for in vivo situations. The bench-top results showed that the corrosion rate is limited by the rate of the dominant cathodic reaction. Therefore, the concentration of the reactive species, O2 or H2O2, play a major role. The concentration of dissolved oxygen in the PBS used in the bench-top experiments is determined by the partial pressure of oxygen in the air (150 mmHg). In comparison, the partial pressure of oxygen in the extracellular fluid of the cortex is between 20 and 35 mmHg (Maas et al., 1993; Sarrafzadeh et al., 1998). Moreover, the elevated temperature in the biological environment decreases the solubility of oxygen, thus, further reducing the expected corrosion rate (Benson and Krause, 1984). Another factor that would reduce the corrosion rate in vivo is the presence of a bio-film. The biological film that forms on the electrode surface, seen in the SEM images of the implanted tungsten microwire (Figure 12), may act to impede diffusion of chemical species and effectively control the corrosion rate. It is anticipated, therefore, that the in vivo corrosion rate will change with time due to the dynamic nature of the wound healing and persistent foreign-body immune responses and growth of biofilms.
The bench-top results suggest that dissolution of tungsten is the corrosion mechanism in vivo. The Pourbaix diagrams generated for the bench-top study show that tungsten dissolution into the tungstic ion persists over a wide range of pH. Thus, even if the immune response increases the local pH of the extracellular fluid, such a change in pH is not expected to change the corrosion mechanism.
Tungsten microelectrodes have been used in chronic experiments in the past with mixed results. The influence of tungsten electrode corrosion on recording performance, though an important question, is convoluted with many other factors and is not the focus of this study. Successful recording performance is, in itself, not a proof that corrosion did not take place. The recording performance of the tungsten microelectrode array used in the present in vivo study did not diminish over a period of 42 days, in spite of the corrosion evident in Figure 12 (Patrick et al., 2010). An important point to note is that the tungsten electrodes had a gold layer on their perimeter that did not undergo corrosion and in effect stayed in place. Thus, even though the tungsten surface could have been moving away from a potential neuron, the conducting gold layer was not. In the study by Williams et. al. (Williams et al., 1999), four tungsten arrays (without gold plating) showed reliable recording performance for nine weeks or more, while four other arrays showed decreasing performance from week one to their termination date before nine weeks. Additional studies that couple the biotic and abiotic responses observed here and in vivo are required for unifying understanding of the mechanisms of electrode failure.
4.4 Thermodynamic Analysis of Electrochemical Reactions on Platinum
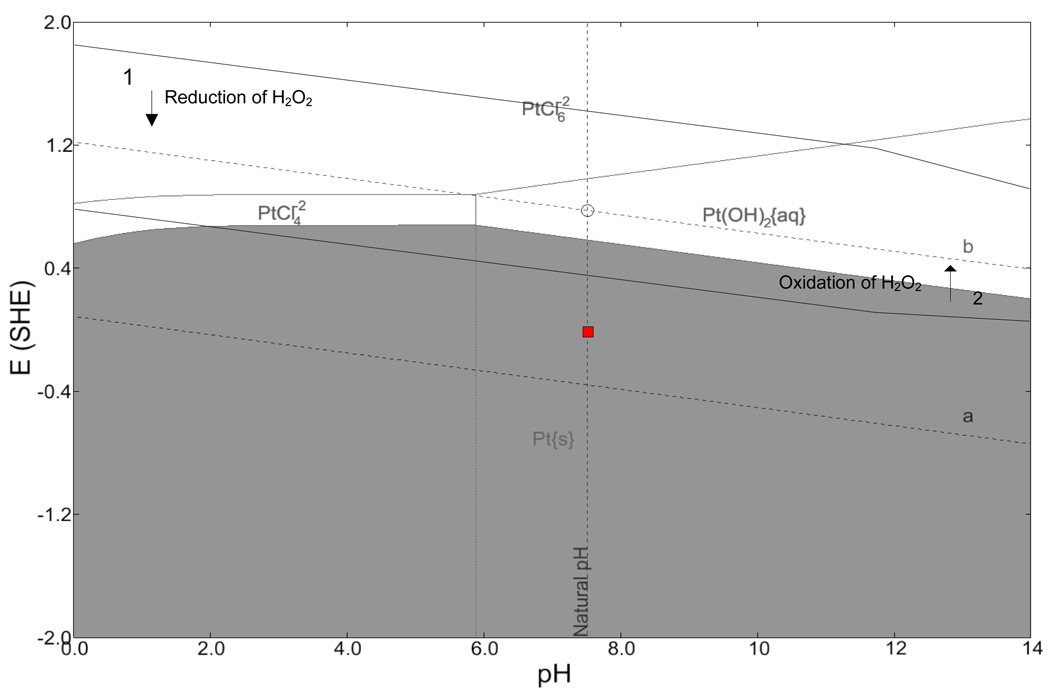
As shown in Figure 6, a faradaic reaction occurs on platinum electrodes in saline solutions containing hydrogen peroxide. It is important to know what electrochemical reactions could be occurring on the platinum electrode when implanted. A Pourbaix diagram considering the chemical species in Table 4 was generated for platinum in an electrolyte of PBS and 30 mM H2O2 and is shown in Figure 18. Curves representing the stability of H2O2 are superimposed on the Pourbaix diagram. At potentials below curve 1 the reduction of H2O2 is possible and above curve 2, the oxidation of H2O2 is possible (Pourbaix, 1966). In the region where the two reactions overlap, hydrogen peroxide may dissociate into water on a platinum surface. The box shows the range of measured open-circuit potential for three platinum electrodes. The Pourbaix diagram shows that reduction of H2O2 is a possible cathodic reaction in this system.
Table 4.
Species considered in the calculation of the Pourbaix diagram presented as Figure 18. The list of species was generated by CorrosionAnalyzer 1.3 Revision 1.3.33 by OLI Systems Inc.
| Aqueous Phase | Solid Phase | Vapor Phase |
|---|---|---|
| Water | Pentasodium triphosphorous decaoxide | Water |
| Chloride ion(−1) | Pentasodium triphosphorous decaoxide hexahydrate | Hydrogen |
| Dihydrogen orthophosphate(V) ion(−1) | Phosphorus pentoxide (dimer) | Hydrogen chloride |
| Dihydrogen pyrophosphate(V) ion(−2) | Platinum | Hydrogen peroxide |
| Hydrogen | Platinum(II) chloride | Oxygen |
| Hydrogen chloride | Platinum(II) hydroxide | |
| Hydrogen ion(+1) | Platinum(IV) chloride | |
| Hydrogen orthophosphate(V) ion (−2) | Potassium chloride | |
| Hydrogen peroxide | Potassium dihydrogen orthophosphate(V) | |
| Hydrogen peroxide ion(−1) | Potassium hydrogen orthophosphate(V) hexahydrate | |
| Hydrogen pyrophosphate(V) ion(−3) | Potassium hydrogen orthophosphate(V) trihydrate | |
| Hydroxide ion(−1) | Potassium hydrogen phosphate(V) | |
| Orthophosphoric acid | Potassium hydroxide | |
| Oxygen | Potassium hydroxide dihydrate | |
| Phosphate ion(−3) | Potassium hydroxide monohydrate | |
| Platinum ion(+2) | Potassium orthophosphate(V) | |
| Platinum ion(+4) | Potassium orthophosphate(V) heptahydrate | |
| Platinum(II) chloride | Potassium orthophosphate(V) trihydrate | |
| Platinum(II) hydroxide | Sodium chloride | |
| Platinum(II) monochloride ion(+1) | Sodium dihydrogen orthophosphate dihydrate | |
| Platinum(II) monohydroxide ion(+1) | Sodium dihydrogen orthophosphate monohydrate | |
| Platinum(II) tetrachloride ion(−2) | Sodium dihydrogen orthoporthohosphate | |
| Platinum(II) trichloride ion(−1) | Sodium hexachloroplatinate(IV) hexahydrate | |
| Platinum(IV) chloride | Sodium hydrogen orthophosphate | |
| Platinum(IV) dichloride ion(+2) | Sodium hydrogen orthophosphate dihydrate | |
| Platinum(IV) hexachloride ion(−2) | Sodium hydrogen orthophosphate dodecahydrate | |
| Platinum(IV) monochloride ion(+3) | Sodium hydrogen orthophosphate heptahydrate | |
| Platinum(IV) pentachloride ion(−1) | Sodium hydroxide | |
| Platinum(IV) trichloride ion(+1) | Sodium hydroxide monohydrate | |
| Potassium chloride | Sodium orthohosphate | |
| Potassium ion(+1) | Sodium orthophosphate hexahydrate | |
| Pyrophosphate ion(−4) | Sodium orthophosphate hydroxide dodecahydrate | |
| Pyrophosphoric(V) acid | Sodium orthophosphate monohydrate | |
| Sodium ion(+1) | Sodium orthophosphate octahydrate | |
| Trihydrogen pyrophosphate(V) ion(−1) | Sodium pyrophosphate decahydrate | |
Figure 18.
Pourbaix diagram for platinum in PBS with 30 mM hydrogen peroxide. The red box shows range of measured open circuit potential. The diagrams were generated by CorrosionAnalyzer 1.3 Revision 1.3.33 by OLI Systems Inc.
The Pourbaix diagram does not, however, suggest possible corresponding anodic reactions. Brummer and Turner (1977) propose hydrogen adsorption to be possible charge transfer pathways. The assumed anodic and cathodic reactions are given respectively by
| (10) |
and reaction (6).
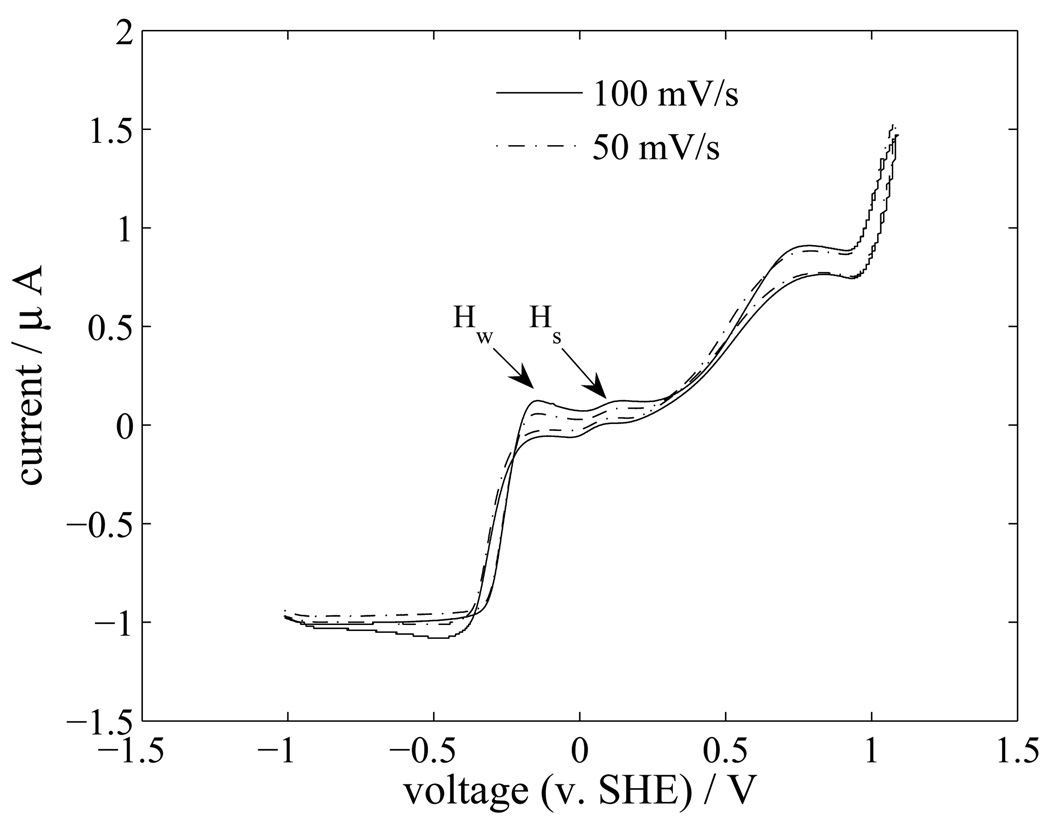
Cyclic voltammetry was used to further analyze the electrochemical reactions at the platinum surface. Cyclic voltammograms of the platinum electrodes are shown for scan rates of 50 and 100 mV/s in Figure 19. By comparing these results with literature (Ren et al., 1999; Yoo et al., 2009), the two peaks labeled Hw and Hs are inferred to be the weak and strong hydrogen adsorption peaks. The hydrogen adsorption peaks occur near the open circuit potential (~0.045 V versus SHE) of the cell.
Figure 19.
Cyclic voltammogram for a platinum electrode in an electrolyte containing PBS and 30 mM H2O2.
Hydrogen adsorption and hydrogen peroxide reduction, equations 10 and 6, have no adverse effect on the platinum surface, hence it is expected to be stable. Effects on the brain tissue are most likely benign. The reduction of hydrogen peroxide to water may even lessen degradation to nearby cells or other parts of the implanted microelectrode (e.g., the polymer insulation). Therefore, these results confirm that platinum as a recording site is a good choice in biological solutions.
5 Conclusions
A strategy for ascertaining the nature of charge transfer including which faradaic reactions are occurring on tungsten and platinum microelectrodes in saline environments has been established. Graphical analysis of impedance data was used to ascertain the presence of faradaic reactions, and extrapolation of the polarization resistance from the impedance data was used to estimate the corrosion rate of corroding systems. Analysis of Pourbaix diagrams for each system at experimentally measured open-circuit potentials corroborated the presence of tungsten corrosion and provided possible electrochemical reactions for each system.
Tungsten was shown to corrode in bench-top physiological saline environments without the formation of a stable oxide. The dominant electrochemical reactions on tungsten in PBS were oxidation of tungsten to the tungstic ion and reduction of oxygen. The dominant reactions in PBS with H2O2 were oxidation of tungsten to the tungstic ion and reduction of oxygen and H2O2 to water. The corrosion rates for a bare-tungsten microelectrode and a gold-plated tungsten microelectrode in physiological PBS were estimated to be 300–700 µm/yr. The corrosion rate of a gold-plated tungsten microelectrode in an electrolyte containing PBS and 30 mM H2O2 was 10,000–20,000 µm/yr.
The corrosion rate in the in vivo setting, averaged over the duration of implantation, was estimated to be approximately 100 µm/yr, which is smaller than the in vitro estimation of tungsten corrosion rate of 300–700 µm/yr. The reduced corrosion rate in the in vivo setting as compared to the in vitro setting is attributed to decreased rate of diffusion caused by the presence of a biological film and a reduced concentration of available oxygen in the brain as compared to electrolyte exposed to air.
Platinum was shown to be a much better choice for intracortical microelectrodes. Platinum is effectively unreactive in phosphate buffered saline solutions and although a faradic response was seen in solution containing hydrogen peroxide, the electrochemical reactions, reduction of H2O2 and hydrogen-atom plating, should have less adverse effects on long-term recording.
The long-term viability of implanted microelectrodes is an ongoing topic of research. This study provides new information on the mechanism of tungsten corrosion in biological saline environments and shows that corrosion should not be neglected in future studies on the viability of tungsten electrodes. Moreover, the role of corrosion byproducts, e.g., the tungstic ion, should be included in the examination of tissue reactivity or subsequent toxic effects on the neural tissue. The findings in this study discourage the use of thin-film tungsten electrodes in any aqueous environment where oxygen or other oxidizing species are present.
Acknowledgement
This work was supported by NIH grant NS053561. The SEM images were provided by the Major Analytical Instrumentation Center (MAIC) at the University of Florida. We also thank Vincent Vivier for the use of the platinum microelectrodes and for the helpful discussions on their fabrication.
Footnotes
Publisher's Disclaimer: This is a PDF file of an unedited manuscript that has been accepted for publication. As a service to our customers we are providing this early version of the manuscript. The manuscript will undergo copyediting, typesetting, and review of the resulting proof before it is published in its final citable form. Please note that during the production process errors may be discovered which could affect the content, and all legal disclaimers that apply to the journal pertain.
References
- Anik M. ph-dependent anodic reaction behavior of tungsten in acidic phosphate solutions. Electrochimica Acta. 2009;54(15):3943–3951. [Google Scholar]
- Anik M, Osseo-Asare K. Effect of ph on the anodic behavior of tungsten. Journal of The Electrochemical Society. 2002;149(6):B224–B233. [Google Scholar]
- Benson BB, Krause D., Jr. The concentration and isotopic fractionation of oxygen dissolved in freshwater and seawater in equilibrium with the atmosphere. Limnology and Oceanography. 1984;29:620–632. [Google Scholar]
- Bothra S, Sur H, Liang V. A new failure mechanism by corrosion of tungsten in a tungsten plug process. Microelectronics and Reliability. 1999;39(1):59–68. [Google Scholar]
- Brug G, den Eeden AV, Sluyters-Rehbach M, Sluyters J. The analysis of electrode impedances complicated by the presence of a constant phase element. Electroanal Chem. 1984;176:275–295. [Google Scholar]
- Brummer SB, Turner MJ. Electrochemical considerations for safe electrical stimulation of the nervous system with platinum electrodes. IEEE T Bio-Med Eng. 1977;BME-24(1):59–63. doi: 10.1109/TBME.1977.326218. [DOI] [PubMed] [Google Scholar]
- Burke B, Lewis C. The Macrophage. Oxford: Oxford Medical Publications; 2002. [Google Scholar]
- Carmena JM, Lebedev MA, Crist RE, O’Doherty JE, Santucci DM, Dimitrov DF, Patil PG, Henriquez CS, Nicolelis MAL. Learning to control a brain-machine interface for reaching and grasping by primates. PLoS Biol. 2003;1(2):e42. doi: 10.1371/journal.pbio.0000042. [DOI] [PMC free article] [PubMed] [Google Scholar]
- Chapin JK, Moxon KA, Markowitz RS, Nicolelis MAL. Real-time control of a robot arm using simultaneously recorded neurons in the motor cortex. Nature Neuroscience. 1999;2(7):664–670. doi: 10.1038/10223. [DOI] [PubMed] [Google Scholar]
- Fonesca C, Barbosa M. Corrosion behavior of titanium in biofluids containing h2o2 studied by electrochemical impedance spectroscopy. Corrosion Science. 2001;43:547–559. [Google Scholar]
- Frateur I, Deslouis C, Orazem ME, Tribollet B. Modeling of the cast iron/drinking water system by electrochemical impedance spectroscopy. Electrochim Acta. 1999;44:4345–4356. [Google Scholar]
- de Haro C, Mas R, Abadal G, Munoz J, Perez-Murano F, Dominguez C. Electrochemical platinum coatings for improving performance of implantable microelectrode arrays. Biomaterials. 2002;23(23):4515–4521. doi: 10.1016/s0142-9612(02)00195-3. [DOI] [PubMed] [Google Scholar]
- Henze D, Borhegyi Z, Sciscvari J, Mamiya A, Harris K, Buzaki G. Intracellular features predicted by extracellular recordings in the hippocampus in vivo. The Journal of Neurophysiology. 2000;84:390–400. doi: 10.1152/jn.2000.84.1.390. [DOI] [PubMed] [Google Scholar]
- Jacobs JJ, Gilbert JL, Urban RM. Current concepts review - corrosion of metal orthopaedic implants. Journal of Bone and Joint Surgery. 1998;80(2):268–282. doi: 10.2106/00004623-199802000-00015. [DOI] [PubMed] [Google Scholar]
- Johnson JW, Wu CL. The anodic dissolution of tungsten. Journal of The Electrochemical Society. 1971;118(12):1909–1912. [Google Scholar]
- Jones DA. Principles and Prevention of Corrosion. New York, NY: Maxmilliam Publishing Co.; 1992. [Google Scholar]
- Kelsey GS. The anodic oxidation of tungsten in aqueous base. Journal of The Electrochemical Society. 1977;124(6):814–819. [Google Scholar]
- Kipke DR. Silicon-substrate intracortical microelectrode arrays for long-term recording of neuronal spike activity in cerebral cortex. IEEE Trans Rehab Eng. 2003;11:151–155. doi: 10.1109/TNSRE.2003.814443. [DOI] [PubMed] [Google Scholar]
- Lillard RS, Kanner GS, Butt DP. The nature of oxide films on tungsten in acidic and alkaline solutions. Journal of The Electrochemical Society. 1998;145(8):2718–2725. [Google Scholar]
- Maas A, Fleckenstein W, de Jong D, van Santbrink H. Monitoring cerebral oxygenation: experimental studies and preliminary clinical results of continuous monitoring of cerebrospinal fluid and brain tissue oxygen tension. Acta Neurochir Suppl (Wien) 1993;59:5057. doi: 10.1007/978-3-7091-9302-0_9. [DOI] [PubMed] [Google Scholar]
- Maynard E, Nordhausen C, Normann RA. The Utah intracortical electrode array: A recording structure for potential brain-computer interfaces. Electroencephalography and Clinical Neurophysiology. 1997;102:228–239. doi: 10.1016/s0013-4694(96)95176-0. [DOI] [PubMed] [Google Scholar]
- Merrill DR, Bikson M, Jefferys JGR. Electrical stimulation of excitable tissue: Design of efficacious and safe protocols. Journal of Neuroscience Methods. 2005;141(2):171–198. doi: 10.1016/j.jneumeth.2004.10.020. 0165-0270. [DOI] [PubMed] [Google Scholar]
- Newman J. Electrochemical Systems. Hoboken, NJ: John Wiley and Sons, Inc.; 2004. [Google Scholar]
- Norlin A, Pan J, Leygral C. Investigation of interfacial capacitance of Pt, Ti, and TiN coated electrodes by electrochemical impedance spectroscopy. Biomolecular Engineering. 2002;19:67–71. doi: 10.1016/s1389-0344(02)00013-8. [DOI] [PubMed] [Google Scholar]
- Norlin A, Pan J, Leygral C. Investigation of electrochemical behavior for stimulating/sensing materials for pacemaker electrode applications. J of the ELectrochemical Society. 2005;152(2):J7–J15. [Google Scholar]
- Orazem ME. A systematic approach toward error structure identification for impedance spectroscopy. J Electroanal Chem. 2004;572:317–327. [Google Scholar]
- Orazem ME, Pébère N, Tribollet B. A new look at graphical representation of impedance data. J Electrochem Soc. 2006;153:B129–B136. [Google Scholar]
- Orazem ME, Tribollet B. Electrochemical Impedance Spectroscopy. Hoboken, NJ: John Wiley & Sons; 2008. [Google Scholar]
- Pan J, Theirry D, Leygraf C. Electrochemical impedance spectroscopy study of the passive oxide film on titanium for implant application. Electrochemica Acta. 1996;41:1143–1153. [Google Scholar]
- Patrick E. Design, Fabrication, and Characterization of Microelectrodes for Brain-Machine Interfaces. Ph.D. thesis. University of Florida; 2010. [Google Scholar]
- Patrick E, Sankar V, Rowe W, Sanchez JC, Nishida T. An implantable integrated low-power amplifier-microelectrode array for brain-machine interfaces. Engineering in Medicine and Biology Society, 2010; EMBS ’10. 32nd Annual International Conference of the IEEE; 2010. in press. [DOI] [PubMed] [Google Scholar]
- Patrick E, Sankar V, Rowe W, Yen SF, Sanchez JC, Nishida T. Flexible polymer substrate and tungsten microelectrode array for an implantable neural recording system. Engineering in Medicine and Biology Society, 2008; EMBS ’08. 30th Annual International Conference of the IEEE; 2008. pp. 3158–3161. [DOI] [PubMed] [Google Scholar]
- Peuster M, Fink C, von Schnakenburg C. Biocompatibility of corroding tungsten coils: in vitro assessment of degradation kinetics and cytotoxicity on human cells. Biomaterials. 2003;24:4057–4061. doi: 10.1016/s0142-9612(03)00274-6. [DOI] [PubMed] [Google Scholar]
- Pourbaix M. Atlas of electrochemical equilibria. Oxford: Pergamon Press Ltd.; 1966. [Google Scholar]
- Ren B, Xu X, Li XQ, Cai WB, Tian ZQ. Extending surface raman spectroscopic studies to transition metals for practical applications: Ii. hydrogen adsorption at platinum electrodes. Surface Science. 1999;427–428:157–161. [Google Scholar]
- Sanchez J, Alba N, Nishida T, Batich C, Carney P. Structural modifications in chronic microwire electrodes for cortical neuroprosthetics: A case study. IEEE Trans on Neural Syst Rehab Eng. 2006:217–221. doi: 10.1109/TNSRE.2006.875581. [DOI] [PubMed] [Google Scholar]
- Sarrafzadeh A, Kiening K, Bardt T, Schneider G, Unterberg A, Lanksch W. Cerebral oxygenation in contusioned vs nonlesioned brain tissue: monitoring of ptio2 with licox and paratrend. Acta Neurochir Suppl (Wien) 1998;71:186–189. doi: 10.1007/978-3-7091-6475-4_54. [DOI] [PubMed] [Google Scholar]
- Stern M, Geary AL. Electrochemical polarization: I. a theoretical analysis of the shape of polarization curves. J Electrochem Soc. 1957;104:56–63. [Google Scholar]
- Williams JC, Rennaker RL, Kipke DR. Long-term neural recording characteristics of wire microelectrode arrays implanted in cerebral cortex. Brain Research Protocols. 1999;4(3):303–313. doi: 10.1016/s1385-299x(99)00034-3. [DOI] [PubMed] [Google Scholar]
- Yoo HD, Jang JH, Ka BH, Rhee CK, Oh SM. Impedance analysis for hydrogen adsorption pseudocapacitance and electrochemically active surface area of pt electrode. Langmuir. 2009;25(19):11947–11954. doi: 10.1021/la900290b. [DOI] [PubMed] [Google Scholar]


