

Abstract
A transgenic mouse model for conditional induction of long-term hibernation via myocardium-specific expression of a VEGF-sequestering soluble receptor allowed the dissection of the hibernation process into an initiation and a maintenance phase. The hypoxic initiation phase was characterized by peak levels of K(ATP) channel and glucose transporter 1 (GLUT1) expression. Glibenclamide, an inhibitor of K(ATP) channels, blocked GLUT1 induction. In the maintenance phase, tissue hypoxia and GLUT1 expression were reduced. Thus, we employed a combined “-omics” approach to resolve this cardioprotective adaptation process. Unguided bioinformatics analysis on the transcriptomic, proteomic and metabolomic datasets confirmed that anaerobic glycolysis was affected and that the observed enzymatic changes in cardiac metabolism were directly linked to hypoxia-inducible factor (HIF)-1 activation. Although metabolite concentrations were kept relatively constant, the combination of the proteomic and transcriptomic dataset improved the statistical confidence of the pathway analysis by 2 orders of magnitude. Importantly, proteomics revealed a reduced phosphorylation state of myosin light chain 2 and cardiac troponin I within the contractile apparatus of hibernating hearts in the absence of changes in protein abundance. Our study demonstrates how combining different “-omics” datasets aids in the identification of key biological pathways: chronic hypoxia resulted in a pronounced adaptive response at the transcript and the protein level to keep metabolite levels steady. This preservation of metabolic homeostasis is likely to contribute to the long-term survival of the hibernating myocardium.
Abbreviations: DIGE, difference in-gel electrophoresis; 2-DE, two-dimensional gel electrophoresis; 1H-NMR, proton nuclear magnetic resonance spectroscopy; LC-MS/MS, liquid chromatography tandem mass spectrometry
Keywords: Hibernation, Hypoxia, Metabolomics, Myocardium, Proteomics
Graphical Abstract
Research Highlights
► The hibernation process was dissected into an initiation and a maintenance phase. ► Glibenclamide, an inhibitor of K(ATP) channels, blocked GLUT1 induction. ► The maintenance phase was characterized by attenuated tissue hypoxia. ► Phosphorylation of myosin light chain 2 and cardiac troponin I was reduced. ► Combining of proteomics and transcriptomics improved the bioinformatic pathway analysis.
1. Introduction
Hibernating myocardium as defined by Rahimtoola et al. [1] refers to resting LV dysfunction due to reduced coronary blood flow that can be partially or completely reversed by myocardial revascularization and/or by reducing myocardial oxygen demand. This endogenous mechanism of cell survival is a potent cardioprotective response that preserves myocardial viability under hypoxia [1,2]. Unlike myocardial infarction, the hibernating myocardium does not undergo cell death, but can be salvaged and its function partially or fully restored upon reperfusion [3]. The adaptive mechanisms by which hibernating myocardium survives during chronic ischemia remain to be elucidated [2,4–6].
Recently, May et al. [7] established a bitransgenic system for conditional and reversible loss of vascular endothelial growth factor (VEGF) function in the heart. Inducible cardiac expression of a soluble decoy receptor sequestered VEGF. As a result of the VEGF blockade, the myocardium was subject to a reversible microvascular deficit and experienced chronic hypoxia, which recapitulates all the hallmarks of long-term myocardial hibernation. Cardiomyocytes showed reduced contraction, but remained viable and preserved their potential of full recovery. Importantly, this animal model resembled myocardial hibernation without accompanying cell death and inflammation, two confounding factors in models of ischemia that complicate comparisons with an -omics approach.
In the present study, we performed a proteomic and metabolomic analysis of hearts after 6 weeks of VEGF blockade. We have previously demonstrated the usefulness of this combined approach to assess enzyme and corresponding metabolite changes in preconditioned [8,9] as well as cardioprotected hearts [10]. The combination of proteomics with metabolomics provides a platform for phenotyping transgenic mice at a molecular level [11,12] as protein changes tend to complement alterations in gene expression and metabolite levels provide the integrated “read-out” of the transcriptomic and proteomic variation. The mouse model of conditional VEGF blockade now offers an opportunity to investigate the hibernation program at the mRNA, protein and metabolite level and to demonstrate the feasibility of combining different “-omics” datasets in unsupervised network analyses.
2. Materials and methods
Detailed methodology is provided in the online data supplement. A bi-transgenic system for heart-specific expression of the ligand binding domain of soluble VEGF receptor 1 (sVEGF-R1) was used for the present study [7]. For proteomic and metabolomic analysis, induction of sVEGF-R1 in double-transgenic mice was carried out postnatally by tetracycline withdrawal for 6 weeks as previously described [7]. For in vivo inhibition of K(ATP) channels, glibenclamide (0.3 mg/kg bolus i.p.; Sigma Chemical Corporation) was administered as a single dose to 2-week-old mice and RNA was harvested after 24 h. Key techniques involved adaptations of previously published protocols, including those for difference in-gel electrophoresis (DIGE) [10], liquid chromatography tandem mass spectrometry (LC-MS/MS) [10], proton nuclear magnetic resonance spectroscopy (1H-NMR) [13], immunoblotting [10], real-time PCR (qPCR) [7] and hypoxyprobe™ staining [7]. The Affymetrix Genechip mRNA expression analysis data were previously described by May et al. [7]. The network representation with the Cytoscape software and the pathway analysis with the MetaCore™ systems biology analysis suite (GeneGo Inc., St. Joseph, MI) is explained online. Protocols for proteomics are available on our website at http://www.vascular-proteomics.com.
3. Results
3.1. Initiation and maintenance phase
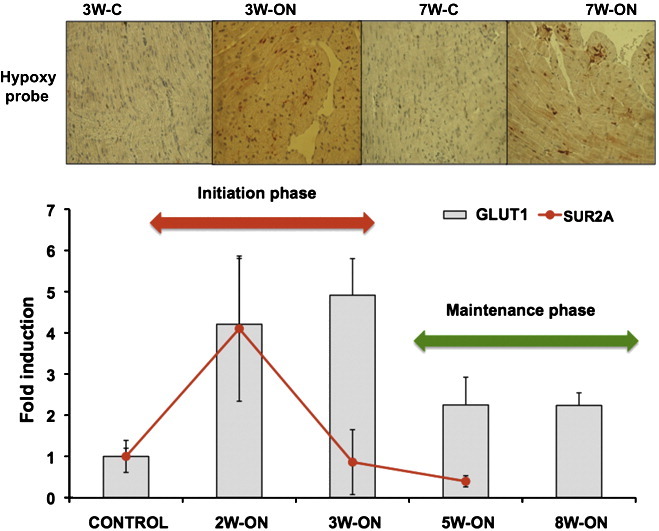
The conditional system of VEGF blockade allowed a dissection of the hibernation process into two distinct phases: an initiation phase with induction of K(ATP) channels and GLUT1 and a maintenance phase with reduced tissue hypoxia (Fig. 1A). K(ATP) channels represent a union between a member of the inward rectifier Kir family and the ABC superfamily (ATP binding cassette). The latter provides two binding sites, one for SUR (sulfonylurea, epitomized by glibenclamide) and the other for ATP [3]. The subunits SUR2A and Kir6.2 are particularly abundant in cardiomyocytes. After an initial upregulation within the first 2 weeks of VEGF blockade, SUR2A and Kir6.2 showed lower expression during pro-longed hypoxia (Fig. 1B). This biphasic response was mirrored by the expression pattern of Foxo1, a key transcription factor regulating K(ATP) channel expression (Fig. 1 C). Interestingly, peak values of SUR2A and Kir6.2 (2W-ON) antedated peak levels of glucose transporter 1 expression (GLUT1, 3W-ON) (Fig. 1B). To explore whether this temporal association reflects a causal relationship, glibenclamide, a K(ATP) channel inhibitor was administered to 2-week-old mice (2W-ON). A single injection of glibenclamide attenuated GLUT1 expression within 24 h (Fig. 1D). Survival was not affected at this time point.
Fig. 1.

Initiation and maintenance phase. (A) Immunohistochemical staining for hypoxia (HypoxyprobeTM) in the hibernating subendocardium after 3 weeks (3W-ON) and 7 weeks (7W-ON) of VEGF blockade. Brown staining indicates areas of hypoxia. Reduced hypoxyprobe staining was observed after 7 weeks (7W-ON) compared to 3 weeks (3W-ON) of VEGF blockade. Images are representative of 3 independent experiments. (B) qPCR analysis of GLUT1 and K(ATP) channels after 2, 3 and 5 weeks of VEGF blockade (2W-ON, 3W-ON, 5W-ON). Note that the maximum in SUR2A and Kir6.2 expression antedates peak levels of GLUT1. SUR2A: ATP-binding cassette; Kir6.2: potassium inwardly rectifying channel; *p-value < 0.05, **p-value < 0.01, n ≥ 3 per group. (C) qPCR analysis of FOXO1, a transcription factor regulating K(ATP) channel expression (n = 3). (D) Effect of glibenclamide, an inhibitor of K(ATP) channels, on GLUT1 gene expression in 2-week-old mice (n ≥ 4 per group).
3.2. Proteomics and transcriptomics
The observed reduction of tissue hypoxia during the maintenance phase may result from decreased oxygen consumption or increased oxygen supply with the latter being unlikely given the rarefaction of the microvasculature under VEGF blockade. To provide insights into protein changes, control and transgenic hearts (6W-ON) were compared by DIGE. A representative image of the cardiac proteome as separated by two-dimensional gel electrophoresis (2-DE, pH 3–10 nonlinear) is presented in Fig. 2. Principal component analysis (PCA) and hierarchical clustering were applied to the entire proteomic dataset (7 gels per group) to identify the dominant trends and reveal differentially expressed proteins (Supplemental Figure 1). Examples illustrating the quantitative accuracy of the DIGE approach are shown in Supplemental Figure 2. The protein spots were excised, subject to in-gel tryptic digestion, identified by LC-MS/MS analysis (Table 1 and Supplemental Table I) and mapped to our previously published microarray dataset [7] (Fig. 3). Overall, there was a good correlation between mRNA and protein fold induction (Pearson correlation coefficient = 0.6395, p ≤ 0.0001), in particular for genes displaying a significant change in both the transcriptomic and proteomic datasets (Supplemental Table II).
Fig. 2.

Protein expression during the maintenance phase. Protein extracts from control and hibernating hearts after 6 weeks of VEGF blockade (6W-ON) were quantified using DIGE. Differentially expressed spots were numbered and identified by LC-MS/MS (Table 1).
Table 1.
Differentially expressed proteins identifications by tandem mass spectrometry (LC-MS/MS)
| No. | Protein identity | Fold change hibernating vs control | P-value (t-test) | P-value (FDR) | SWISS PROT accession number | Theoretical pI/MW | Observed pI/MW | No of identified peptides | Sequence coverage (%) |
|---|---|---|---|---|---|---|---|---|---|
| Glucose metabolism | |||||||||
| 28 | Fructose-bisphosphate aldolase A | + 1.52 | 4.4e-05 | 0.0027 | ALDOA_MOUSE | 8.4 / 39.2 | 8.7 / 41.6 | 22 | 52.50% |
| 40 | Triosephosphate isomerase | + 1.43 | 0.0001 | 0.0038 | TPIS_MOUSE | 7.1 / 26.6 | 7.5 / 22.0 | 5 | 20.50% |
| 41 | Triosephosphate isomerase | + 1.35 | 0.0002 | 0.0055 | TPIS_MOUSE | 7.1 / 26.6 | 7.9 / 21.8 | 16 | 58.20% |
| 42 | Triosephosphate isomerase | + 2.13 | 1.2e-07 | 3.1e-5 | TPIS_MOUSE | 7.1 / 26.6 | 8.1 / 21.6 | 12 | 51.80% |
| 31 | Glyceraldehyde-3-phosphate dehydrogenase | + 1.41 | 1.1e-05 | 0.0010 | G3P_MOUSE | 8.1 / 47.7 | 8.6 / 35.7 | 9 | 28.80% |
| 16 | Pyruvate kinase, isozyme M1/M2 | + 1.23 | 0.040 | 0.24 | KPYM_MOUSE | 7.4 / 57.7 | 7.9 / 60.3 | 23 | 37.70% |
| 17 | Pyruvate kinase, isozyme M1/M2 | + 1.54 | 7.3e-07 | 9.8e-5 | KPYM_MOUSE | 7.4 / 57.7 | 8.1 / 60.0 | 19 | 29.90% |
| 18 | Pyruvate kinase, isozyme M1/M2 | + 1.24 | 0.0002 | 0.0048 | KPYM_MOUSE | 7.4 / 57.7 | 8.2 / 60.2 | 9 | 20.00% |
| 24 | Pyruvate dehydrogenase E1 component alpha subunit | + 1.66 | 0.0008 | 0.014 | ODPA_MOUSE | 8.5 / 43.2 | 7.7 / 48.7 | 15 | 30.00% |
| 29 | Aldose reductase | + 1.24 | 0.026 | 0.091 | ALDR_MOUSE | 6.8 / 35.6 | 7.8 / 36.0 | 13 | 38.60% |
| 33 | l-Lactate dehydrogenase A chain | + 1.29 | 7.8e-05 | 0.0038 | LDHA_MOUSE | 7.6 / 29.5 | 8.2 / 33.3 | 11 | 30.10% |
| Lipid metabolism | |||||||||
| 25 | Acyl-CoA dehydrogenase, long-chain specific | −1.29 | 0.013 | 0.061 | ACADL_MOUSE | 8.5 / 47.9 | 7.6 / 45.0 | 2 | 5.12% |
| 34 | Delta3,5-delta2,4-dienoyl-CoA isomerase, mitochondrial | −1.23 | 0.003 | 0.028 | ECH1_MOUSE | 7.6 / 36.1 | 7.1 / 29.3 | 4 | 10.10% |
| 35 | Hydroxyacyl-coenzyme A dehydrogenase, mitochondrial | −1.22 | 0.002 | 0.021 | HCDH_MOUSE | 8.8 / 34.5 | 8.6 / 32.0 | 12 | 22.00% |
| Amino acid metabolism | |||||||||
| 20 | Glutamate dehydrogenase 1, mitochondrial | −1.23 | 0.022 | 0.082 | DHE3_MOUSE | 8.1 / 61.3 | 8.0 / 56.9 | 14 | 25.10% |
| 7 | Methylcrotonoyl-CoA carboxylase alpha chain, mitochondrial | −1.21 | 0.0004 | 0.008 | MCCA_MOUSE | 7.7 / 79.3 | 8.0 / 74.1 | 11 | 13.80% |
| 23 | Ornithine aminotransferase, mitochondrial | + 1.42 | 9.8e-08 | 3.1e-5 | OAT_MOUSE | 6.2 / 48.3 | 6.6 / 48.3 | 2 | 4.78% |
| TCA cycle | |||||||||
| 5 | Aconitate hydratase, mitochondrial | −1.20 | 0.021 | 0.078 | ACON_MOUSE | 8.1 / 85.4 | 8.0 / 80.0 | 6 | 7.95% |
| 6 | Aconitate hydratase, cytoplasmic | −1.29 | 0.034 | 0.095 | ACOC_MOUSE | 7.2 / 98.1 | 8.4 / 84.8 | 13 | 14.80% |
| 36 | ATP synthase gamma chain, mitochondrial | + 1.27 | 0.021 | 0.078 | ATPG_MOUSE | 9.1 / 32.8 | 9.1 /27.1 | 5 | 15.10% |
| Energy metabolism | |||||||||
| 22 | Adenosine kinase | −1.25 | 0.029 | 0.093 | ADK_MOUSE | 7.2 / 31.1 | 6.4 / 46.0 | 2 | 3.88% |
| 27 | Creatine kinase M-type | −1.22 | 0.002 | 0.020 | KCRM_MOUSE | 6.6 / 43.0 | 8.0 / 43.8 | 24 | 54.10% |
| 49 | Adenylate kinase 4, mitochondrial | + 1.24 | 0.005 | 0.090 | KAD4_MOUSE | 7.0 / 25.1 | 7.9 / 23.5 | 8 | 35.00% |
| Antioxidants | |||||||||
| 48 | Peroxiredoxin 1 | + 1.35 | 0.0002 | 0.0055 | PRDX1_MOUSE | 8.3 / 22.2 | 8.7 / 18.3 | 11 | 42.20% |
| 44 | Peroxiredoxin 2 | + 1.23 | 0.011 | 0.056 | PRDX2_MOUSE | 5.2 / 21.8 | 5.0 / 18.4 | 6 | 24.70% |
| 9 | Protein disulfide-isomerase | + 1.32 | 0.001 | 0.014 | PDIA1_MOUSE | 4.8 / 57.1 | 4.6 / 59.9 | 5 | 8.64% |
| 14 | Protein disulfide-isomerase A3 | + 1.43 | 5.7e-06 | 0.00061 | PDIA3_MOUSE | 6.0 / 56.6 | 6.5 / 60.5 | 6 | 11.90% |
| Chaperones | |||||||||
| 1 | 78 kDa glucose-regulated protein | + 2.18 | 3.8e-10 | 3.1e-05 | GRP78_MOUSE | 5.1 / 72.4 | 5.0 / 73.6 | 21 | 33.70% |
| 47 | Alpha crystallin B chain | + 1.46 | 9.6e-05 | 0.0038 | CRYAB_MOUSE | 6.8 / 20.1 | 8.0 / 17.6 | 10 | 45.10% |
| 39 | Heat-shock protein beta-1 (27 kDa) | + 1.36 | 0.002 | 0.020 | HSPB1_MOUSE | 6.1 / 23.0 | 6.1 / 22.2 | 2 | 9.09% |
| 8 | T-complex protein 1, zeta subunit | + 1.25 | 0.006 | 0.040 | TCPZ_MOUSE | 6.7 / 57.8 | 7.9 / 64.3 | 10 | 19.20% |
| Myofilaments | |||||||||
| 43 | Myosin regulatory light chain 2, ventricular/cardiac muscle isoform | −1.34 | 0.018 | 0.073 | MLRV_MOUSE | 4.7 /18.8 | 4.6 / 16.5 | 11 | 46.40% |
| 37 | Troponin I, cardiac muscle | −1.67 | 0.0003 | 0.0071 | TNNI3_MOUSE | 9.6 / 21.2 | 9.4 / 21.0 | 2 | 9.48% |
| Intermediate filaments, Microtubules | |||||||||
| 11 | Desmin | + 1.38 | 3.5e-05 | 0.0024 | DESM_MOUSE | 5.2 / 53.4 | 5.2 / 56.4 | 26 | 50.70% |
| 12 | Desmin | + 1.50 | 3.3e-07 | 5.8e-05 | DESM_MOUSE | 5.2 / 53.4 | 5.3 / 56.4 | 27 | 51.60% |
| 10 | Tubulin beta-2C chain | + 1.45 | 0.011 | 0.056 | TBB2C_MOUSE | 4.8 / 50.4 | 4.9 / 57.4 | 8 | 18.40% |
| Plasma proteins | |||||||||
| 38 | Apolipoprotein A-I | + 1.70 | 0.001 | 0.016 | APA1_MOUSE | 5.6 / 30.6 | 5.4 / 20.4 | 6 | 19.70% |
| 15 | Fibrinogen beta chain | + 1.75 | 0.001 | 0.012 | FIBB_MOUSE | 6.7 / 54.7 | 6.8 / 58.9 | 10 | 21.00% |
| 13 | Fibrinogen gamma chain | + 1.22 | 0.02 | 0.23 | FIBG_MOUSE | 5.5 / 49.4 | 5.7 / 53.8 | 3 | 6.65% |
| 2 | Serotransferrin | + 1.32 | 0.003 | 0.028 | TRFE_MOUSE | 6.9 / 76.7 | 77.2 / 7.7 | 15 | 24.70% |
| 3 | Serotransferrin | + 1.34 | 0.001 | 0.018 | TRFE_MOUSE | 6.9 / 76.7 | 77.2 / 7.8 | 40 | 57.00% |
| 4 | Serotransferrin | + 1.34 | 0.002 | 0.019 | TRFE_MOUSE | 6.9 / 76.7 | 77.2 / 7.9 | 34 | 45.90% |
| Mixtures | |||||||||
| 19 | Mixture: | −1.32 | 0.001 | 0.017 | |||||
| Succinyl-CoA:3-ketoacid-coenzyme A transferase 1, mitochondrial | SCOT1_MOUSE | 8.7 / 60.0 | 8.0 / 58.5 | 8 | 18.70% | ||||
| Cytosol aminopeptidase | AMPL_MOUSE | 6.7 / 56.0 | 8.0 / 58.5 | 5 | 13.30% | ||||
| 21 | Mixture: | −1.24 | 0.008 | 0.046 | |||||
| Beta-enolase | ENOB_MOUSE | 6.7 / 47.0 | 8.1 / 50.3 | 7 | 14.50% | ||||
| Fumarate hydratase, mitochondrial | FUMH_MOUSE | 9.1 / 54.2 | 8.1 / 50.3 | 3 | 5.72% | ||||
| 26 | Mixture | −1.23 | 0.009 | 0.049 | |||||
| Creatine kinase M-type | KCRM_MOUSE | 6.6 / 43.0 | 7.8 / 44.2 | 22 | 50.90% | ||||
| Acyl-CoA dehydrogenase, long-chain specific | ACADL_MOUSE | 8.5 / 47.9 | 7.8 / 44.2 | 18 | 40.90% | ||||
| 30 | Mixture: | + 1.36 | 0.002 | 0.0055 | |||||
| Glyoxylate reductase/hydroxypyruvate reductase | GRHPR_MOUSE | 7.6 / 35.3 | 8.2 / 36.5 | 10 | 23.50% | ||||
| Glyceraldehyde-3-phosphate dehydrogenase | G3P_MOUSE | 8.5 / 35.7 | 8.2 / 36.5 | 8 | 29.10% | ||||
| 32 | Mixture: | −1.32 | 0.0008 | 0.014 | |||||
| Four and a half LIM domains protein 2 | FHL2_MOUSE | 7.3 / 32.1 | 8.0 / 33.5 | ||||||
| l-Lactate dehydrogenase A chain | LDHA_MOUSE | 7.6 / 29.5 | 8.0 / 33.5 | 6 | 15.10% | ||||
| 45 | Mixture: | + 1.33 | 0.008 | 0.046 | |||||
| NADH dehydrogenase [ubiquinone] 1 beta subcomplex subunit 10 | NDUBA_MOUSE | 8.4 / 20.9 | 8.8 / 19.6 | 8 | 40.30% | ||||
| Cysteine and glycine-rich protein 3 | CSRP3_MOUSE | 8.9 / 20.8 | 8.8 / 19.6 | 3 | 24.70% | ||||
| 46 | Mixture: | + 1.30 | 0.007 | 0.043 | |||||
| Cysteine and glycine-rich protein 3 | CSRP3_MOUSE | 8.9 / 20.8 | 8.6 / 19.3 | 6 | 39.20% | ||||
| Glutathione S-transferase P1 | GSTP1_MOUSE | 8.1 / 23.5 | 8.6 / 19.3 | 5 | 37.60% |
pI denotes isoelectric point; MW, molecular weight.
Difference in-gel electrophoresis results were reproduced with different biological replicates using reverse-labeling (biological replicates n = 4 for control and hibernating hearts, with technical replicates n = 7). P-values for differences between the two groups were derived from unpaired t-tests using Decyder software (v6.5, GE healthcare). Corrections for multiple testing were performed by the Benjamini–Hochberg equation, yielding False Discovery rates (FDR). The differentially expressed proteins are numbered in Fig. 2.
Fig. 3.

Combined proteomic and transcriptomic investigation. Comparison between fold induction of mRNA expression (orange bars, log scaled) and protein changes (blue bars) in hibernating versus control hearts for proteins detected by DIGE (see Table 1). The proteins are grouped according to the GO annotations.
3.3. Changes in net expression
The hibernating myocardium was characterized by increased expression of HIF target genes, reduced levels of mitochondrial enzymes involved in beta-oxidation and adaptive changes in cardiac glucose and energy metabolism (Fig. 3) [7]. As part of the fetal reprogramming [14], gene expression of glucose transporter 1 (Glut1, + 3.4-fold, FDR 0.003), natriuretic peptide precursor type A and B (Nppa and Nppb, + 3.4 and + 2.5-fold, FDR 0.009 and 0.057, respectively), myosin heavy polypeptide 7 (Myct1, + 8.0-fold, FDR 0.033) and pyruvate dehydrogenase kinase, isoenzyme 1 (Pdk1, + 2.3-fold, FDR 0.036) was induced. The proteomic investigation confirmed a concordant upregulation of lactate dehydrogenase (Fig. 4A) and several glycolytic enzymes, among which fructose-biphosphate aldolase, glyceraldehyde-3-phosphate dehydrogenase, and pyruvate kinase are known HIF targets sensitive to hypoxia. Mitochondrial enzymes related to lipid metabolism, i.e., long-chain specific acyl-CoA dehydrogenase, short chain specific 3-hydroxyacyl-CoA dehydrogenase, and delta3,5-delta2,4-dienoyl-CoA isomerase, were downregulated in the hibernating myocardium alongside creatine kinase and adenosine kinase, which contribute to energy homeostasis.
Fig. 4.
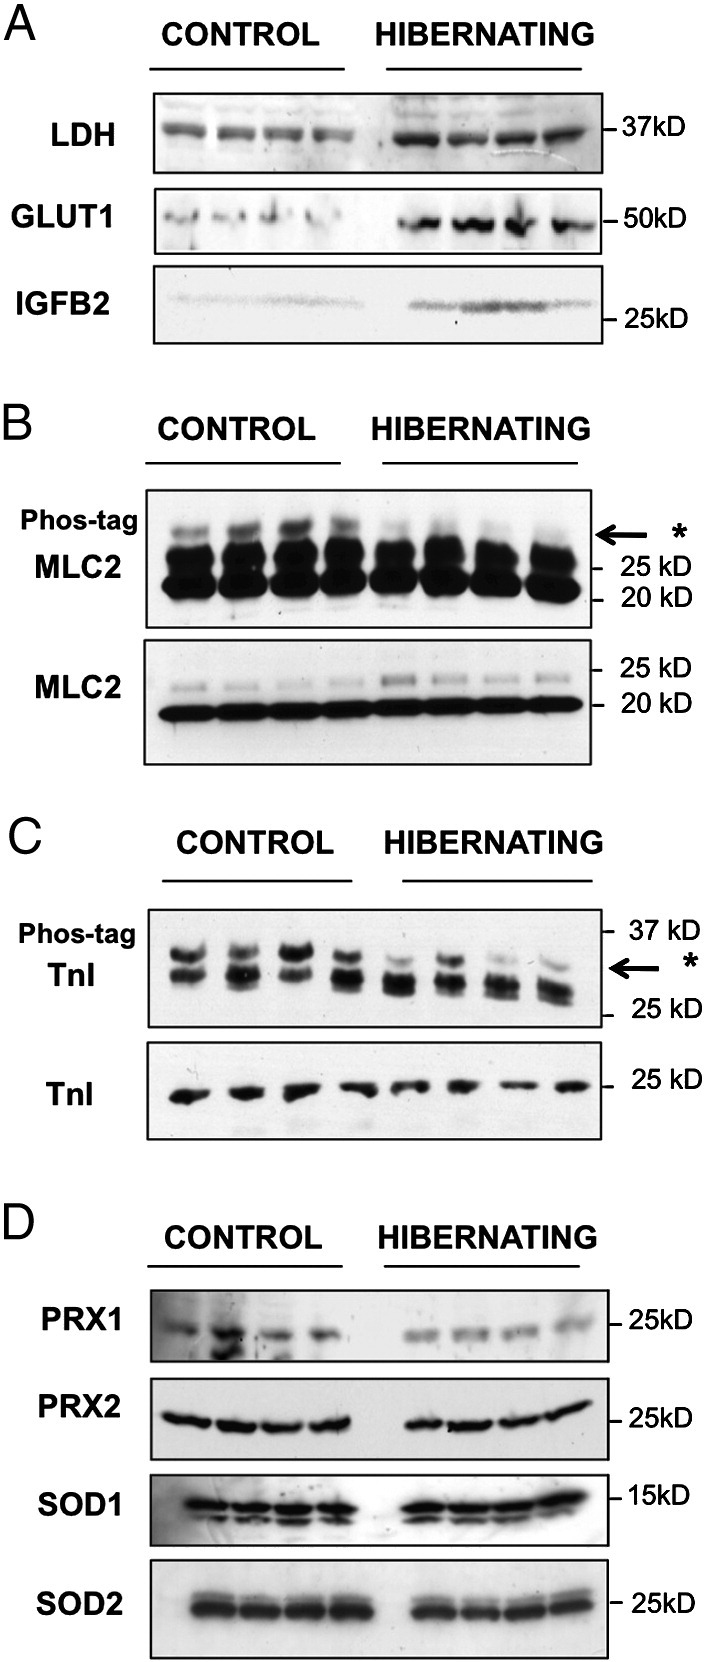
Protein expression and post-translational modifications. (A) Western blot analysis of GLUT1, LDH and IGFBP2 in hibernating and control hearts (6W-ON). (B, C) Phosphate-affinity gel electrophoresis for mobility shift detection of phosphorylated proteins. Significant changes were detected in the phosphorylation (upper panel, bands marked with an arrow) of myosin regulatory light chain 2 (MLC2, B) and cardiac troponin I (TnI, C) without differences in protein abundance (lower panels). Quantitative data are shown in Supplemental Figure 3. (D) Western blot analysis of anti-oxidant proteins in hibernating and control hearts. Densitometry data for SOD2 are provided in Supplemental Figure 3.
3.4. Changes in post-translational modifications
For two myofilament proteins there was discordant regulation at the mRNA and protein level (Fig. 3). Myosin regulatory light chain 2 (MLC2) was resolved as a charge train with different isoelectric points (pI) by 2-DE [15]. The differentially expressed spot (spot 43, Fig. 2) showed a shift towards a more acidic pI, indicative of phosphorylation. This was subsequently confirmed by mobility shift detection of phosphorylated proteins (Phos-tag, Fig. 4B). Similarly, there were no significant differences in protein abundance of cardiac troponin I (TnI) as the observed change was due to decreased phosphorylation in hibernating hearts (Fig. 4C). Other proteins that showed differential expression on 2-DE gels without corresponding alterations in mRNA transcripts are known to be susceptible to oxidative stress, i.e., aldose reductase has a cysteine residue as regulator of its kinetic and inhibition properties; protein disulfide isomerases are redox-sensitive chaperones responsible for the rearrangement of disulfide bonds; and peroxiredoxin 1 and 2 have redox-active cysteins as their main anti-oxidative component. Oxidation of their cysteine residues makes these proteins more acidic resulting in a charge shift on 2-DE gels without altering the net expression of these cytosolic antioxidants [16,17] (Fig. 4D). In contrast, levels of mitochondrial manganese SOD (SOD2) were reduced although cytosolic copper–zinc SOD (SOD1) was similar in control and hibernating hearts (Fig. 4D). Thus, besides changes in net expression, hibernation was associated with alterations in post-translational modifications of myofilament and redox-sensitive proteins, which can be interrogated by using a proteomics approach.
3.5. Metabolomic analysis
Among the differentially expressed spots were proteins with established links to cardiac K(ATP) channels, including 3 glycolytic enzymes (pyruvate kinase, triose phosphate isomerase and GAPDH) known to be physically associated with cardiac K(ATP) channels [18,19] and contributors to cardiac energy shuttling, including creatine kinase, adenosine kinase and lactate dehydrogenase [20]. We therefore assessed cardiac metabolism after 6 weeks of VEGF blockade by 1H-NMR spectroscopy. Representative spectra of cardiac metabolite extracts are shown in Fig. 5. Quantitative data are provided in Table 2. Overall, the metabolite changes were not pronounced, but the observed reduction of glutamate, glutamine and total creatine in hibernating hearts by 1H-NMR spectroscopy corresponded to a decrease of mitochondrial glutamate dehydrogenase and creatine kinase in the proteomic dataset (Table 1). Consistent with previous reports in hypoxic rats [21], the observed metabolic differences (lower glutamine levels, but higher aspartate to glutamate concentration ratios) are indicative of a decreased flux through the malate-aspartate shuttle under conditions of oxygen limitation. In addition, choline, taurine, and leucine concentrations were lower in hibernating hearts. Perturbations of glucose concentrations and the adenosine pool (ADP + ATP) failed to reach statistical significance.
Fig. 5.

High-resolution 1H-NMR spectroscopy of cardiac tissue extracts. Representative spectra of the aliphatic region (− 0.05 to 4.2 ppm) from control (bottom) and hibernating hearts (top). Quantitative metabolite data are presented in Table 2.
Table 2.
Metabolite changes by 1H-NMR in cardiac tissue extracts.
| Control (n = 3) | Hibernating (n = 5) | Fold change | P (t-test) | |
|---|---|---|---|---|
| Leucine | 0.101 (± 0.005) | 0.075 (± 0.005) | 0.74 | 0.016 |
| Isoleucine | 0.414 (± 0.138) | 0.374 (± 0.107) | 0.90 | 0.828 |
| Valine | 0.105 (± 0.011) | 0.086 (± 0.008) | 0.82 | 0.214 |
| Isovalerate | 0.123 (± 0.034) | 0.143 (± 0.048) | 1.16 | 0.774 |
| Beta-OH butyrate | 0.145 (± 0.030) | 0.126 (± 0.026) | 0.87 | 0.654 |
| Lactate | 10.383 (± 0.784) | 11.689 (± 0.648) | 1.12 | 0.255 |
| Alanine | 1.680 (± 0.273) | 1.719 (± 0.106) | 1.02 | 0.878 |
| Acetate | 0.337 (± 0.053) | 0.310 (± 0.090) | 0.92 | 0.835 |
| Glutamate | 3.752 (± 0.258) | 2.563 (± 0.126) | 0.68 | 0.003 |
| Succinate | 1.234 (± 0.343) | 1.087 (± 0.119) | 0.88 | 0.638 |
| Glutamine | 2.873 (± 0.315) | 2.000 (± 0.186) | 0.69 | 0.042 |
| Aspartate | 0.266 (± 0.097) | 0.346 (± 0.073) | 1.30 | 0.534 |
| Choline | 0.077 (± 0.005) | 0.051 (± 0.004) | 0.66 | 0.006 |
| Phosphocholine | 0.173 (± 0.027) | 0.129 (± 0.013) | 0.75 | 0.145 |
| Carnitine | 0.546 (± 0.091) | 0.562 (± 0.033) | 1.03 | 0.845 |
| Taurine | 22.11 (± 1.937) | 16.01 (± 0.936) | 0.72 | 0.018 |
| Glycine | 0.572 (± 0.033) | 0.704 (± 0.082) | 1.23 | 0.282 |
| Creatine | 8.349 (± 0.937) | 6.051 (± 0.461) | 0.72 | 0.047 |
| Glycolic acid | 0.583 (± 0.026) | 0.572 (± 0.055) | 0.98 | 0.882 |
| Glucose | 0.218 (± 0.100) | 0.309 (± 0.061) | 1.42 | 0.438 |
| Fumerate | 0.085 (± 0.023) | 0.073 (± 0.012) | 0.86 | 0.622 |
| Tyrosine | 0.134 (± 0.068) | 0.036 (± 0.004) | 0.27 | 0.098 |
| Phenylalanine | 0.051 (± 0.005) | 0.043 (± 0.003) | 0.84 | 0.217 |
| Adenosine pool | 3.419 (± 0.357) | 2.808 (± 0.244) | 0.82 | 0.193 |
| NAD + NADH | 0.344 (± 0.093) | 0.360 (± 0.047) | 1.05 | 0.875 |
| Formate | 0.306 (± 0.015) | 0.300 (± 0.039) | 0.98 | 0.912 |
Data presented are given in μmol/g wet weight (mean ± SE), n = 3 for control and n = 5 for hibernating hearts. P-values for differences between the two groups were derived from unpaired t-tests (bold numbers highlight significant differences P < 0.05).
3.6. Network analysis
To enable an unbiased analysis at the network level, interactions within the transcriptomics data [7] were first visualized using Cytoscape (Fig. 6A). This analysis revealed 2 major clusters linked by transcription factor 4 and synphilin-1, a protein that is encoded by the SNCAIP gene and contains several protein–protein interaction domains, including an ATP/GTP-binding motif. The role of these genes in cardiac hibernation is currently unknown. The proteomic and metabolomic data were then combined with the transcriptomic data and analyzed at the pathway level either independently, or in combination using the systems biology analysis suite MetaCore™. Results are presented in Supplemental Table III. Although the protein changes were not always consistent with the mRNA changes, protein changes were in the same pathway as transcriptomic changes and both datasets contributed different focus molecules to the pathway analysis (Supplemental Figure 4). Consequently, the combination of the proteomic and transcriptomic dataset significantly improved the statistical confidence of the pathway analysis, with HIF-hypoxia-Akt signaling and glycolysis being the most significant (Fig. 6B). In addition, the combined transcriptomic and proteomic data pointed towards the activation of hydroxyproline production, a pivotal component of collagen synthesis, providing a direct link to cardiac remodeling. Adding the metabolite data did not increase the power of the analysis, as the corresponding metabolite concentrations, i.e., lactate, were kept relatively constant in the hibernating myocardium. “Cardiomyopathies” and “heart failure” were returned as the most prominent linked diseases based on the combined analysis using Metacore™.
Fig. 6.

Bioinformatic analysis. (A) An interaction matrix was constructed using Cytoscape software. The nodes of the differentially expressed transcripts fall into 2 major clusters linked by transcription factor 4 and SNCAIP. (B) For pathway analysis, the transcriptomic, proteomic and metabolomic datasets were combined using the MetaCore™ systems biology analysis suite. Collective bioinformatic interrogation of the 3 different -omic datasets improved the statistical significance (visualized as an increase in the -log (p-value)) and resulted in a rearrangement in the ranking of the top scoring pathways (Supplemental Table III).
4. Discussion
In the present study, a combined transcriptomic, proteomic and metabolomic approach has been conducted to provide a comprehensive analysis of molecular changes in a mouse model of chronic myocardial hibernation. The different analyses explored different aspects of cellular processes, i.e., microarrays interrogated the transcriptional signal whereas proteomics related to translational and post-translational mechanisms. Therefore, setting analytical considerations aside, differences between the datasets were not only inevitable but also critical in understanding the various aspects of cellular process mechanism and regulation. Interestingly, chronic hypoxia resulted in a pronounced myocardial response at the transcript and the protein level but relatively minor changes in the metabolome indicating that metabolic homeostasis is maintained by adaptive changes in the proteome and the transcriptome.
4.1. Integrated pathway analysis to combine “-omics” data
Biological systems are organized in scale-free networks [22]. The promise of systems biology is to characterize these networks and to finally predict their behavior. Despite the comprehensive coverage obtained by whole-genome microarray analysis, additional information can be gained by combining transcriptomic with proteomic data. As demonstrated in this study, proteomics contributed different focus molecules to the protein association networks and the p-value of the top-ranking HIF signaling pathway improved by 2 orders of magnitude in the combined analysis, even though HIF was not the top-ranking pathway in analysis based on the transcriptomic or the proteomic dataset separately. Moreover, proline metabolism and collagen metabolism, a key determinant for cardiac remodeling and cardiomyopathies, had the highest score in the proteomic dataset, but only ranked 22 based on the transcriptomic data. Thus, the bias of proteomics towards high abundant components resulted in a re-arrangement of the top scoring pathways with the final top 3 (HIF signaling, glycolysis/glycogenesis, proline and collagen metabolism) being in agreement with the observed reversible fibrosis in this mouse model of hibernation. On the other hand, conventional inference statistics attaches utmost importance to the biggest changes and the absence of a significant change, i.e., for glucose metabolites despite the induction of glycolytic enzymes, does not add to the pathway analysis whereas all that has been shown are differences in net concentrations at the time of measurement. An integrated assessment of enzymes and metabolites helps to highlight potential dynamic adaptations in flux or turnover, but falls short of a metabolic control and flux analysis, which requires a more detailed treatment with respect to definition of control and regulation of metabolism [22–24]. Potential pitfalls include stability and turnover of mRNA, rates of protein synthesis and degradation (peptide chain initiation and elongation as well as activities of the ubiquitin proteasome system and autophagy [7]), and rates of metabolite turnover (e.g., ATP turnover rates). Ultimately, a network of enzyme-catalyzed reactions and ion transport processes is the platform for the interplay of energetic, electrical, Ca2+ handling and contractile processes in the heart [25,26]. Without a systems-wide perspective, network behavior can be misinterpreted by relying on transcriptomic, proteomic or metabolomic readouts only.
4.2. Adaptive changes in glycolysis and myofilament phosphorylation
The hallmark of myocardial hibernation is the maintained viability of the dysfunctional hypoxic myocardium. Metabolic activity is sustained by a shift from fatty acid metabolism to glycolysis resulting in an increased glucose uptake with a corresponding accumulation of glycogen, a critical substrate for the ischemic heart [2]. HIF-1 represents a master switch in the metabolic and functional adaptation to chronic anaerobic conditions by stimulating glucose metabolism (through GLUT1) and angiogenesis (through VEGF). Upregulation of both HIF-target genes has previously been shown in the human hibernating myocardium [27]. While the recapitulation of known associations validates our approach, the transgenic mice allow us to study HIF-mediated metabolic adaptation without concomitant angiogenic effects. In chronically hibernating myocardium of pigs, persistent regional downregulation of mitochondrial enzymes and upregulation of stress proteins was reported, but no induction of glycolytic enzymes was observed after a 3- to 5-month period [6]. Our study confirms the repression of mitochondrial enzymes and upregulation of anti-oxidant and stress proteins. Compared to the former study in pigs [6], our transgenic mice were subject to shorter periods of ischemia and we report the induction of an early cardioprotective program characterized by an upregulation of glycolytic enzymes and transient induction of K(ATP) channels. We also measured cardiac metabolites rather than enzymatic activity [6] and demonstrated alterations in the phosphorylation state of myofilmant proteins. Importantly, basal phosphorylation of MLC2 plays a pivotal role in cardiac muscle contraction, and reduced phosphorylation may contribute to the self-protecting cessation of myocardial contraction during hibernation [28]. A decrease in both TnI and MLC2 phosphorylation correlated with enhanced Ca2+-responsiveness in human failing hearts, while phosphorylation of MLC1 and troponin T isoform expression was unaltered [29,30]. Thus, the cessation of contraction in hibernation is accompanied by a complex interplay between enzymatic changes and alterations in myofilament phosphorylation.
4.3. Adaptive changes in K(ATP) channels and energy metabolism
K(ATP) channels are unique nucleotide sensors that adjust membrane potential in response to intracellular metabolic oscillations. Kir6.2 and SUR2A are the pore-forming and regulatory subunits of the K(ATP) channel complex, respectively. Transition of the SUR subunit from the ATP to the ADP-liganded state promotes K+ permeation through Kir6.2 and defines K(ATP) channel activity, which serves a cardioprotective role under ischemic insult [31]. Our data extend these findings by implicating a temporary induction of these metabolic sensors in the cardiac adaptation to chronic hypoxia. Their subsequent suppression may be required for the transition into the maintenance phase of hibernation with reduced metabolic demand, which is supported by the reduction in GLUT1, a hypoxia marker, after administration of glibenclamide. It has previously been proposed that the response of hypoxia tolerant systems to oxygen lack occurs in two phases. The first lines of defense against hypoxia include a balanced suppression of ATP-demand and ATP-supply pathways; this regulation stabilizes (adenylates) at new steady-state levels even while ATP turnover rates greatly decline [32]. Adenosine kinase contributes to energy homeostasis by recovering AMP from adenosine and allows AMP to increase when ATP becomes depleted [33]. The downregulation of this salvage enzyme in hibernation may indicate loss of purines possibly with increased extracellular concentration of adenosine. The hydrolysis of AMP to adenosine has been shown to benefit tissue survival during ischemia by improving the free energy of ATP hydrolysis [34]. Moreover, inhibition of adenosine kinase was protective in a rat model of myocardial infarction [35]. Interestingly, a chain of adenylate kinase-catalyzed phosphotranfer reactions has been implicated in the communication of mitochondria-generated signals to K(ATP) channels [20]. Mitochondrial adenylate kinase 4, identified in this study, contributes to the phosphorylation of AMP, but can only use GTP or ITP as a substrate [36]. It has recently been demonstrated to interact with the mitochondrial inner membrane protein adenine nucleotide translocase, which might be important for its protective benefits under stress conditions [37]. On the other hand, creatine kinase is known to act as a spatial and temporal energy buffer and regulator of pH. Over-expression of the cardiac creatine transporter, however, failed to protect transgenic mice from heart failure despite achieving supraphysiological creatine levels [38]. In fact, the increase in the cardiac creatine content was associated with decreased glycolytic activity [39]. Thus, a reduced creatine pool might be an adaptive mechanism in response to chronic hypoxia [12]. Although the concept of homeostasis reaches far back into the history of experimental physiology [40,41], this is, to our knowledge, the first time that the net effect of hibernation on oxygen balance has been experimentally shown.
4.4. Limitations of the study
No technology can currently resolve the entire complexity of the mammalian proteome and metabolome. While shot-gun proteomic analyses can mine deeper into the proteome, DIGE allows the reliable quantification of differences as low as 10% in protein expression and visualizes the post-translational modifications of intact proteins as shift in isoelectric point or molecular weight. Membrane proteins, however, are not well represented by this technique. Despite a pronounced change in the transcription of the K(ATP) channel components, we were unable to detect K(ATP) channels on 2-DE gels. Furthermore, 1H-NMR, as employed in the present study, allows the quantification of the major stable metabolites in cardiac tissue extracts. 31P-NMR would allow the detection of labile cardiac energetic metabolites, such as phosphocreatine, ATP, inorganic phosphate and intracellular pH, to better clarify the degree of hypoxia.
4.5. Conclusions
In this study, we comprehensively analyze a conditional mouse model of myocardial hibernation by 3 independent “-omics” methodologies. We demonstrate how the integration of corresponding mRNA, protein and metabolite changes by network analysis aids in the identification of key biological pathways that underlie this important cardioprotective phenomenon. The combination of different “-omics” approaches will be indispensable for an integrated phenotyping of transgenic animals [12] and addressing the multiple facets of cardiovascular diseases in a systems biology approach.
5. Funding sources
This work was funded by the European Vascular Genomics Network (LSHM-CT-2003-503254; Brussels, B) as part of the 6th European Framework Programme and grants from the British Heart Foundation, and Oak Foundation. M.M. is supported by a Senior Research Fellowship of the British Heart Foundation.
6. Disclosures
There are no conflicts of interests to disclose.
Footnotes
Supplementary data to this article can be found online at doi:10.1016/j.yjmcc.2011.02.010.
Appendix A. Supplementary data
Supplemental Material
References
- 1.Rahimtoola S.H. The hibernating myocardium. Am. Heart J. 1989;117(1):211–221. doi: 10.1016/0002-8703(89)90685-6. [DOI] [PubMed] [Google Scholar]
- 2.Depre C., Vatner S.F. Mechanisms of cell survival in myocardial hibernation. Trends Cardiovasc. Med. 2005;15(3):101–110. doi: 10.1016/j.tcm.2005.04.006. [DOI] [PubMed] [Google Scholar]
- 3.Opie L.H. 4th ed. Lippincott Williams & Wilkins; Philadelphia: 2004. Heart physiology: from cell to circulation. [Google Scholar]
- 4.Heusch G., Schulz R., Rahimtoola S.H. Myocardial hibernation: a delicate balance. Am. J. Physiol. Heart Circ. Physiol. 2005;288(3):H984–H999. doi: 10.1152/ajpheart.01109.2004. [DOI] [PubMed] [Google Scholar]
- 5.Heusch G., Schulz R. The biology of myocardial hibernation. Trends Cardiovasc. Med. 2000;10(3):108–114. doi: 10.1016/s1050-1738(00)00058-x. [DOI] [PubMed] [Google Scholar]
- 6.Page B., Young R., Iyer V., Suzuki G., Lis M., Korotchkina L. Persistent regional downregulation in mitochondrial enzymes and upregulation of stress proteins in swine with chronic hibernating myocardium. Circ. Res. 2008;102(1):103–112. doi: 10.1161/CIRCRESAHA.107.155895. [DOI] [PubMed] [Google Scholar]
- 7.May D., Gilon D., Djonov V., Itin A., Lazarus A., Gordon O. Transgenic system for conditional induction and rescue of chronic myocardial hibernation provides insights into genomic programs of hibernation. Proc. Natl Acad. Sci. USA. 2008;105(1):282–287. doi: 10.1073/pnas.0707778105. [DOI] [PMC free article] [PubMed] [Google Scholar]
- 8.Mayr M., Metzler B., Chung Y.L., McGregor E., Mayr U., Troy H. Ischemic preconditioning exaggerates cardiac damage in PKC-delta null mice. Am. J. Physiol. Heart Circ. Physiol. 2004;287(2):H946–H956. doi: 10.1152/ajpheart.00878.2003. [DOI] [PubMed] [Google Scholar]
- 9.Mayr M., Chung Y.L., Mayr U., McGregor E., Troy H., Baier G. Loss of PKC-delta alters cardiac metabolism. Am. J. Physiol. Heart Circ. Physiol. 2004;287(2):H937–H945. doi: 10.1152/ajpheart.00877.2003. [DOI] [PubMed] [Google Scholar]
- 10.Mayr M., Liem D., Zhang J., Li X., Avliyakulov N.K., Yang J.I. Proteomic and metabolomic analysis of cardioprotection: interplay between protein kinase C epsilon and delta in regulating glucose metabolism of murine hearts. J. Mol. Cell. Cardiol. 2009;46(2):268–277. doi: 10.1016/j.yjmcc.2008.10.008. [DOI] [PMC free article] [PubMed] [Google Scholar]
- 11.Mayr M., Madhu B., Xu Q. Proteomics and metabolomics combined in cardiovascular research. Trends Cardiovasc. Med. 2007;17(2):43–48. doi: 10.1016/j.tcm.2006.11.004. [DOI] [PubMed] [Google Scholar]
- 12.Puntmann V.O., Mayr M. Phenotyping transgenic animals—an integrated readout of pathophysiology by combining proteomics and metabolomics with cardiovascular imaging. J. Mol. Cell. Cardiol. 2010;48(4):571–573. doi: 10.1016/j.yjmcc.2009.12.001. [DOI] [PubMed] [Google Scholar]
- 13.Mayr M., Siow R., Chung Y.L., Mayr U., Griffiths J.R., Xu Q. Proteomic and metabolomic analysis of vascular smooth muscle cells: role of PKCdelta. Circ. Res. 2004;94(10):e87–e96. doi: 10.1161/01.RES.0000131496.49135.1d. [DOI] [PubMed] [Google Scholar]
- 14.Taegtmeyer H., Sen S., Vela D. Return to the fetal gene program: a suggested metabolic link to gene expression in the heart. Ann. NY Acad. Sci. 2010;1188:191–198. doi: 10.1111/j.1749-6632.2009.05100.x. [DOI] [PMC free article] [PubMed] [Google Scholar]
- 15.van der Velden J., Merkus D., Klarenbeek B.R., James A.T., Boontje N.M., Dekkers D.H. Alterations in myofilament function contribute to left ventricular dysfunction in pigs early after myocardial infarction. Circ. Res. 2004;95(11):e85–e95. doi: 10.1161/01.RES.0000149531.02904.09. [DOI] [PubMed] [Google Scholar]
- 16.Rabilloud T., Heller M., Gasnier F., Luche S., Rey C., Aebersold R. Proteomics analysis of cellular response to oxidative stress. Evidence for in vivo overoxidation of peroxiredoxins at their active site. J. Biol. Chem. 2002;277(22):19396–19401. doi: 10.1074/jbc.M106585200. [DOI] [PubMed] [Google Scholar]
- 17.Mayr M., Chung Y.L., Mayr U., Yin X., Ly L., Troy H. Proteomic and metabolomic analyses of atherosclerotic vessels from apolipoprotein E-deficient mice reveal alterations in inflammation, oxidative stress, and energy metabolism. Arterioscler. Thromb. Vasc. Biol. 2005;25(10):2135–2142. doi: 10.1161/01.ATV.0000183928.25844.f6. [DOI] [PubMed] [Google Scholar]
- 18.Dhar-Chowdhury P., Harrell M.D., Han S.Y., Jankowska D., Parachuru L., Morrissey A. The glycolytic enzymes, glyceraldehyde-3-phosphate dehydrogenase, triose-phosphate isomerase, and pyruvate kinase are components of the K(ATP) channel macromolecular complex and regulate its function. J. Biol. Chem. 2005;280(46):38464–38470. doi: 10.1074/jbc.M508744200. [DOI] [PMC free article] [PubMed] [Google Scholar]
- 19.Jovanovic S., Du Q., Crawford R.M., Budas G.R., Stagljar I., Jovanovic A. Glyceraldehyde 3-phosphate dehydrogenase serves as an accessory protein of the cardiac sarcolemmal K(ATP) channel. EMBO Rep. 2005;6(9):848–852. doi: 10.1038/sj.embor.7400489. [DOI] [PMC free article] [PubMed] [Google Scholar]
- 20.Carrasco A.J., Dzeja P.P., Alekseev A.E., Pucar D., Zingman L.V., Abraham M.R. Adenylate kinase phosphotransfer communicates cellular energetic signals to ATP-sensitive potassium channels. Proc. Natl Acad. Sci. USA. 2001;98(13):7623–7628. doi: 10.1073/pnas.121038198. [DOI] [PMC free article] [PubMed] [Google Scholar]
- 21.Rumsey W.L., Abbott B., Bertelsen D., Mallamaci M., Hagan K., Nelson D. Adaptation to hypoxia alters energy metabolism in rat heart. Am. J. Physiol. 1999;276(1 Pt 2):H71–H80. doi: 10.1152/ajpheart.1999.276.1.H71. [DOI] [PubMed] [Google Scholar]
- 22.Fell D. 1st ed. Portland Press; London: 1996. Understanding the control of metabolism. [Google Scholar]
- 23.Chance B., Williams G.R. The respiratory chain and oxidative phosphorylation. Adv. Enzymol. Relat. Subj. Biochem. 1956;17:65–134. doi: 10.1002/9780470122624.ch2. [DOI] [PubMed] [Google Scholar]
- 24.Chance B., Williams G.R. Respiratory enzymes in oxidative phosphorylation. VI. The effects of adenosine diphosphate on azide-treated mitochondria. J Biol Chem. 1956;221(1):477–489. [PubMed] [Google Scholar]
- 25.Balaban R.S. Cardiac energy metabolism homeostasis: role of cytosolic calcium. J. Mol. Cell. Cardiol. 2002;34(10):1259–1271. doi: 10.1006/jmcc.2002.2082. [DOI] [PubMed] [Google Scholar]
- 26.Cortassa S., O'Rourke B., Winslow R.L., Aon M.A. Control and regulation of mitochondrial energetics in an integrated model of cardiomyocyte function. Biophys. J. 2009;96(6):2466–2478. doi: 10.1016/j.bpj.2008.12.3893. [DOI] [PMC free article] [PubMed] [Google Scholar]
- 27.Depre C., Kim S.J., John A.S., Huang Y., Rimoldi O.E., Pepper J.R. Program of cell survival underlying human and experimental hibernating myocardium. Circ. Res. 2004;95(4):433–440. doi: 10.1161/01.RES.0000138301.42713.18. [DOI] [PubMed] [Google Scholar]
- 28.Olsson M.C., Patel J.R., Fitzsimons D.P., Walker J.W., Moss R.L. Basal myosin light chain phosphorylation is a determinant of Ca2+ sensitivity of force and activation dependence of the kinetics of myocardial force development. Am. J. Physiol. Heart Circ. Physiol. 2004;287(6):H2712–H2718. doi: 10.1152/ajpheart.01067.2003. [DOI] [PubMed] [Google Scholar]
- 29.Schillinger W., Kogler H. Altered phosphorylation and Ca2+-sensitivity of myofilaments in human heart failure. Cardiovasc. Res. 2003;57(1):5–7. doi: 10.1016/s0008-6363(02)00743-5. [DOI] [PubMed] [Google Scholar]
- 30.van der Velden J., Papp Z., Zaremba R., Boontje N.M., de Jong J.W., Owen V.J. Increased Ca2+-sensitivity of the contractile apparatus in end-stage human heart failure results from altered phosphorylation of contractile proteins. Cardiovasc. Res. 2003;57(1):37–47. doi: 10.1016/s0008-6363(02)00606-5. [DOI] [PubMed] [Google Scholar]
- 31.Kane G.C., Liu X.K., Yamada S., Olson T.M., Terzic A. Cardiac KATP channels in health and disease. J. Mol. Cell. Cardiol. 2005;38(6):937–943. doi: 10.1016/j.yjmcc.2005.02.026. [DOI] [PMC free article] [PubMed] [Google Scholar]
- 32.Hochachka P.W., Buck L.T., Doll C.J., Land S.C. Unifying theory of hypoxia tolerance: molecular/metabolic defense and rescue mechanisms for surviving oxygen lack. Proc. Natl Acad. Sci. USA. 1996;93(18):9493–9498. doi: 10.1073/pnas.93.18.9493. [DOI] [PMC free article] [PubMed] [Google Scholar]
- 33.Kroll K., Decking U.K., Dreikorn K., Schrader J. Rapid turnover of the AMP-adenosine metabolic cycle in the guinea pig heart. Circ. Res. 1993;73(5):846–856. doi: 10.1161/01.res.73.5.846. [DOI] [PubMed] [Google Scholar]
- 34.Kroll K., Kinzie D.J., Gustafson L.A. Open-system kinetics of myocardial phosphoenergetics during coronary underperfusion. Am. J. Physiol. 1997;272(6 Pt 2):H2563–H2576. doi: 10.1152/ajpheart.1997.272.6.H2563. [DOI] [PubMed] [Google Scholar]
- 35.Peart J.N., Gross G.J. Cardioprotection following adenosine kinase inhibition in rat hearts. Basic Res. Cardiol. 2005;100(4):328–336. doi: 10.1007/s00395-005-0526-7. [DOI] [PubMed] [Google Scholar]
- 36.Wieland B., Tomasselli A.G., Noda L.H., Frank R., Schulz G.E. The amino acid sequence of GTP:AMP phosphotransferase from beef-heart mitochondria. Extensive homology with cytosolic adenylate kinase. Eur. J. Biochem. 1984;143(2):331–339. doi: 10.1111/j.1432-1033.1984.tb08376.x. [DOI] [PubMed] [Google Scholar]
- 37.Liu R., Strom A.L., Zhai J., Gal J., Bao S., Gong W. Enzymatically inactive adenylate kinase 4 interacts with mitochondrial ADP/ATP translocase. Int. J. Biochem. Cell Biol. 2009;41(6):1371–1380. doi: 10.1016/j.biocel.2008.12.002. [DOI] [PMC free article] [PubMed] [Google Scholar]
- 38.Wallis J., Lygate C.A., Fischer A., ten Hove M., Schneider J.E., Sebag-Montefiore L. Supranormal myocardial creatine and phosphocreatine concentrations lead to cardiac hypertrophy and heart failure: insights from creatine transporter-overexpressing transgenic mice. Circulation. 2005;112(20):3131–3139. doi: 10.1161/CIRCULATIONAHA.105.572990. [DOI] [PubMed] [Google Scholar]
- 39.Phillips D., Ten Hove M., Schneider J.E., Wu C.O., Sebag-Montefiore L., Aponte A.M. Mice over-expressing the myocardial creatine transporter develop progressive heart failure and show decreased glycolytic capacity. J. Mol. Cell. Cardiol. 2010;48(4):582–590. doi: 10.1016/j.yjmcc.2009.10.033. [DOI] [PMC free article] [PubMed] [Google Scholar]
- 40.Cannon W.A. On the variation of the oxygen content of cultural solutions. Science. 1932;75(1934):108–109. doi: 10.1126/science.75.1934.108-a. [DOI] [PubMed] [Google Scholar]
- 41.Schoenheimer R., Rittenberg D. The application of isotopes to the study of intermediary metabolism. Science. 1938;87(2254):221–226. doi: 10.1126/science.87.2254.221. [DOI] [PubMed] [Google Scholar]
Associated Data
This section collects any data citations, data availability statements, or supplementary materials included in this article.
Supplementary Materials
Supplemental Material