

Abstract
We have constructed a complete coverage BAC contig map that spans a 12-Mb genomic segment in the human chromosome 16p13.1–p11.2 region. The map consists of 68 previously mapped STSs and 289 BAC clones, 51 of which—corresponding to a total of 7.721 Mb of genomic DNA—have been sequenced, and provides a high resolution physical map of the region. Contigs were initially built based mainly on the analysis of STS contents and restriction fingerprint patterns of the clones. To close the gaps, probes derived from BAC clone ends were used to screen deeper BAC libraries. Clone end sequence data obtained from chromosome 16-specific BACs, as well as from public databases, were used for the identification of BACs that overlap with fully sequenced BACs by means of sequence match. This approach allowed precise alignment of clone overlaps in addition to restriction fingerprint comparison. A freehand contig drawing software tool was developed and used to manage the map data graphically and generate a real scale physical map. The map we present here is ∼3.5 × deep and provides a minimal tiling path that covers the region in an array of contigous, overlapping BACs.
A major goal of the Human Genome Project is to provide a complete sequence of the human genome with an accuracy of >99.99% and a high degree of contiguity (Collins et al. 1998). Currently prevailing methods for large-scale genome sequencing include the clone-based approach in which contigs based usually on large insert clones such as BACs are established prior to the initiation of sequencing. The contigs are used for the selection of minimally overlapping clones that are to be sequenced. Alternatively, a set of nonoverlapping or minimally overlapping BACs that have been mapped to target chromosomal loci are selected and shotgun sequenced, leaving the sequence gaps between the clones to be closed by identifying and sequencing additional clones. Restriction fingerprint analysis has been serving an important tool for the detection and quantification of clone overlaps (Coulson et al. 1986; Olson et al. 1986; Sulston et al. 1988, 1989). Recently, a new scheme has been proposed for rapid detection and quantification of BAC overlaps by means of sequence matches using the end sequences generated from a sufficiently large number of BACs that serve as sequence-tagged connectors (STCs) (Venter et al. 1996). In this approach, initiation of sequencing of a large genomic region is not dependent on the completion of a high-quality contig map. Rather, development of physical contig maps and sequencing BAC clones work synergistically, allowing for the early initiation of sequencing on selected BACs. This requires the availability of annotated BAC libraries in which the majority of the clones are tagged with end sequences.
The project was initiated as a part of a publicly funded program to map and sequence large chromosomal regions in human. The centromeric half of human chromosome 16p(13.1–11.2) spans ∼20 Mb, includes the 16pCEN as well as the pericentromeric regions, and contains at least 162 expressed sequences (NCBI: GENEMAP98 at http://www.ncbi.nlm.nih.gov/genemap/) that are both biologically and clinically interesting (Mitchison et al. 1993; Stallings et al. 1993; European Polycystic Kindney Disease Consortium 1994; Liu et al. 1996; Dissing et al. 1998). A high-resolution YAC-based STS map is available for chromosome 16 (Doggett et al. 1995). Mapped STS markers facilitated initial access to BAC libaries to identify BACs corresponding to the target region. A set of nonoverlapping BACs identified by screening BAC libraries with the STSs were subjected to shotgun sequencing prior to the completion of the map (Loftus et al. 1999) The sequence data were used for the subsequent contig extension and gap closure based on the sequence matches with BAC end sequences that permit precise alignment of clone overlaps. Here we present a complete coverage BAC contig map spanning 12 Mb, drawn to scale, which provides a high-resolution roadmap for physical and genetic markers and for the complete sequencing of this region.
RESULTS
Initial Framework Contigs
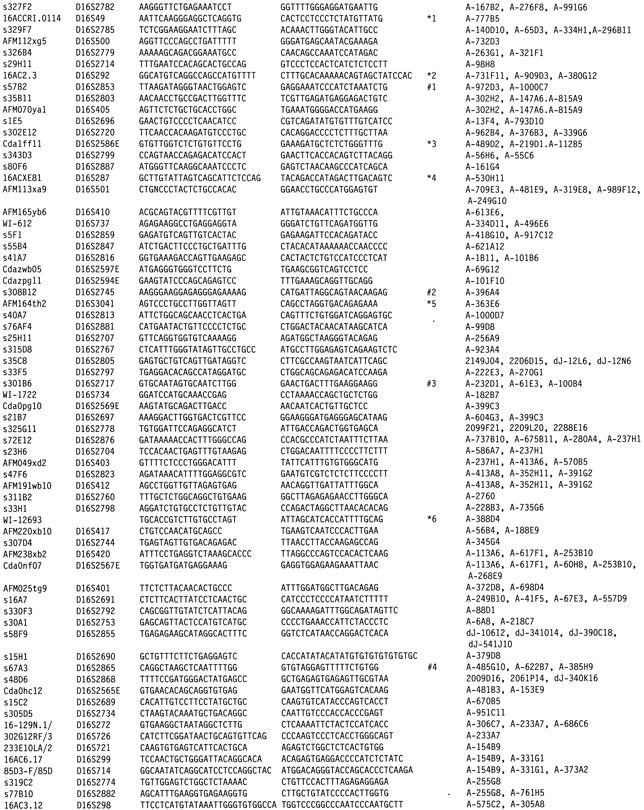
The goal of the project was to generate a BAC contig map with complete coverage of the 16p13.1–11.2 region and provide a minimally redundant BAC set for sequencing. The initial set of BACs were identified using 68 STS markers (Table 1) mapped to the target region by the previous YAC-based mapping (Doggett et al. 1995). These markers are concentrated in ∼15 Mb of the target region excluding the centromere and pericentric regions that are poorly covered by STS markers. Pooled human library A was screened using the PCR method as described previously (Kim et al. 1996). A total of 175 positive BACs were identified from the 3.5 × library A. For some STSs that failed to yield positives from PCR–STS screening (D16S732, D16S407, D16S2899, D16S2719, D16S414, D16S497, D16S2893, D16S2828, D16S741, D16S774, D16S519, D16S2746, D16S2852, D16S2891, D16S780, D16S2881, D16S2805, D16S2778, D16S2855, D16S2868, D16S2734), gel-isolated PCR products were used as probes for screening other libraries. As a result, additional BACs including 15 from library D and 49 from the Rosewell Park Cancer Institute (RPCI) library were identified. Inserts were isolated from the initial positive clones by NotI digestion and separation on preparative pulsed field gels for use as probes for further library screening. High-density colony filters were prepared for library BC and D (a synopsis of Caltech BAC libraries is provided on the web site http://www.tree.caltech.edu/lib_status.html) using the Q-Bot robotic work station.
Table 1.
Sixty-Eight (68) STS Markers and Corresponding BAC Clones in the Contig Map
 |
Clone Characterization
All of the clones identified by PCR screening or colony hybridization were picked from the arrayed libraries, streaked on plates for single colony isolation, and characterized by HindIII digestion, sizing, restriction fingerprinting, and clone end sequencing, as described in Methods. At least two single colonies were isolated from each positive BAC and tested for consistency in their HindIII digestion patterns to avoid clone mixtures that occasionally occur in arrayed libraries. Highly unstable clones also showed inconsistencies among different single colonies due to rapid rearangement or degradation. Of the BACs characterized thus far, ∼4% were shown to be unstable (not shown). DNA preparation is often difficult and unsuccessful for some of these unstable BACs due to the partial or complete loss of clones. Chromosomal localization of a total of 76 clones was confirmed by FISH analysis. These BACs, which were FISH mapped to the expected regions, served as anchors for the localization of the associated contigs. A complete list of BACs identified by STS–PCR screening is posted on http://www.tree.caltech.edu/chr16BAC_STS_map.html. Overlaps between clones were determined based on STS contents and restriction fingerprint analysis. A set of nonoverlapping or minimally overlapping BACs was selected from these contigs for sequencing at TIGR (Loftus et al. 1999). BAC end sequence data obtained from chromosome 16-specific BACs and from random BACs from libraries constructed at Caltech and RPCI were used to precisely align the clone overlaps against the completely sequenced BACs through sequence match. Figures 1 and 2 represent examples of the fingerprint gel analysis image and the sequence alignment between a BAC sequence and BAC end sequences, respectively.
Figure 1.
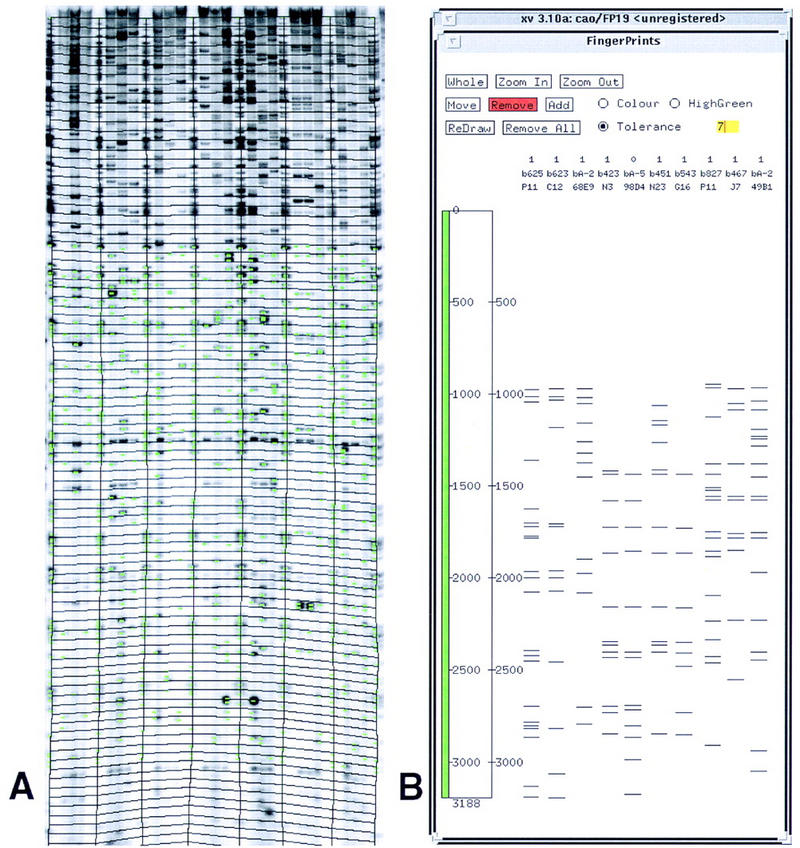
(A) An example of a digitized restriction fingerprint gel image obtained from a polyacrylamide-based slab gel. Image-2.1 was used for the analysis of the gel. Green lines superimposed on the gel image correspond to the gel bands (bars) detected by the software. (B) FPC-2.5 was used for the analysis and comparison of restriction fragment patterns.
Figure 2.

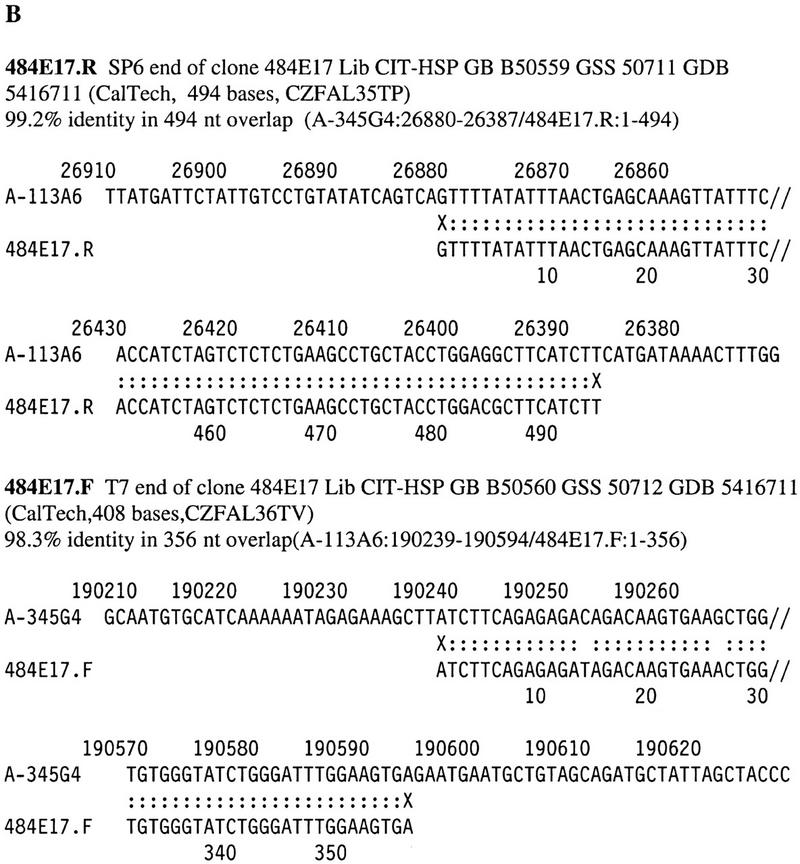
Examples of end sequence matches with completely sequenced BACs.
Library Walking and Gap Closure
Seventy-seven OVERGO probes derived from BAC end sequences were used for further library screening (Table 2) . A total of 20× coverage Caltech libraries and the 12× human BAC library (RPCI-11) from RPCI (http://bacpac.med.buffalo.edu) were used for library walking. Approximately 5000 BACs were identified in the initial screening and library walking. This represents BAC coverage of the region in ∼40× redundancy given that the average insert size of BACs is ∼130 kb. However, we estimate that nearly 50% of these BACs are false positives resulting from screening errors due to nonspecific hybridization between repetitive elements as suggested by FISH localization of some of the BACs as well as other data (not shown). Newly identified BACs were positioned on the map relative to the initial BACs according to the overlaps determined by using end sequences as well as restriction fingerprint data. Table 3 lists BACs that overlapped with corresponding sequenced BACs based on the sequence matches. Repetitive sequences were suppressed by masking known repeats in BAC end sequences prior to the sequence match using the cross_match program provided by Dr. Phil Green (University of Washington, Seattle, WA); at least 95% matches with >100 bp contiguity were selected. Each of the sequence matches was inspected visually, and the overlaps verified by other methods such as restriction fingerprint comparison. Some of the false matches due to repetitive sequences that escaped the masking process were eliminated by restriction fingerprint analysis. Figure 3 represents the final map after gap closure. Although the contig consists of >2000 BACs that were verified and could be placed on the map accurately, most of the redundant clones were not shown in the current map for the sake of clarity and to make map drawing more accurate. All of the supporting data for mapping and clone overlaps, including sequence alignment results and restriction fingerprint gels ideograms, are available from our web site (http://www.tree.caltech.edu).
Table 2.
List of BAC End-Specific OVERGO Primers for Library Walking
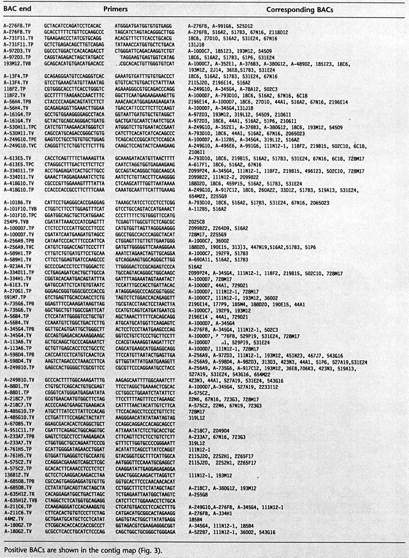 |
Table 3.
List of BAC Ends Determined to Overlap with Completely Sequenced BAC by Sequence Match
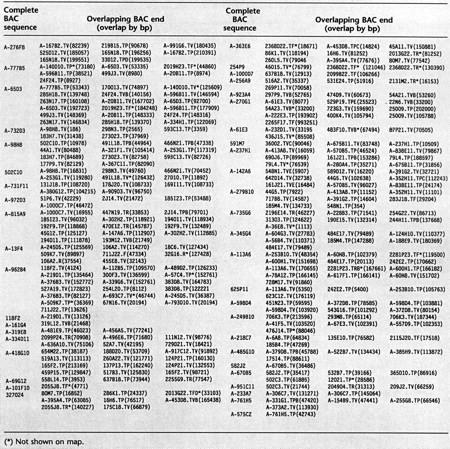 |
Figure 3.
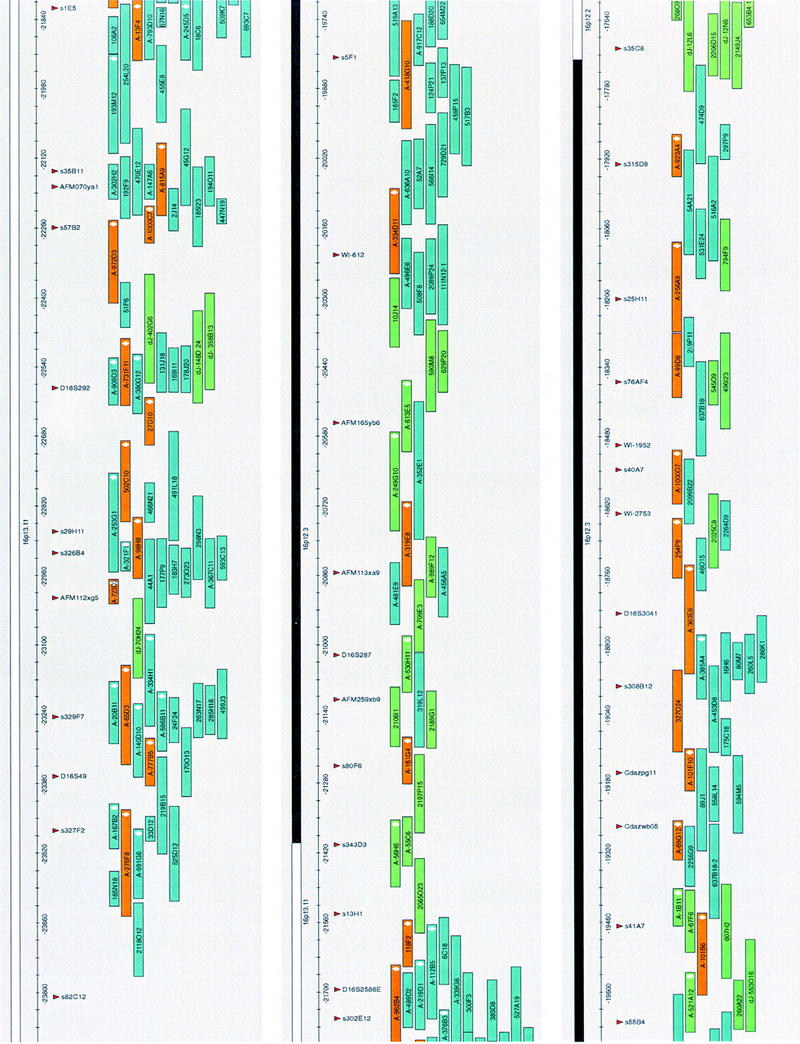
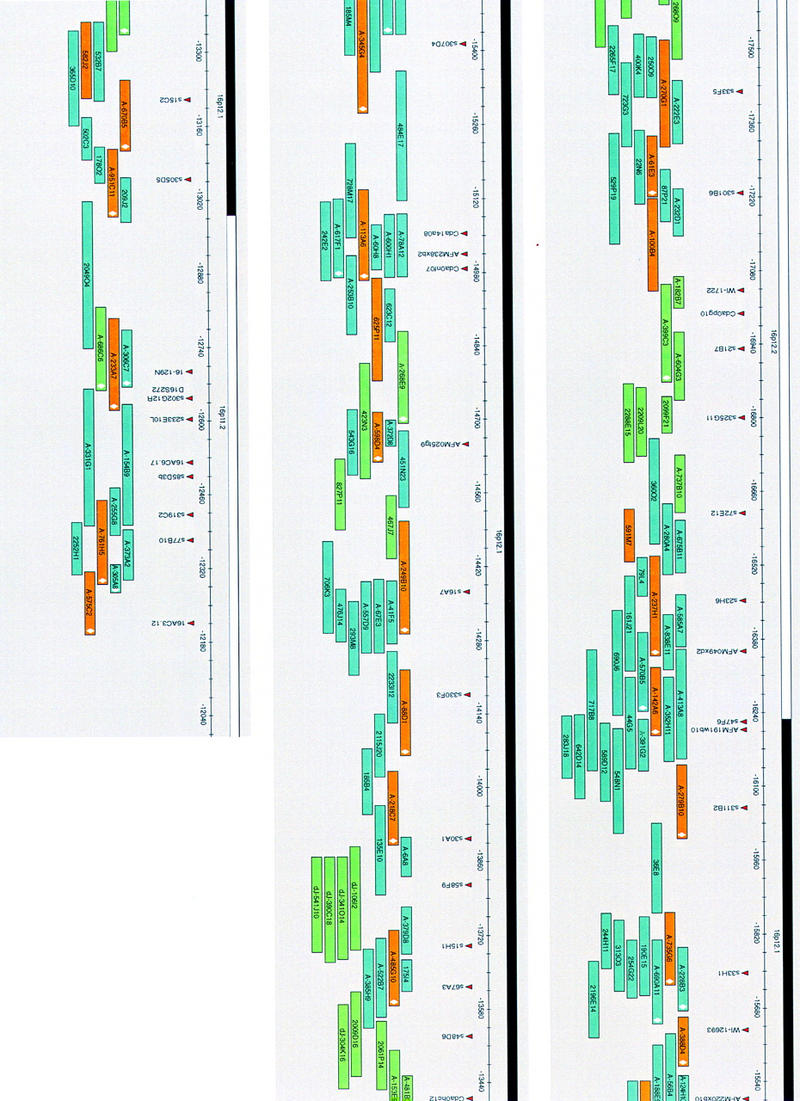
A complete coverage, sequence-ready BAC contig in the chromosome 16p(13.1–11.2) region. The map is drawn to scale in AceDraw window; each map unit corresponds to 1 kb of DNA. Only the minimal set of confirmed BACs is shown. Fifty-one clones (orange) were sequenced completely; 183 clones (blue) were aligned with the completely sequenced clones by end sequence matches; 55 clones (green) were assembled into the contig based on restriction fingerprint analysis. All of the clones have been sized and fingerprinted. A total of 76 BACs (white diamond) within the clone boxes were FISH mapped and provided anchor points to ensure that BAC clusters are on the correct chromosomal loci.
Contig Assembly and Map Drawing
Clones and contigs were placed on the map using the computer software tool AceDraw, which was designed for the organization and management of mapping data and easy map drawing (L. Tang, J. Boulton, B. Liau, H. Zhang, W. Qin, S.H. Huh, X. Xu, Y. Cao, G.A. George, and U.-J. Kim, in prep.; introduction, detailed specification and user manual, and source codes are available from http://www.ugcs.caltech.edu/∼genome). Briefly, the program is written C++ for the Unix operating system and allows for freehand drawing of physical contig maps consisting of clones, markers, and other indicators in real scale. The graphic maps thus generated by AceDraw can be dumped into formats that are adequate for porting the map to other databases including AceDB. AceDraw is also able to read AceDB dump files for a graphic display of map data. By using Ace Draw, the map (Fig. 3) has been drawn to scale based on the size of the clones, the extent of clone overlaps deduced from sequence matches and fingerprint analysis data, and the order of the markers. Fifty-one BAC sequences were used for sequence matches to align overlapping clones precisely (Fig. 2). The contig consists of 289 BACs with an average insert size of 140 kb that were anchored by 76 BACs embedded in the contig, which have been localized by FISH to relevant loci on the 16p arm. The sequence data from the 51 completely sequenced BACs contain genes and STS markers that have been mapped to this region, confirming the origin of BACs. The order and distribution of STSs in this map is in good agreement with previous YAC–STS maps (e.g., Doggett et al. 1995). Figure 4 summarizes the comparison of the orders and physical spacing of the STSs between the BAC map and the YAC-based map. The overall agreement in the physical organization of the markers suggests that there is no significant gap or internal deletions in clones in either the YACs or the BACs on which the maps were built. The orders of 63 of 67 STS pairs are conserved in both maps. Four minor changes in the local orders of STS pairs may be attributed to the difference in resolution between the two maps.
Figure 4.
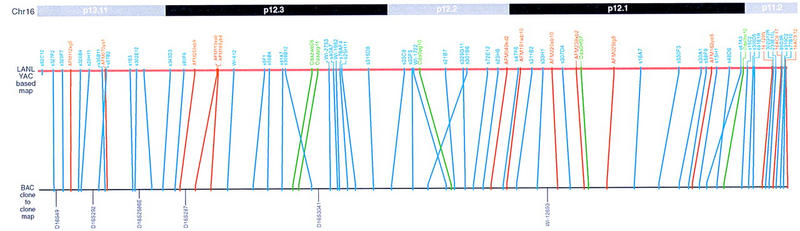
Comparison of the order of STSs in the BAC-based physical map with the order of the same set of STSs in the previously constructed YAC-based map.
DISCUSSION
An important problem in genome characterization and sequencing is to provide efficient access to the genomic clones that represent faithful copies of the DNA originated from the region of interest. Identification of a clone or a cluster of clones covering a targeted genomic region is required for physical map development, positional cloning and gene characterization, and large-scale genome sequencing. BACs maintain large genomic DNA inserts with high stability (Kim et al. 1992; Shizuya et al. 1992) and provide reliable templates for accurate genome sequencing. The relatively large insert size makes BACs suitable for large-scale physical map development and sequencing. Deep libraries based on genomic DNA fragments generated by different restriction enzymes and methods are crucial for the development of complete coverage contigs over large genomic regions.
Chromosome 16 was chosen for map development primarily due to the availability of STS markers that were mapped via previous YAC–STS mapping. Mapped STSs are invaluable for accessing the libraries in the beginning. However, the resolution and density of the markers in currently available physical maps are not sufficient for the development of full coverage contig maps. Incremental time-consuming processes such as new marker development and repeated library walking, as well as clone characterization and comparison, are required for contig extension and gap closure. Contig extension and gap closure would be significantly more time consuming in a region poorly covered by STSs or other markers. In the course of BAC contig construction in our target chromosomal region, we have demonstrated the utility of BAC end sequences as an efficient resource for rapid and precise clone alignment against available sequence contigs such as fully determined BAC sequences. Despite the relatively high density of STSs in the region (1 marker/164 kb of DNA), >24 gaps in the initial map, required repeated screening of libraries to identify additional BACs for the closure. End sequences were determined from all of the BACs identified througout the project. These and other end sequences from public repositories were used for the determination of the overlaps with the sequences of the “seed” BACs that were being sequenced concurrently in parallel with the map development. In retrospect, a sufficiently deep BAC library with known clone end sequences would have facilitated our map construction dramatically by reducing incremental efforts for repeated library walking and clone characterization. Such end sequence annotated resources are currently becoming available (Kelley et al. 1999; http://www.ornl.gov/meetings/bacpac/95bac.html).
Genomes of higher organisms contain myriad repetitive sequences, which differ widely in length and copy number. Previous analyses of chromosome 16 indicated the presence of large duplicated sequence blocks (European Polycyctic Kidney Disease Consortium 1994; Dissing et al. 1998). Recent analysis of DNA sequences from 51 BACs in this contig, which correspond to a total of 7221 kb of genomic sequence, revealed the presence of large, highly conserved sequence blocks in this region (Loftus et al. 1999). These sequences occur in multiple genomic loci and, in some case, can be considerable obstacles to localization and mapping of clones or contigs. FISH data from individual BACs provide an overview of the localization of the clones, as well as the presence of repeat sequences in the clones. Table 4 lists BACs that display positive FISH signals on multiple chromosomal loci. In particular, A-13F4 carries two pairs of large duplicons that appear to occur on both chromosome 16p and 16q arms. A number of STS sequence duplications dispersed throughout the region were also identified from sequence data analysis. These clones were assembled into a current contig on the basis of contextual data such as overlaps with other confirmed clones in the contig. Because of the presence of repeats, BAC end sequence matches often resulted in false alignments. Restriction fingerprint pattern analysis proved critical for the confirmation of true overlaps in many instances.
Table 4.
BACs with Positive FISH Signals on Multiple Chromosomal Loci
| BAC | Band position | Positive STS | Additional FISH signals | Possible reason (sequences) |
|---|---|---|---|---|
| A-321F1 | 16p13.1 | D16S2779 | 1p34 | duplicated |
| A-29B12* | 16p13.1 | D16S2779 | 1p34 | duplicated |
| A-98H8 | 16p13.1 | D16S2714 | 11q23 | duplicated |
| A-972D3 | 16p13.1 | D16S2853 | random multiple loci | |
| A-219D1 | 16p13.1 | D16S2586E | 16p11.2 | duplicated |
| A-319E8 | 16p13.1, | D16S501 | 2q11.2 | duplicated |
| A-589H1** | 16p13.1-12 | D16S2794 | 16p11.2 | |
| A-376B3 | 16p12.3/13.13 | D16S2720 | 16p11.2 | duplicated |
| A-962B4 | 16p12/13.1 | D16S2586E/D16S2720 | 16p11.2 | duplicated |
| A-13F4 | 16p12-13.2 | D16S2696 | 16p11.2, 16q23 | duplicated |
| A-685D8* | 16p12-13.2 | D16S2696/D16S2794 | 16p11.2, 16q23 | duplicated |
| A-793D10 | 16p12/13.1 | D16S2696 | 16p11.2, 16q22 | duplicated |
| A-613E5 | 16p12/13.1 | D16S410 | 16p11.2 | duplicated |
| A-61E3 | 16p12-13.1 | D16S2717 | 16q22, 16q24, 16p11.2-12 | duplicated |
| A-101B6 | 16p11.2 | D16S2816 | pericentromeric signals on most chromosomes, strongest at 2p11.1 & 16p11.1 | repetitive |
| A-761H5 | 16p11.2 | D16S2882 | 16p13.1 | duplicated |
| A-575C2 | 16p11.2 | D16S298 | 16p13.1 | duplicated |
| 67N16 | 16p11.1 | 16p12-13.1, 16p13.3, 16q22 | duplicated | |
| A-280B4 | 16p11.1-p12 | 16q11.2 | duplicated | |
| A-1B11 | 16p11.1 | D16S2816 | all centromeres & 2p11.1 | repetitive |
(*) Not used in contig map.
(**) This clone should be located in c16p11.1.
Currently the contig map is being used to select BACs that cover sequence gaps. These BACs are to be sequenced at the Joint Genome Institute to achieve a 12-Mb contiguity in DNA sequence in this region. Our mapping approach will provide a model system for integrated large-scale genome mapping and sequencing in other human genomic regions and the genomes of other organisms.
METHODS
BAC Library Screening
Caltech BAC libraries are discussed in our web site (http://www.tree.caltech.edu) and were used for screening by hybridization as described previously (Kim et al. 1995); RPCI 11 human library segments 1 and 2 corresponding to 12× genome coverage along with high-density filters were purchased from Dr. Peter de Jong’s laboratory at RPCI (Buffalo NY).
BAC Clone Characterization
Single colonies were isolated from each positive BAC by streaking on agar plates. Clone culture, DNA preparation, and other standard procedures for BAC clone manipulation were performed as described previously (Kim et al. 1996). At least two single colonies were selected from each clone, grown, and the DNA samples prepared and tested for their consistency in HindIII digestion pattern on agarose gels, as well as the presence of the expected STS markers. Each single colony was kept frozen in glycerol stocks in microtiter plates until further use. BAC end sequencing was performed using miniprep DNA prepared by Autogen 740 automated miniprep machines directly as templates as described elsewhere (Kelley et al. 1999). FISH mapping was performed using miniprep DNA as described previously (Baldini et al. 1994; Weier et al. 1995). The insert sizes of the BAC clones were determined by digesting miniprep DNA with NotI and running on pulsed-field gels.
Restriction Fingerprinting Analysis
BAC DNA samples prepared by Autogen 740 were double digested with BanI and MspI (New England Biolabs, Beverly, MA) in the presence of RNase I as described previously (Kim et al. 1995). After ethanol precipitation, the fragments were end labeled by [α32P]dATP using AMV-reverse transcriptase (U.S. Biochemical, Cleveland, OH). Restriction fragments were resolved on commercial precast sequencing gels (4.5% polyacrylamide, 1× TBE, 7 m urea; Stratagene, La Jolla, CA). HinfI-digested λ DNAs were used as markers after end labeling with AMV-reverse transciptase. BanI–MspI fragments from A-334D11 were run on every gel as an internal control to gauge the consistency in electrophoretic behavior of individual gels. Digital gel images were obtained by scanning through a PhosophorImager (Molecular Dynamics, Sunnyvale, CA) and processed using the gel image analysis program (Image-2.5) available from the Sanger Center (http://www.sanger.ac.uk).
Designing BAC End-Specific OVERGOes and Library Walking
OVERGO primer pairs (J. McPherson, pers. comm.; http://www.tree.caltech.edu/protocols/overgo.html) were designed from BAC end sequences. BAC inserts were isolated by NotI or HindIII digestion of the BACs, resolved on 1% low-melting-point pulsed-field agarose gels, and excised of bands after ethidium bromide staining. DNA fragments were extracted from the gel by phenol extraction with 200 μl of buffer-saturated phenol, 200 μl of buffer-saturated phenol/chloroform, and ethanol precipitation. DNA pellets were dissolved in distilled water and labeled by random hexamer labeling kit (Boehringer Mannheim, Indianapolis, IN) as specified by the vendor. Complete details of the protocols for the entire experiments, including high-density filter hybridization, are available from the Caltech web site.
Sequence Match
BAC end sequences were determined for all of the candidate chromosome 16 BACs and the majority of Caltech BAC library D and other human BAC libraries (http://www.ornl.gov/meetings/bacpac/95bac.html). These data are available from the BAC end sequence database at TIGR (http://tigr.org/tdb/human/bac_end_search/bac_end_info.html). All currently known human repetitive elements in BAC end sequences were masked using the cross_match program prior to searching for homologies against the individual BAC sequences with a web-based sequence match program available at TIGR (http://www.tigr.org/tdb/humgen/bac_end_search/bac_end_search.html) and GenBank. A minimum of 95% homologies were accepted as sequence matches. Putative overlaps detected by sequence matches were further verified by analyzing restriction fingerprint patterns and STS contents of BACs.
Contig Assembly and Map Drawing
Restriction fingerprint data extracted from gels by Image-2.1 were analyzed using contigC and FPC-2.5 developed at the Sanger Centre (Soderlund and Longden 1996; Gregory 1997). The BACs in the initial framework contig clones served as anchors on which new clones were aligned according to the sequence matches and/or fingerprint data. The resulting physical map was drawn with AceDraw (developed at Caltech). The Caltech website also provides experimental data for each of the clones and clone-to-clone relationships.
Acknowledgments
We thank Dr. Phil Green for providing us with sequence analysis softwares. This work has been supported by National Human Genome Research Institute grant HG01464-01 awarded to M.D.A. and U.J.K. N.A.D. was supported by U.S. Department of Energy contract W-7405-ENG-36.
The publication costs of this article were defrayed in part by payment of page charges. This article must therefore be hereby marked “advertisement” in accordance with 18 USC section 1734 solely to indicate this fact.
Footnotes
E-mail ung@caltech.edu; FAX (626) 796-7066.
REFERENCES
- Baldini A, Lindsay EA. Mapping human YAC clones by fluorescence in situ hybridization using Alu-PCR from single yeast colonies. In: Choo KHA, editor. In situ hybridization protocols Methods in molecular biology. Vol. 33. Clifton, NJ: Humana Press; 1994. pp. 75–85. [DOI] [PubMed] [Google Scholar]
- Collins FS, Patrinos A, Jordan E, Chakravarti A, Gesteland R, Walter L the members of DOE and NIH planning groups. New goals for the U.S. Human Genome Project: 1998–2003. Science. 1998;282:682–689. doi: 10.1126/science.282.5389.682. [DOI] [PubMed] [Google Scholar]
- Coulson A, Sulston J, Brenner S, Karn J. Toward a physical map of the genome of the nematode Caenorhapditis elegans. Proc Natl Acad Sci. 1986;83:7821–7825. doi: 10.1073/pnas.83.20.7821. [DOI] [PMC free article] [PubMed] [Google Scholar]
- Dissing M, Le Beau MM, Pedersen-Bjergaard J. Inversion of chromosome 16 and uncommon rearrangements of the CBFB and MYH11 genes in therapy-related acute myeloid leukemia: rare events related to DNA-topoisomerase II inhibitors? J Clin Oncol. 1998;16:1890–1896. doi: 10.1200/JCO.1998.16.5.1890. [DOI] [PubMed] [Google Scholar]
- Doggett NA, Goodwin LA, Tesmer JG, Meincke LJ, Bruce DC, Clark LM, Altherr MR, Ford AA, Chi HC, Marrone BL, et al. An integrated physical map of human chromosome 16. Nature (Suppl.) 1995;377:335–365. doi: 10.1038/377335a0. [DOI] [PubMed] [Google Scholar]
- European Polycystic Kidney Disease Consortium. The polycystic kidney disease 1 gene encodes a 14 kb transcript and lies within a duplicated region on chromosome 16. Cell. 1994;78:725. [PubMed] [Google Scholar]
- Gregory S. Contig assembly by fingerprinting. In: Dear PH, editor. Gernome mapping: A practical approach. Oxford, UK: Oxford University Press; 1997. [Google Scholar]
- Kelley JM, Field CE, Craven MB, Bocskai D, Kim U-J, Rounsley SD, Adams MD. High throughput direct end sequencing of BAC clones. Nucleic Acids Res. 1999;27:1539–1546. doi: 10.1093/nar/27.6.1539. [DOI] [PMC free article] [PubMed] [Google Scholar]
- Kim U-J, Shizuya H, de Jong PJ, Birren B, Simon MI. Stable propagation of cosmid size human DNA inserts in an F factor based vector. Nucleic Acids Res. 1992;20:1083–1085. doi: 10.1093/nar/20.5.1083. [DOI] [PMC free article] [PubMed] [Google Scholar]
- Kim U-J, Shizuya H, Sainz J, Garnes J, Pulst SM, de Jong P, Simon MI. Construction and utility of a human chromosome 22-specific fosmid library. Gen Anal Biomol Eng. 1995;12:81–84. doi: 10.1016/1050-3862(95)00122-0. [DOI] [PubMed] [Google Scholar]
- Kim U-J, Birren B, Slepak T, Mancino V, Boysen C, Kang H-L, Simon MI, Shizuya H. Construction and characterization of a human bacterial artificial chromosome library. Genomics. 1996;34:213–218. doi: 10.1006/geno.1996.0268. [DOI] [PubMed] [Google Scholar]
- Liu PP, Wijmenga C, Hajra A, Blake TB, Kelley CA, Adelstein RS, Bagg A, Recior J, Cotelingam J, Willman CL, Collins FS. Identification of the chimeric protein product of the CBFB-MYH11 fusion gene in inv(16) leukemia cells. Genes Chromosomes Cancer. 1966;16:77–87. doi: 10.1002/(SICI)1098-2264(199606)16:2<77::AID-GCC1>3.0.CO;2-#. [DOI] [PubMed] [Google Scholar]
- Loftus BJ, Kim U-J, Sneddon VP, Kalush F, Brandon R, Furhmann J, Mason T, Barnstead M, Cronin L, Mays AD, Cao Y, Xu RX, Kang HL, Mitchell S, Eichler EE, Harris P, Venter JC, Adams MD. Genomics. 1999. (in press). [DOI] [PubMed] [Google Scholar]
- Mitchison HM, Munroe PB, O’Rawe AM, Taschner PE, de Vos N, Kremmidiotis G, Lensink I, Munk AC, D’Arigo KL, Anderson JW, et al. Genomic structure and complete nucleotide sequence of the Hatten disease gene, CLN3. Genomics. 1977;40:346–350. doi: 10.1006/geno.1996.4576. [DOI] [PubMed] [Google Scholar]
- Olson MV, Dutchik JE, Graham MY, Brodeur GM, Helms C, Frank M, Maccollin M, Scheinman R, Frank T. Random-clone strategy for genomic restriction mapping in Yeast. Proc Natl Acad Sci. 1986;83:7826–7830. doi: 10.1073/pnas.83.20.7826. [DOI] [PMC free article] [PubMed] [Google Scholar]
- Shizuya H, Birren B, Kim U-J, Mancino V, Slepak T, Tachiiri Y, Simon M. A bacterial cloning system for cloning large human DNA fragments. Proc Natl Acad Sci. 1992;89:8794–8797. doi: 10.1073/pnas.89.18.8794. [DOI] [PMC free article] [PubMed] [Google Scholar]
- Soderlund CA, Longden I. Technical report SC-01-96. Hinxton, Cambridge, UK: The Sanger Centre; 1996. FPC. [Google Scholar]
- Stallings RL, Whitmore SA, Doggett NA, Callen DF. Refined physical mapping of chromosome 16-specific repetitive DNA sequences. Cytogenet Cell Genet. 1993;63:97–101. doi: 10.1159/000133509. [DOI] [PubMed] [Google Scholar]
- Sulston J, Mallett F, Staden R, Durbin R, Horsnell T, Coulson A. Software for genome mapping by fingerprinting techniques. CABIOS. 1988;4:125–132. doi: 10.1093/bioinformatics/4.1.125. [DOI] [PubMed] [Google Scholar]
- Sulston J, Mallett F, Durbin R, Horsnell T. Image analysis of restriction enzyme fingerprint autoradiograms. Comput Appl Biosci. 1989;5:101–106. doi: 10.1093/bioinformatics/5.2.101. [DOI] [PubMed] [Google Scholar]
- Venter JC, Smith HO, Hood L. A new strategy for genome sequencing. Nature. 1996;381:364–366. doi: 10.1038/381364a0. [DOI] [PubMed] [Google Scholar]
- Weier HUG, Wang M, Mullikin JC, Zhu Y, Cheng JF, Greulich KM, Bensimon A, Gray JW. Quantitative DNA fiber mapping. Hum Mol Genet. 1995;4:1903–1910. doi: 10.1093/hmg/4.10.1903. [DOI] [PubMed] [Google Scholar]