

Abstract
We have constructed a HAPPY map of the apicomplexan parasite Cryptosporidium parvum. We have placed 204 markers on the 10.4-Mb genome, giving an average marker spacing of ∼50 kb, with an effective resolution of ∼40 kb. HAPPY mapping (an in vitro linkage technique based on screening approximately haploid amounts of DNA by the polymerase chain reaction) is fast and accurate and is not subject to the distortions inherent in cloning, meiotic recombination, or hybrid cell formation. In addition, little genomic DNA is needed as a substrate, and the AT content of the genome is largely immaterial, making it an ideal method for mapping otherwise intractable parasite genomes. The map, covering all eight chromosomes, consists of 10 linkage groups, each of which has been chromosomally assigned. We have verified the accuracy of the map by several methods, including the construction of a >140-kb PAC contig on chromosome VI. Less than 1% of our markers detect non-rDNA duplicated sequences.
Cryptosporidium parvum is a protozoan of the phylum Apicomplexa, class Coccidia. It is an obligate intracellular parasite infecting the gut epithelia of a wide range of mammals, and is transmitted from host to host via thick-walled oocysts in the faeces. The first case of human cryptosporidiosis was reported as recently as 1976, and it is now recognized as a major cause of gastro-intestinal illness worldwide. In most cases, the body mounts a strong immune response and the parasite is eradicated from the gut after ∼seven days of diarrhea. Infections in the immunosuppressed (e.g., AIDS patients), however, can be persistent and eventually fatal (for review, see Fayer et al. 1997). Massive outbreaks have occurred when the drinking water for entire communities has been contaminated with oocysts (e.g., MacKenzie et al. 1994).
The Cryptosporidium genome is small for a coccidian (Tilley and Upton 1997), consisting of eight chromosomes with a total size estimate of between 9.6 (Caccio et al. 1998) and 10.4 Mb (Blunt et al. 1997). The low copy number and genome-wide distribution of both 5S and cytoplasmic rDNA genes (four to five and five copies, respectively; Taghi-Kilani et al. 1994; Le Blancq et al. 1997) is similar to that of several other apicomplexans, such as Plasmodium. This differs markedly from the usual eukaryotic pattern of hundreds or thousands of tandem copies. The ∼60%–70% AT content of the genome (Jenkins and Petersen 1997; Piper et al. 1998) is much lower than that of most Plasmodium spp. (Weber 1988). C. parvum appears to contain neither mitochondria (although they have been observed in other Cryptosporidium spp.) nor the plastid commonly found in apicomplexan parasites (Fayer et al. 1997; Kohler et al. 1997). Around 15–20 complete genes have been sequenced (e.g., Gooze et al. 1991; Nelson et al. 1991; Kim et al. 1992; Lally et al. 1992; Jenkins et al. 1993; Ranucci et al. 1993; Taghi-Kilani et al. 1994; Khramstov et al. 1995, 1996; Steele et al. 1995), and many others have been identified during the UCSF Cryptosporidium EST project (http://www.embl-ebi.ac.uk/parasites/news.html). Like most apicomplexans, Cryptosporidium appears to have few introns—currently only one has been reported (Caccio et al. 1997).
The combination of its medical importance and small, unusual genome make C. parvum an ideal candidate for genomic studies, but these have been hampered by the absence of a detailed map and large insert clone library. The second of these problems was addressed recently with the release of the C. parvum PAC library (Piper et al. 1998). It has only recently become possible, however, to distinguish all eight Cryptosporidium chromosomes electrophoretically, and mapping to date has been limited to the placing of 20 markers on specific chromosomes (Caccio et al. 1998).
This paper describes the construction of a physical genome map of C. parvum using HAPPY mapping (Dear and Cook 1993; Dear 1997; Dear et al. 1998), an in vitro technique that involves breaking intact genomic DNA at random, segregating the fragments into aliquots by limiting dilution and measuring the frequency of cosegregation of markers among the aliquots (Fig. 1). Closely linked markers are rarely separated by an intervening break and therefore tend to cosegregate. In this way, it is analogous both to traditional linkage mapping, which measures the frequency of recombination between markers during meiosis, and to radiation hybrid mapping (Cox et al. 1990). HAPPY mapping, however, does not suffer from the inaccuracies inherent in biological methods (recombination hotspots or hybrid instability), and the AT content of the genome should be largely immaterial. Constructing and screening a HAPPY mapping panel is relatively simple, and only small quantities of DNA are needed. All of the above suggest that HAPPY mapping is ideal for the study of otherwise intractable parasite genomes. Genomic studies of Cryptosporidium should be greatly aided by the use of this map in conjunction with the PAC library. Accession numbers and primer sequences for all markers are available at http://www.mrc-lmb.cam.ac.uk/happy/CRYPTO/crypto-genome.html. In addition, a limited number of aliquots of the mapping panel can be made available to researchers wishing to map their own markers.
Figure 1.
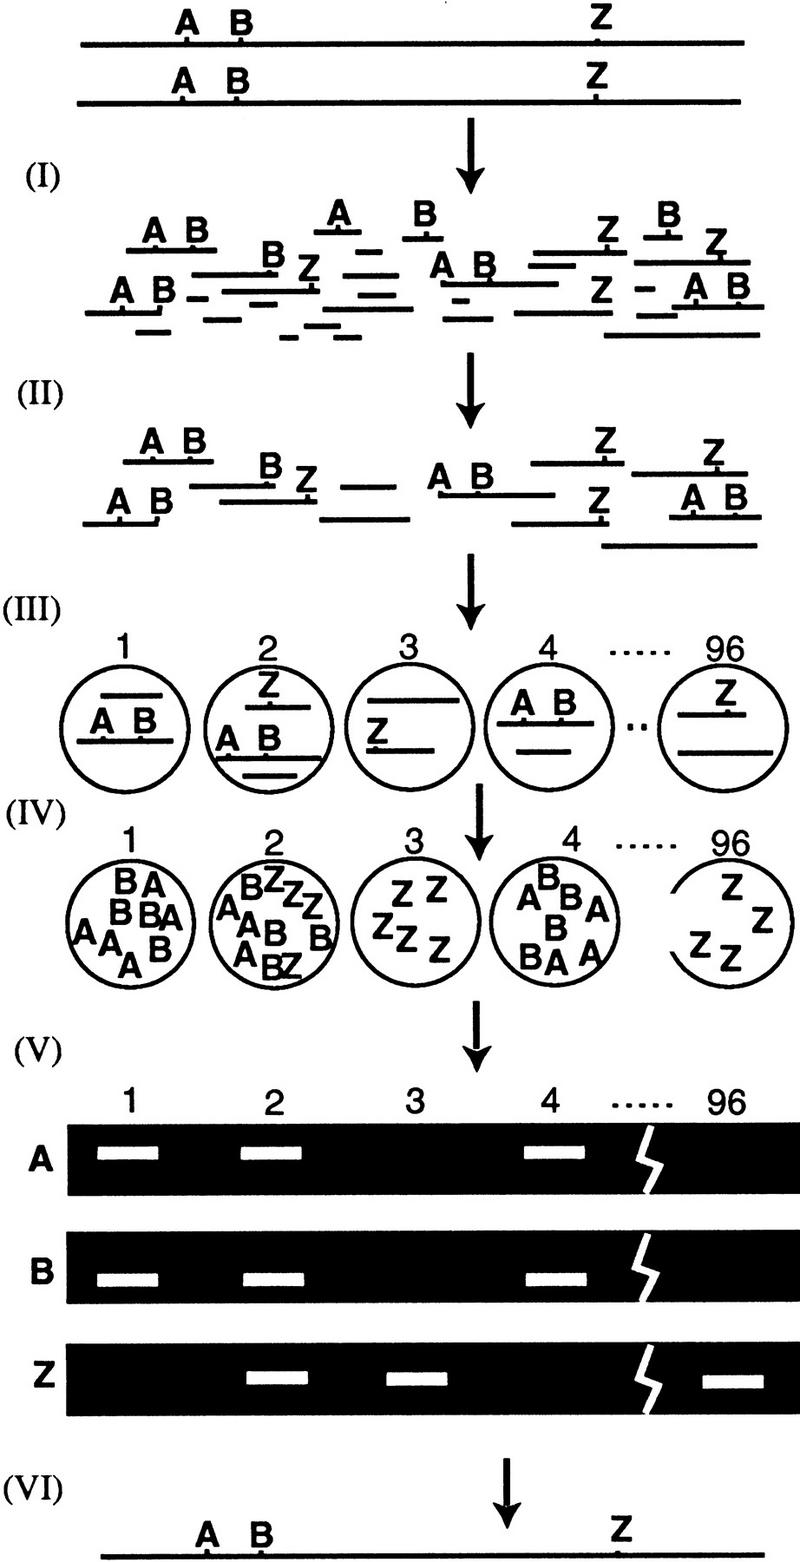
How HAPPY mapping works. Intact genomic DNA is broken by irradiation (I) to give a pool of random fragments, which are size selected by PFGE (II). A mapping panel of 96 aliquots is taken (III) from this pool. Each aliquot contains ∼1 haploid genome’s worth of DNA, so each marker is present in only a subset of the aliquots. (IV) The panel is pre-amplified a few hundred-fold by primer extension preamplification (PEP). (V) Subfractions of the pre-amplified panel are screened for specific markers using nested PCR. Markers A and B, (e.g., are found to cosegregate frequently. This implies that they tend to lie on the same fragment of DNA, and so must be tightly linked. A map may be constructed (VI) by examining cosegregation frequencies between all markers.
RESULTS
We made and used two mapping panels for this study. The first, Cri1, contained fragments with a mean size of ∼400 kb (size-selected, using pulsed-field gel electrophoresis; Fig. 1), allowing us to detect linkage between markers up to ∼200 kb apart, with a resolution of ∼40 kb (i.e., 50% and 10% of mean fragment size, respectively; Dear and Cook 1993; Dear 1997). The second, Cri4, contained fragments with a mean size of ∼800 kb, detecting linkage over distances up to ∼400 kb but with a poorer resolution (∼80 kb). Panel Cri1 was used to maximize map resolution; the long-range panel Cri4 was used to close the remaining gaps between widely spaced markers.
Typing Short-Range Panel Cri1
A total of 237 markers were typed on panel Cri1, 197 successfully. The average DNA content of the panel was ∼1.06 haploid genomes per aliquot. Seven markers gave poor typings (i.e., faint or multiple bands). These “second-rate” markers were excluded from the first phase of map construction. In addition, four markers were multicopy (i.e., they were positive in most or all of the aliquots). The 197 first-rate markers fell into 40 primary linkage groups of between 1 and 27 markers at a threshold lod of 4.5 (i.e., probability of linkage >31,000:1). This threshold lod is chosen to exclude false linkages, and is obtained using the formula log [(N2 − N)/2], where N = the number of markers (Dear 1997). For each primary linkage group of >2 markers, a map was constructed using a distance-geometry algorithm (Newell et al. 1995). This draws attention to any outlying markers whose typing or copy number is suspect. Three such markers were identified and reassigned as second-rate.
Assigning Primary Linkage Groups to Chromosomal Bands by Southern Blotting
Forty-five STSs from 31 of the primary linkage groups were assigned to bands on the C. parvum electrophoretic karyotype by PFGE and Southern blotting (Piper et al. 1998). Chromosomes III, IV and V comigrate on pulsed-field gels as electrophoretic band 3, as do chromosomes VII and VIII as electrophoretic band 5 (Caccio et al. 1998; Fig. 3, below). The assignments obtained here for Cp15/60 (GenBank accession no. U22892, containing our marker cr3; electrophoretic band 5) and PDI (GenBank accession no. U48261, cr23.34; band 4) agree with those from Blunt et al. (1997). In addition, the assignments for type B rDNA (GenBank accession no. AF015774, cr34; band 2), actin (M86241, cr4; band 3), and Hsp70 (U11761, cr28; band 2) agree with those from Le Blancq et al. (1997).
Figure 3.

The C. parvum karyotype. (a) the Saccaromyces cerevisiae (Y) and C. parvum (C) karyotypes resolved by PFGE. For S. cerevisiae sizes are given in Mb; for C. parvum, band 1 = chromosome I (1.04 Mb), band 2 = chromosome II (1.08Mb), band 3 = chromosomes III, IV, and V (1.24Mb), band 4 = chromosome VI (1.44Mb), and band 5 = chromosomes VII and VIII (1.54 Mb). (b) assignment of markers to individual Cryptosporidium chromosomes following restriction digestion. Total Cryptosporidium DNA was digested by NotI (N) or SfiI (S), separated by PFGE (left panel) then blotted and probed. Marker cr1046 lies on a NotI fragment of 1.1 Mb and a SfiI fragment of 0.87 Mb, characteristic of chromosome III. Marker cr273 lies on a NotI fragment of 0.37 Mb and a SfiI fragment of 1.08 Mb, characteristic of chromosome V. Marker cr1011 lies on a NotI fragment of 0.77 Mb and a SfiI fragment of 1.08 Mb, also characteristic of chromosome V (see Caccio et al. 1998).
The two smallest chromosomes (electrophoretic bands 1 and 2) are difficult to resolve. We assign Hsp70 and type B rDNA on band 2 (see above), in agreement with Le Blancq et al. (1997), and ACoA synthase (GenBank accession no. U24082, cr20) on band 1. The assignments for Hsp70 and ACoA synthase reported here, however, disagree with those from Blunt et al. (1997). To verify our assignments, we probed the same Southern blots first with total Cryptosporidium DNA to reveal the entire karyotype, then (after stripping the blots) with the STSs in question. Alignment of the autoradiographs allows reliable assignment of STSs to electrophoretic bands (Piper et al. 1998).
Gap Closure using Long-Range Panel Cri4
To close the remaining gaps (caused wherever two consecutive markers lie further apart than the ∼200 kb range of panel Cri1), one or more markers lying close to each end of each primary linkage group were typed on the long-range Cri4 panel. Mean DNA content of this panel was found to be 1.02 genomes per aliquot. In this way, primary linkage groups were linked into 10 secondary linkage groups at a lod threshold of 4. To determine the relative orientation of primary linkage groups, a lod threshold of 3 was chosen (i.e., odds of inversion 1000:1; Fig. 2).
Figure 2.

The HAPPY map of C. parvum. Chromosomes are numbered I (smallest) to VIII (largest). Second-rate markers are prefixed by 2. Those markers assigned to Cryptosporidium electrophoretic bands are labeled with an asterisk (*). Markers assigned by Caccio et al. (1998) to specific chromosomes are labeled with a dagger (†). Markers assigned in this study to specific chromosomes by the method of Caccio et al. (Fig. 3) are labeled with a double dagger (‡). Markers linked by dotted lines are linked on panel Cri4 only (lod ≤ 2 on panel Cri1); therefore; these distance estimates are less accurate. The gap marked by an arrow on chromosome VIII is not closed rigorously (lod of 1.47 on panel Cri4, probability of linkage >30:1). Chromosome V is made up of two small linkage groups, the larger of which can be orientated (see Results). Groups of markers that cannot be orientated with respect to their neighbors at odds >1000:1 are bracketed (in all cases these groups are still orientated with respect to their neighbors with odds > 5:1, and the order within such brackets is established). The position of the PAC contig (Fig. 4) is marked by a solid bar.
In some cases where more than two markers from a single primary linkage group were typed on Cri4, there was a conflict of marker order as determined by the long- and short-range panels. These mostly occurred below the expected resolution of panel Cri4. In all cases, the more accurate order from the short-range Cri1 panel was used. Therefore, data from Cri4 were used only to determine the linkages between, and relative orientations of, primary linkage groups.
Map Scaling and Placement of Second-Rate Markers
Because distances within primary linkage groups and those between primary linkage groups were measured using different mapping panels (Cri1 and Cri4, respectively), two methods were used to unify distance estimates. Where the lod between markers was >2 as measured by Cri1, the distance was also based on that measured by Cri1 (i.e., the long-range panel was used to confirm linkage, but the distance was based on the weaker linkage measured by the short-range panel). Where the lod as measured by Cri1 was <2, we used instead the distance as measured by Cri4, rescaled by extrapolating from distances measured on both panels. Finally, the entire map was re-scaled linearly to match the electrophoretically determined genome size of 10.4 Mb.
Second-rate markers were assigned tentatively to the interval between the two first-rate markers to which they showed strongest linkage (Fig. 2). The majority of the 10 second-rate markers probably typed poorly because of inefficient PCR primers. However, one of these (cr10) is derived from a triplet tandem repeat of 5s rRNA (Genbank L20049), of which there are at least four copies in the genome (Taghi-Kilani et al. 1994). A probe derived from this marker hybridized most strongly to electrophoretic band 5 (to which the marker shows greatest linkage), but also less intensely to band 3 (results not shown). This suggests that, in scoring cr10, we may be detecting (at low efficiency) loci from band 3 as well as from band 5.
Assignment of Secondary Linkage Groups to Individual Chromosomes
The C. parvum genome consists of eight chromosomes; there are 10 secondary linkage groups in the HAPPY map, suggesting that two gaps remain. Four of the secondary linkage groups were assigned by Southern hybridization (above) to electrophoretic band 3, which consists of three chromosomes. Similarly, three secondary linkage groups were assigned to electrophoretic band 5, which consists of two chromosomes.
It is possible to distinguish all eight chromosomes electrophoretically following digestion with NotI or SfiI (Caccio et al. 1998). Thirteen of the markers used in this study have been chromosomally assigned in this way by Caccio et al. (1998), and we assigned a further three markers (Fig. 3B). This allows us to assign all secondary linkage groups unambiguously to chromosomes, and reveals that the two remaining gaps are in chromosomes V (electrophoretic band 3) and VIII (electrophoretic band 5). A lod of 1.47 (odds of 30:1) using panel Cri4 allows us to tentatively estimate the orientation and distance between the two parts of chromosome VIII. No linkage is seen between the two secondary linkage groups comprising chromosome V; however, we can orientate the larger of them by the position of a NotI site. Markers cr4 and cr1011 lie on a 0.77 Mb NotI fragment, whereas cr273 lies on a 0.37-Mb fragment (Caccio et al. 1998; Fig. 3B).
Map Verification
The map was verified in several ways. At the chromosomal level, there are no conflicts between our map and the assignment of 45 markers by Southern hybridization (above). At the ∼30–70 kb level, both ends of three Cryptosporidium PAC clones (Piper et al. 1998) were sequenced and used as markers (cr302 and 303 from clone 1a1; cr304 and 305 from 1a2; cr308.56 and cr309 from 1a4). In all cases, the distance measured on our map between these paired markers was within ±27 kb of the measured PAC insert size. At a finer level, there were eight instances in which a pair of markers gave BLAST hits to the same protein (e.g., cr1043 and cr1051 = lactate dehydrogenase) and are presumed to be derived from the same gene; in each case, the paired markers are consecutive on our map. In addition, three markers derived from the COWP sequence at ∼2 kb intervals(cr5, cr24, cr6) (Spano et al. 1996) mapped consecutively on chromosome VI (Fig. 2). The above data are consistent with our predicted resolution of better than 40 kb.
To further verify the map, a PAC contig was constructed over a region of chromosome VI that contained eight first-rate and one second-rate markers (Fig. 4). There were no conflicts in first-rate marker order between the map and the contig at distances greater than ∼20 kb. The second-rate marker was ∼50 kb (max. 95 kb) from its expected position.
Figure 4.

Construction of a PAC contig overlying the HAPPY map. One end of the HAPPY map of chromosome VI, spanning ∼135 kb, is shown (thin horizontal line). Heavy horizontal lines indicate PAC clones, with sizes given in kbp (clones are not to scale). (•) The marker order derived from the contig (not all markers can be ordered); (█) The clone is positive for those markers. There are no first-rate marker inversions on the HAPPY map above a distance of ∼20 kb. The second-rate marker (2cr1135) is ∼50 kb from its expected position (max. 95 kb, i.e., length of clone 1h1). The total length of the contig is between 140 kb (clones 1d7 plus 3a1) and 285 kb (clones 18b10, 1h1 plus 18h9), depending on the degree of overlap.
DISCUSSION
We used a two-panel strategy to complete our map, in which a short-range panel links most markers and gives accurate order and distance, leaving only a few markers to be re-typed on the long-range panel to close remaining gaps. Although the long-range panel Cri4 can detect linkage between widely spaced markers, distance estimates based on it are more error-prone than those from the short range Cri1 panel for two reasons. First, the larger fragment size (∼800 kb) of Cri4 means that there are only a few (typically ∼10–15) fragments in each aliquot of the mapping panel, and therefore a larger statistical variation in the DNA content from aliquot to aliquot (1.02 ± 0.47 genomes per aliquot for Cri4, as compared with 1.06 ± 0.27 for Cri1). Second, the large size of the fragments compared with the size of the smallest chromosomes (∼1.04 Mb) means that near-telomeric sequences are underrepresented (sequences near the ends of chromosomes have less chance of being contained in large fragments). Both of these factors can lead to distortions, and therefore distances are less accurate when based solely on the Cri4 data. In addition, our assumption of a linear mapping function (which relates our measured distances to physical distances; Dear and Cook 1993) is only strictly valid if the size selection of fragments making the mapping panel is perfect (giving a uniform fragment size); deviations from this idealized mapping function would lead to an expansion or contraction of marker-dense regions relative to marker-sparse ones (Dear 1997). These factors may account for the discrepancy between our measured chromosome sizes and those based on electrophoretic mobility—the map sizes of chromosomes I and III are 78% and 124% of their electrophoretic sizes, respectively (all other chromosomes have map lengths within 10% of their electrophoretic sizes). In addition, we may not have near-telomeric markers for all chromosomes, which could explain the smaller than expected size of chromosome I.
The 204 markers give an average spacing of ∼50 kb. The map has been verified by several methods (see Results). First-rate markers are placed with a resolution of ∼40 kb. Second-rate markers are placed tentatively, with an accuracy that varies from case to case. The region covered by the PAC contig was estimated to be ∼135 kb by HAPPY mapping, whereas the true distance as determined by the contig itself was ⩾140 kb (Fig. 4).
Four of the markers that we tried to map appear to be multicopy (see Results). These markers could, in principle, be detecting sequences present in the human carrier DNA, but this is unlikely given the specificity of nested PCR. Two of these markers were derived from the rDNA unit (Genbank accession nos. S40330 and AA224692 ), of which there are at least five copies in the genome (Le Blancq et al. 1997). Markers derived from AA167870 [an expressed sequence tag (EST)] and B67202 (a GST) also appear to be multicopy. Excluding the rDNA unit, around 1% (2 of 204) of our markers detected duplicated sequences. Close tandem duplications (in which two or more copies segregate on a single fragment), however, will not be revealed; nor will those duplications in which the targets of the nested primers have undergone mutation. There is only one non-rDNA repeat currently reported (Bonnin et al. 1996).
Only one intron has been described in C. parvum (Caccio et al. 1997). One of our EST-derived markers (cr1203, derived from AA224676), however, gives a PCR product considerably bigger than expected. This could be indicative of the presence of an intron.
There appear to be distinct “human” and “animal” subtypes of C. parvum. The Moredun cervine strain used in this study, and in construction of the PAC library (Piper et al. 1998), appears to belong to the “animal” subtype (Morgan et al. 1997), as do the strains used in previous karyotypic studies (Blunt et al. 1997; Le Blancq et al. 1997; Caccio et al. 1998). There are no reports of karyotypic studies of human subtypes, presumably as oocysts are hard to obtain in sufficient quantities. Only limited amounts of DNA, however, are needed to construct a HAPPY map. A HAPPY map of a human subtype, using the same markers as here, would allow the degree of relatedness between these two subtypes at the genomic level to be determined.
METHODS
Marker Generation
STS marker sequences were obtained from three sources. One hundred ninety-two were downloaded from GenBank. Markers derived from these sequences are numbered from cr1–cr38 (large sequences), and from cr1005–cr1284 (ESTs and GSTs). Thirty-eight markers (with numbers from cr110 to cr286) were generated from our own M13 libraries, which were made as follows: C. parvum (strain Moredun cervine) oocysts were obtained from the Moredun Institute (Edinburgh, UK). DNA was obtained by excystation of 5 × 10⁷ oocysts followed by lysis in proteinase K, phenol:chloroform (1:1) extraction and ethanol precipitation (Lally et al. 1992), and redissolved in TE (10 mm Tris-HCl at pH 7.4, 1 mm EDTA) to a final concentration of 100 ng/μl. Twenty nanograms of HincII-digested M13 mp18 DNA (New England Biolabs, prepared as described in Bankier et al. 1987) was ligated to 20 ng of AluI- or RsaI-cut Cryptosporidium DNA with 1.25 units of DNA ligase according to the manufacturer’s instructions (Rapid DNA Ligation Kit, Boehringer Mannheim). Transformation was carried out as described previously (Messing and Bankier 1989). Recombinant colonies (blue/white selection) were toothpicked into 96-well microtiter plates containing 20 μl of TE per well. Clones were grown up with Escherichia coli TG1, then single-stranded DNA was isolated as described previously (Bankier and Barrell 1989) and sequenced using the chain-termination method on an ABI 373 automated fluorescent sequencer (see also http://www.ebi.ac.uk/parasites/cparvSTS.html). Seven marker sequences (cr300, cr302, cr303, cr304, cr305, cr308.56, and cr309) were generated from PAC ends (Piper et al. 1998) using a slightly modified method of Wu et al. (1996). Nested primers were designed for each marker following the guidelines in Dear (1997).
Accession numbers and primer sequences for all markers are available at http://www.mrc-lmb.cam.ac.uk/happy/CRYPTO/crypto-genome.html.
Mapping Panel Generation and Preamplification
Mapping-panel construction was carried out under PCR “clean” conditions (Dear 1997). C. parvum (strain Moredun cervine) oocysts were embedded in LMP agarose at a concentration of 3 × 10⁵ oocysts/ml and lysed with proteinase K (Mead et al. 1988), and irradiated (80,000 cGy in a 137Cs source) to break the DNA. Fragments were size-selected by PFGE in a CHEF DRII system (BioRad). For mapping panel Cri1 (average fragment size ∼400 kb) run parameters were 1% chromosomal grade agarose (BioRad), 0.5 × TBE, 6 V/cm, for 26 hr at 14°C, 10–40 sec ramped pulse, and 120° switching angle. For mapping panel Cri4 (average fragment size ∼800 kb) run parameters were as above except that a ramped pulse of 60–120 sec was used for 24 hr. Mapping panels consisted of 96 aliquots, each containing a single agarose plug taken from the gel, as described previously (Dear 1997). All aliquots were preamplified using a modified primer extension PCR (PEP) protocol with a random-15 mer primer (Zhang et al. 1992). Reactions contained, in addition to the agarose plugs, 10 mm Tris (pH 8.3), 50 mm KCl, 2.5 mm MgCl2, 200 μm of each dNTP, 10 μm primer, 1 unit of Taq polymerase (HT Biotech, Cambridge, UK) and ∼0.5 genome human DNA as carrier in a total reaction volume of 5μl. Cycling conditions were an initial 5 min denaturation step at 93°C; followed by 50 cycles of 94°C for 30 sec, 37°C for 2 min, 37–55°C ramp over 3 min and 55°C for 4 min. Each preamplified aliquot was then diluted to 200 μl and stored at −70°C.
Marker Typing
Markers were typed in blocks of 20, using a two-phase nested PCR that was multiplexed for the first phase. First-phase reactions were performed (for each of the 96 aliquots) on 5 μl of the diluted preamplified material with external primers for 20 markers (10 mm Tris at pH 8.3, 50 mm KCl, 1 mm MgCl2, 200 μm each dNTP, 0.5 μm each external primer pair and 1 unit of Taq polymerase in a total volume of 10 μl; initial 5 min denaturation at 93°C, then 25 cycles of 94°C for 20 sec, 55°C for 30 sec, and 72°C for 30 sec). This material was then diluted to 200 μl, of which 5 μl samples were used in second-phase reactions for one marker at a time (10 mm Tris at pH 8.3, 50 mm KCl, 1.5 mm MgCl2, 200 μm each dNTP, 1 μM left and right internal primer pair and 0.25 unit of Taq polymerase in a total volume of 10 μl, initial 5 min denaturation step at 93°C, then 33 cycles of 94°C for 20 sec, 55°C for 30 sec, and 72°C for 1 min). Products were resolved on high-density agarose minigels and the results scored (Dear et al. 1998).
Linkage Calculations and Map Scaling
Pairwise lod and υ values (reflecting respectively the likelihood of linkage between any two markers and the probability of a break between them, which corresponds to the physical distance) were calculated as described in Dear et al. (1998). Maps were computed from these pairwise data using a distance geometry approach (Newell et al. 1995) as described in Dear et al. (1998). A linear mapping function was used to relate physical distance to υ values.
Karyotypic Assignment of STSs to Chromosomal Bands
The undigested C. parvum karyotype was probed with 45 STSs as described in Piper et al. (1998). Briefly, agarose-embedded oocysts were analyzed by PFGE in a CHEF DR II system (∼107 oocysts per lane, 1% chromosomal grade agarose, 4V/cm, 0.5× TBE, 120° switching angle, 14°C, 120-sec pulse for 48 hr then 240-sec pulse for 48 hr). The gel was stained with ethidium bromide and photographed. Southern blotting was performed according to established procedures (Sambrook et al. 1989). Filters were first probed with total Cryptosporidium genomic DNA, autoradiographed, then stripped and re-probed with ∼500 ng of PCR-amplified STS DNA (see Marker Generation, above) that had been purified using a Qiagen PCR purification kit, labeled with 32P (Pharmacia oligolabeling kit) and re-purified using a Qiagen nucleotide removal kit. The blots probed with total DNA were used as guides to accurately assign the chromosomal locations of individual STSs. To assign contigs to individual chromosomes that could not be electrophoretically resolved, the restriction analysis method of Caccio et al. (1998) was used. After digestion with NotI or SfiI, DNA from ∼107 oocysts was analyzed by PFGE (conditions as for constructing panel Cri4), blotted and probed with individual STSs as above.
PAC Contig Building
Primary pools of the C. parvum PAC library (Piper et al. 1998) were made by combining all clones from a single library plate, and diluting 10-fold in water. Pools were then screened for a specific STS (5 μl pool in 10 μl total reaction; reactions as in second-phase of marker typing, above) with negative (water) and positive (∼40–400 pg Cryptosporidium DNA) controls. Products were analyzed by agarose gel electrophoresis. Once the pools that were positive for a given STS had been determined, individual PAC clones were identified by PCR screening the 96 wells of the appropriate plate. Positive clones were grown overnight in 3 ml of Luria broth plus 25 μg/ml kanamycin. PAC DNA was isolated by alkaline lysis, digested with NotI to release the insert, and sized by PFGE (Ioannou and de Jong 1996). The contig was assembled manually.
Acknowledgments
The publication costs of this article were defrayed in part by payment of page charges. This article must therefore be hereby marked “advertisement” in accordance with 18 USC section 1734 solely to indicate this fact.
Footnotes
E-MAIL phd@mrc-lmb.cam.ac.uk; FAX (+44) 1223 412178.
REFERENCES
- Bankier A, Barrell B. Sequencing single-stranded DNA using the chain-termination method. In: Howe C, Ward E, editors. Nucleic acids sequencing: A practical approach. Oxford, UK: Oxford University Press; 1989. pp. 37–58. [Google Scholar]
- Bankier A, Weston K, Barrell B. Random cloning and sequencing by the M13/dideoxynucleotide chain termination method. Methods Enzymol. 1987;155:51–93. doi: 10.1016/0076-6879(87)55009-1. [DOI] [PubMed] [Google Scholar]
- Blunt DS, Khramstov NV, Upton SJ, Montelone BA. Molecular karyotype analysis of Crytptosporidium parvum: Evidence for eight chromosomes and a low-molecular-size molecule. Clin Diag Lab Immunol. 1997;4:11–13. doi: 10.1128/cdli.4.1.11-13.1997. [DOI] [PMC free article] [PubMed] [Google Scholar]
- Bonnin A, Fourmaux MN, Dubremetz JF, Nelson RG, Gobet P, Harly G, Buisson M, Puygauthier-Toubas D, Gabriel-Popisil F, Naciri M, Camerlynck P. Genotyping human and bovine isolates of Cryptosporidium parvum by polymerase chain reaction-restriction fragment length polymorphism analysis of a repetitive DNA sequence. FEMS Microbiol Lett. 1996;137:207–211. doi: 10.1111/j.1574-6968.1996.tb08107.x. [DOI] [PubMed] [Google Scholar]
- Caccio S, La Rosa G, Pozio E. The beta-tubulin gene of Cryptosporidium parvum. Mol Biochem Parasitol. 1997;89:307–311. doi: 10.1016/s0166-6851(97)00122-9. [DOI] [PubMed] [Google Scholar]
- Caccio, S., R. Camilli, G. La Rosa, and E. Pozio. 1998. Establishing the Cryptosporidium parvum karyotype by NotI and SfiI restriction analysis and Southern hybridizations. Gene. [DOI] [PubMed]
- Cox DR, Burmeister M, Price ER, Kim S, Myers RM. Radiation Hybrid mapping: A somatic cell genetic method for constructing high resolution maps of mammalian chromosomes. Science. 1990;250:245–250. doi: 10.1126/science.2218528. [DOI] [PubMed] [Google Scholar]
- Dear PH. HAPPY mapping. In: Dear P H, editor. Genome mapping: A practical approach. Oxford, UK: IRL Press; 1997. pp. 95–124. [Google Scholar]
- Dear PH, Cook PR. Happy mapping: Linkage mapping using a physical analogue of meiosis. Nucleic Acids Res. 1993;21:13–20. doi: 10.1093/nar/21.1.13. [DOI] [PMC free article] [PubMed] [Google Scholar]
- Dear PH, Bankier AT, Piper MB. A high-resolution metric HAPPY map of human chromosome 14. Genomics. 1998;48:232–241. doi: 10.1006/geno.1997.5140. [DOI] [PubMed] [Google Scholar]
- Fayer R, Speer CA, Dubey JP. The general biology of Cryptosporidium. In: Fayer R, editor. Cryptosporidium and cryptosporidiosis. Boca Raton, FL: CRC Press; 1997. pp. 1–42. [Google Scholar]
- Gooze L, Kim K, Petersen C, Gut J, Nelson RG. Amplification of a Crytptosporidium parvum gene fragment encoding Thymidylate Synthase. J Protozool. 1991;38:56S–58S. [PubMed] [Google Scholar]
- Ioannou PA, de Jong PJ. Construction of bacterial artificial chromosome libraries using the modified P1 (PAC) system. Curr Protocols Hum Genet. 1996;5:1–24. [Google Scholar]
- Jenkins MC, Petersen C. Molecular biology of Cryptosporidium. In: Fayer R, editor. Cryptosporidium and cryptosporidiosis. Boca Raton, FL: CRC Press; 1997. pp. 225–232. [Google Scholar]
- Jenkins MC, Fayer R, Tilley M, Upton SJ. Cloning and expression of a cDNA encoding epitopes shared by 15– and 60-kilodalton proteins of Crytptosporidium parvum sporozoites. Infect Immun. 1993;61:2377–2382. doi: 10.1128/iai.61.6.2377-2382.1993. [DOI] [PMC free article] [PubMed] [Google Scholar]
- Khramstov NV, Tilley M, Blunt DS, Montelone BA, Upton SJ. Cloning and analysis of a Crytptosporidium parvum gene encoding a protein with homology to cytoplasmic form Hsp 70. J Eukaryot Microbiol. 1995;42:416–422. doi: 10.1111/j.1550-7408.1995.tb01605.x. [DOI] [PubMed] [Google Scholar]
- Khramstov NV, Blunt DS, Montelone BA, Upton SJ. The putative acetyl-coA synthetase gene of Crytptosporidium parvum and a new conserved protein motif in acetyl-coA synthetases. J Parasitol. 1996;82:423–427. [PubMed] [Google Scholar]
- Kim K, Gooze L, Petersen C, Gut J, Nelson RG. Isolation, sequence and molecular karyotype analysis of the actin gene of Crytptosporidium parvum. Mol Biochem Parasitol. 1992;50:105–114. doi: 10.1016/0166-6851(92)90248-i. [DOI] [PubMed] [Google Scholar]
- Kohler S, Delwiche CF, Denny PW, Tilney LG, Webster P, Wilson RJM, Palmer JD, Roos DS. A plastid of probable green algal origin in Apicomplexan parasites. Science. 1997;275:1485–1489. doi: 10.1126/science.275.5305.1485. [DOI] [PubMed] [Google Scholar]
- Lally NC, Baird GD, McQuay SJ, Wright F, Oliver JJ. A 2359-base pair DNA fragment from Crytptosporidium parvum encoding a repetitive oocyst protein. Mol and Biochem Parasitol. 1992;56:69–78. doi: 10.1016/0166-6851(92)90155-d. [DOI] [PubMed] [Google Scholar]
- Le Blancq SM, Khramstov NV, Zamani F, Upton SJ, Wu TW. Ribosomal RNA gene organization in Cryptosporidium parvum. Mol Biochem Parasitol. 1997;90:463–478. doi: 10.1016/s0166-6851(97)00181-3. [DOI] [PubMed] [Google Scholar]
- MacKenzie WR, Hoxie NJ, Proctor ME, Gradus MS, Blair KA, Peterson DE, Kazmierczak JJ, Addiss DG, Fox KR, Rose JB, Davis JP. A massive outbreak in Milwaukee of Cryptosporidium infection transmitted through the public water supply. New Engl J Med. 1994;331:161–167. doi: 10.1056/NEJM199407213310304. [DOI] [PubMed] [Google Scholar]
- Mead JR, Arrowood MJ, Current WL, Sterling CR. Field inversion gel electrophoretic seperation of Cryptosporidium spp. chromosome-sized DNA. J Parasitol. 1988;74:366–369. [PubMed] [Google Scholar]
- Messing J, Bankier A. The use of single-stranded DNA phage in DNA sequencing. In: Howe C, Ward E, editors. Nucleic acids sequencing: A practical approach. Oxford, UK: Oxford University Press; 1989. pp. 1–37. [Google Scholar]
- Morgan UM, Constantine CC, Forbes DA, Thompson RA. Differentiation between human and animal isolates of Cryptosporidium parvum using rDNA sequencing and direct PCR analysis. J Parasitol. 1997;83:825–830. [PubMed] [Google Scholar]
- Nelson RG, Kim K, Gooze L, Petersen C, Gut J. Identification and isolation of Crytptosporidium parvum genes encoding microtubule and microfilament proteins. J Protozool. 1991;38:52S–55S. [PubMed] [Google Scholar]
- Newell WR, Mott R, Beck S, Lehrach H. Construction of genetic maps using distance geometry. Genomics. 1995;30:59–70. doi: 10.1006/geno.1995.0009. [DOI] [PubMed] [Google Scholar]
- Piper MB, Bankier AT, Dear PH. Construction and characterisation of a genomic PAC library of the intestinal parasite Cryptosporidium parvum. Mol Biochem Parasitol. 1998;95:147–151. doi: 10.1016/s0166-6851(98)00095-4. [DOI] [PubMed] [Google Scholar]
- Ranucci L, Muller H-M, Rossa GL, Reckmann I, Morales MAG, Spano F, Pozio E, Crisanti A. Characterisation and immunolocalization of a Crytptosporidium protein containing repeated amino acid motifs. Infect Immunol. 1993;61:2347–2356. doi: 10.1128/iai.61.6.2347-2356.1993. [DOI] [PMC free article] [PubMed] [Google Scholar]
- Sambrook J, Fritsch E, Maniatis T. Molecular cloning: A laboratory manual. 2nd ed. Cold Spring Harbor, NY: Cold Spring Harbor Laboratory Press; 1989. [Google Scholar]
- Spano F, Puri C, Ranucci L, Putignani L, Crisanti A. Cloning of the entire COWP gene of Cryptosporidium parvum and ultrastructural localization of the protein during sexual parasite development. Parasitology. 1996;114:427–437. doi: 10.1017/s0031182096008761. [DOI] [PubMed] [Google Scholar]
- Steele MI, Kuhls TL, Nida K, Meka CSR, Halabi IM, Mosier DA, Elliot W, Crawford DL, Greenfield RA. A Crytptosporidium parvum genomic region encoding hemolytic activity. Infect Immunol. 1995;63:3840–3845. doi: 10.1128/iai.63.10.3840-3845.1995. [DOI] [PMC free article] [PubMed] [Google Scholar]
- Taghi-Kilani R, Rimacha-Moreno M, Wenman WM. Three tandemly repeated 5S ribosomal RNA-encoding genes identified, cloned and characterized from Crytptosporidium parvum. Gene. 1994;142:253–258. doi: 10.1016/0378-1119(94)90270-4. [DOI] [PubMed] [Google Scholar]
- Tilley M, Upton SJ. Biochemistry of Cryptosporidium. In: Fayer R, editor. Cryptosporidium and cryptosporidiosis. Boca Raton, FL: CRC Press; 1997. pp. 163–180. [Google Scholar]
- Weber JL. Molecular biology of malaria parasites. Exp Parasitol. 1988;66:143–170. doi: 10.1016/0014-4894(88)90087-2. [DOI] [PubMed] [Google Scholar]
- Wu C, Zhu S, Simpson S, de Jong PJ. DOP-vector PCR: A method for rapid isolation and sequencing of insert termini from PAC clones. Nucleic Acids Res. 1996;24:2614–2615. doi: 10.1093/nar/24.13.2614. [DOI] [PMC free article] [PubMed] [Google Scholar]
- Zhang L, Cui X, Schmitt K, Hubert R, Navidi W, Arnheim N. Whole genome amplification from a single cell: Implications for genetic analysis. Proc Natl Acad Sci. 1992;89:5487–5851. doi: 10.1073/pnas.89.13.5847. [DOI] [PMC free article] [PubMed] [Google Scholar]