

Parkinson’s disease (PD) patients typically suffer from motor disorders but mild to severe cognitive deficits can also be present. Neuropathology of PD primarily involves loss of dopaminergic neurons in the substantia nigra, pars compacta, although more widespread pathology from the brainstem to the cerebral cortex occurs at different stages of the disease. Cognitive deficits in PD are thought to involve the cerebral cortex, and imaging studies have identified the dorsolateral prefrontal cortex (DLPFC) as a possible site for some of the symptoms. GABAergic neurons in the cerebral cortex play a key role in the modulation of pyramidal neurons and alterations in muscimol binding to GABAA receptors have been reported in Brodmann area 9 (BA9) of the prefrontal cortex in PD patients (Nishino et al., 1988). In order to further assess the likelihood that GABAergic activity is altered in the prefrontal cortex in PD, gene expression of the 67 kilodalton isoform of the GABA-synthesizing enzyme, glutamic acid decarboxylase (GAD67 encoded by the GAD1 gene), was examined in BA9 of post-mortem brains from 19 patients and 20 controls using isotopic in situ hybridization histochemistry. GAD67 mRNA labeling was examined and quantified on X-ray films and emulsion radioautographs. We show that GAD67 mRNA labeling is significantly lower in PD compared to control cases. Analysis of emulsion radioautographs indicates that GAD67 mRNA labeling is decreased in individual neurons and is not paralleled by a decrease in the number of GAD67 mRNA-labeled neurons. Analysis of expression data from a microarray study performed in 29 control and 33 PD samples from BA9 confirms that GAD67 expression is decreased in PD. Another finding from the microarray study is a negative relationship between GAD67 mRNA expression and age at death. Altogether, the results support the possibility that GABAergic neurotransmission is impaired in the DLPFC in PD, an effect that may be involved in some of the behavioral deficits associated with the disease.
Parkinson’s disease (PD) is primarily characterized by motor symptoms such as tremor, rigidity and bradykinesia, but it is well recognized that mild to severe cognitive dysfunction is present even in the early stages of the disease, significantly affecting quality of life (Brown and Marsden, 1990; Dubois and Pillon 1997; Karlsen et al., 1998). Dementia will most often be seen in later stages of the disease (Mori, 2005). Cognitive deficits in PD include deficits in executive functions such as working memory, planning, sequence learning and visuomotor processing, functions that are classically attributed to the dorsolateral prefrontal cortex (DLPFC) (Goldman-Rakic, 1995; Fuster, 2000). The DLPFC includes Brodmann area 46 (BA46) and 9 (BA9) (e.g. Petrides, 2000). Imaging studies have documented abnormalities in the activation of the DLPFC in PD patients. For instance, regional blood flow is decreased in the DLPFC of PD patients compared to controls (Kikuchi et al., 2001) and a decreased fMRI signal was detected in the right and left DLPFC in cognitively impaired patients compared to cognitively unimpaired PD patients (Lewis et al., 2003). Activation of the DLPFC was also associated with motor sequence learning (Nakamura et al., 2001) or target retrieval (Carbon et al., 2003) in control and PD patients. Furthermore, deep-brain stimulation (DBS) of the subthalamic nucleus (STN) in PD patients alters regional blood flow (Sestini et al., 2002) or the fMRI signal in BA9/10 (Stefurak et al., 2003). Increased cerebral blood flow in the DLPFC induced by DBS of the STN correlates with DBS-induced decreased performance on the spatial delayed response task, a test of working memory (Campbell et al., 2008). It is therefore possible that altered activity of the DLPFC is involved in cognitive deficits in PD. Although dopamine, serotonin and acetylcholine in the DLPFC have been involved in cognitive deficits (e.g. Brooks and Piccini, 2006; Cools, 2006), the nature and mechanisms of neurochemical imbalances that could be associated with cognitive dysfunction in PD are still poorly documented.
GABAergic interneurons play a key role in the circuitry of the cerebral cortex and the DLPFC, where they exert a major control on the activity of pyramidal neurons. Earlier biochemical studies assessed the impact of PD on the activity of the GABA-synthesizing enzyme, glutamic acid decarboxylase (GAD) (Montfort et al., 1985; Nishino et al., 1988) or GABA levels (Gerlach et al., 1996) in the prefrontal cortex, but no significant effect was reported. However, decreased binding of muscimol to GABAA receptors was shown in BA9 (Nishino et al., 1988) indicating that altered GABAergic activity in this area might be a neuropathological feature of PD. Two different isoforms of GAD known as GAD67 and GAD65, encoded by two genes GAD1 and GAD2, are involved in the biosynthesis of GABA in GABAergic neurons in the adult brain (Erlander et al., 1991; reviewed in Soghomonian and Martin, 1998). The GAD67 isoform is known to provide most levels of neuronal GABA in vivo (Asada et al., 1997) and is highly expressed in the cerebral cortex (Feldblum et al., 1993; Esclapez et al., 1994; Hendrickson et al., 1994). In order to further assess the possibility that the activity of GABAergic neurons in the prefrontal cortex is altered in PD, we used in situ hybridization histochemistry to detect and measure GAD67 mRNA labeling in BA9 from control and PD brains. Additionally, we analyzed microarray expression data to contrast GAD67 mRNA levels in control and PD samples of BA9.
Subjects and Methods
Human subjects and tissue sectioning
For the in situ hybridization studies, samples of BA9 were obtained from the Harvard Brain Tissue Resource Center (HBTRC; McLean Hospital, Belmont, Massachusetts) and the Sun Health Research Institute (SHRI; Sun City, Arizona) (Table 1). For the microarray study, samples from HBTRC, SHRI, and the Human Brain and Spinal Fluid Resource Center (HBSFRC) VA West Los Angeles Healthcare Center, California, were used (Table 2). All subjects were male. All subjects included in the PD group had a clinical diagnostic of PD and a pathological diagnostic of PD determined by the presence of Lewy bodies in the substantia nigra, pars compacta, but cognitive measures were not available. The pH of all samples used in the microarray, and 33 of 39 samples used in the in situ hybridization, was available and measured as described by Harrison et al., (1995). For each sample, at least two pH readings were taken, and the mean of these values was used. Age at death and post-mortem interval (PMI) were available for all samples used in the in situ hybridization and microarray analyses. For the microarray analyses, the RNA integrity number (RIN) was determined with an Agilent 2100 Bioanalyzer (see Table 3). Disease duration, defined as the time elapsed between the onset of motor symptoms and death, was available for all but four PD cases.
Table 1.
Human subjects data used for the in situ hybridization experiments.
| Gender | Age at Death (years) | PMI (hours) | pH | Disease Duration (years) | Cause of Death | Dementia Status |
|---|---|---|---|---|---|---|
| Harvard Brain Tissue Resource Center (HBTRC) | ||||||
| Control Cases | ||||||
| Male* | 66 | 18.7 | 6.75 | N/A | Myocardial infarction | N/A |
| Male* | 69 | 15.3 | 7.323 | N/A | Respiratory Failure; Chronic obstructive pulmonary disease | N/A |
| Male | 40 | 16.6 | 6.5925 | N/A | Cardiac | N/A |
| Male | 106 | 21 | 6.7075 | N/A | Congestive heart failure; Acute renal failure; Myocardial infarction | N/A |
| Male | 44 | 28.17 | 6.965 | N/A | Cardiac arrest | N/A |
| Male | 57 | 24.42 | 6.7125 | N/A | Myocardial infarction | N/A |
| Male | 43 | 14.68 | 6.985 | N/A | Myocardial infarction | N/A |
| Male | 52 | 22.95 | 6.3725 | N/A | Heart Attack | N/A |
| PD Cases | ||||||
| Male | 75 | 29.6 | 6.235 | 14 | Aspiration Pneumonia | Yes |
| Male | 68 | 18.4 | N/A | 6 | Myocardial infarction | Yes |
| Male | 68 | 22.87 | 6.8475 | 5 | Cardiac Arrest | N/A |
| Male | 79 | 11.77 | 6.415 | 13 | Aspiration Pneumonia | Yes |
| Male | 75 | 19.42 | 5.885 | 18 | Dementia; PD | Yes |
| Male* | 74 | 15.15 | 6.67 | N/A | End Stage PD; Bladder Infection | N/A |
| Male* | 89 | 30.75 | 6.675 | 17 | End Stage PD | No |
| Male* | 66 | 11.21 | 6.735 | 11 | PD | No |
| Sun Health Research Institute (SHRI) | ||||||
| Control Cases | ||||||
| Male* | 86 | 3 | 6.435 | N/A | Respiratory Failure | N/A |
| Male* | 91 | 1.5 | 6.29 | N/A | Metastatic Bladder Cancer | N/A |
| Male | 73 | 2.5 | 6.845 | N/A | Acute myeloid leukemia due to myelodysplastic syndrome | N/A |
| Male* | 97 | 1.5 | 7.137 | N/A | Metastatic Colon Cancer | N/A |
| Male | 74 | 2.5 | N/A | N/A | Cardiac and/or respiratory failure | N/A |
| Male | 69 | 2 | N/A | N/A | Prostate cancer | No |
| Male* | 79 | 2 | 6.915 | N/A | Cardiac and/or respiratory failure | N/A |
| Male | 76 | 2.5 | N/A | N/A | Pancreatic cancer | N/A |
| Male | 78 | 2.66 | N/A | N/A | Cardiac and/or respiratory failure | N/A |
| Male* | 63 | 1.5 | 6.603 | N/A | Acute intracerebral hemorrhage | N/A |
| Male | 86 | 2.5 | 7.1075 | N/A | Congestive heart failure; Ischemic cardiomyopathy | N/A |
| Male | 78 | 1.66 | N/A | N/A | Lung cancer; Heart failure | N/A |
| PD Cases | ||||||
| Male* | 85 | 4 | 6.537 | 15 | Ruptured abdominal aortic aneurysm | No |
| Male | 85 | 2.16 | 6.7275 | 6 | Lung cancer | No |
| Male* | 77 | 1.66 | 6.438 | 13 | PD | N/A |
| Male | 72 | 2 | 6.5 | 10 | Brain cancer - glioblastoma | N/A |
| Male | 83 | 2 | 6.58 | 7 | Pneumonia; hypertension; vascular dementia | Yes |
| Male* | 72 | 3.5 | 6.72 | 17 | Possible Cerebrovascular accident; End stage PD | Yes |
| Male* | 77 | 1.16 | 6.593 | 22 | End stage PD; Complications from fall | No |
| Male* | 83 | 2.16 | 6.838 | 4 | End stage PD | Yes |
| Male* | 80 | 2.25 | 6.65 | 25 | End stage PD; Inanition | No |
| Male* | 84 | 2.5 | 6.47 | 4 | N/A | Yes |
| Male* | 88 | 2 | 6.71 | 3 | End stage Chronic obstructive pulmonary disease | Yes |
Indicates subjects also used in the microarray study.
Table 2.
Human subjects data for the microarray experiments. Additional subjects overlapping with the in situ hybridization experiment are listed in Table 1.
| Gender | Age at Death (years) | PMI (hours) | pH | Disease Duration (years) | Cause of Death | Dementia Status |
|---|---|---|---|---|---|---|
| Harvard Brain Tissue Resource Center (HBTRC) | ||||||
| Control Cases | ||||||
| Male | 79 | 20.92 | 6.463 | N/A | Pancreatic cancer | N/A |
| Male | 61 | 10.08 | 6.52 | N/A | Myocardial infarction | N/A |
| Male | 58 | 20.16 | 6.695 | N/A | Cancer | N/A |
| Male | 70 | 20.93 | 6.815 | N/A | Myocardial infarction | N/A |
| Male | 66 | 16.97 | 6.75 | N/A | Myocardial infarction | N/A |
| Male | 73 | 19.42 | 6.71 | N/A | Chronic obstructive pulmonary disease | N/A |
| Male | 60 | 24.23 | 6.875 | N/A | Myocardial infarction | N/A |
| Male | 76 | 26.16 | 6.52 | N/A | Myocardial infarction | N/A |
| Male | 61 | 17 | 6.79 | N/A | Myocardial infarction | N/A |
| Male | 62 | 18.33 | 6.435 | N/A | Myocardial infarction; Pulmonary edema | N/A |
| Male | 69 | 25.92 | 6.635 | N/A | Myocardial infarction; Coronary artery disease | N/A |
| Male | 61 | 25 | 7.005 | N/A | Myocardial infarction | N/A |
| Male | 88 | 11.06 | 6.365 | N/A | Cardiopulmonary arrest | N/A |
| Male | 71 | 39.67 | 6.67 | N/A | Alcoholic liver disease | N/A |
| PD Cases | ||||||
| Male | 94 | 9.25 | 6.79 | N/A | Respiratory Arrest; PD | N/A |
| Male | 80 | 27.05 | 6.765 | 20 | Pneumonia; PD | Yes |
| Male | 67 | 8.25 | 6.675 | 9 | End stage PD; Aspiration pneumonia | No |
| Male | 77 | 22.67 | 6.403 | 37 | N/A | Yes |
| Male | 85 | 15.75 | 6.53 | 20 | PD | No |
| Male | 75 | 6.67 | 6.935 | N/A | Cardiac arrest | N/A |
| Male | 65 | 7.83 | 7.13 | N/A | N/A | N/A |
| Sun Health Research Institute (SHRI) | ||||||
| Control Cases | ||||||
| Male | 73 | 2.25 | 6.62 | N/A | Myocardial infarction | N/A |
| Male | 82 | 2.16 | 6.645 | N/A | Cardiorespiratory arrest | N/A |
| Male | 86 | 4.75 | 6.348 | N/A | Myocardial infarction | N/A |
| Male | 89 | 5.5 | 6.447 | N/A | Chronic obstructive pulmonary disease | N/A |
| Male | 91 | 2 | 6.397 | N/A | End stage renal disease | N/A |
| Male | 81 | 2.75 | 6.597 | N/A | Cardiac and/or respiratory failure | N/A |
| PD Cases | ||||||
| Male | 70 | 1.83 | 6.678 | 12 | End stage PD | Yes |
| Male | 74 | 3 | 6.475 | 2 | Cardiopulmonary arrest and respiratory failure | Yes |
| Male | 70 | 2.33 | 6.583 | 40 | Coronary artery disease; End stages of PD | Yes |
| Male | 83 | 2 | 6.58 | 7 | Pneumonia; Hypertension | Yes |
| Male | 73 | 7.16 | 6.691 | 18 | Respiratory distress; Pulmonary edema-asthma | No |
| Male | 69 | 4.16 | 6.665 | 1 | Myocardial infarction; Coronary artery disease | Yes |
| Male | 75 | 2.25 | 6.277 | 0 | Temporal lobe hemorrhage | Yes |
| Male | 80 | 2 | 6.545 | 11 | Probable myocardial infarction | No |
| Male | 72 | 3 | 6.61 | 26 | End stage PD | Yes |
| Male | 81 | 2.5 | 6.628 | 8 | Small cell carcinoma of lung | No |
| Male | 77 | 4 | 6.763 | 4 | Cardiac-respiratory failure; Myocardial infarction | No |
| Male | 64 | 3.75 | 7.043 | 5 | Complications of lung cancer | N/A |
| Male | 85 | 2.66 | 6.755 | 0 | PD | Yes |
| Human Brain and Spinal Fluid Resource Center (HBSFRC) | ||||||
| Control Cases | ||||||
| Male | 80 | 25.5 | 6.265 | N/A | Aspiration pneumonia | Yes |
| Male | 93 | 12.9 | 6.555 | N/A | Chronic obstructive pulmonary disease | N/A |
| PD Cases | ||||||
| Male | 87 | 11.7 | 6.47 | 11 | Respiratory failure due to aspiration pneumonia | N/A |
| Male | 85 | 19.3 | 6.475 | 14 | Cardiovascular failure | N/A |
Table 3.
Characteristics of samples for the in situ hybridization and microarray analyses.
| Study | Disease status (n) | Mean age at death, years (range) | Mean PMI1, hours (range) | Mean RIN2 (range) | Tissue pH (range) |
|---|---|---|---|---|---|
| In situ hybridization | Control (20) | 71.35 (40–106) | 9.38 (1.50–28.17) | 7.40 (6.40–8.10)* | 6.78 (6.29–7.32) |
|
| |||||
| PD (19) | 77.89 (66–89) | 9.71 (1.16–30.75) | 7.20 (5.60–8.40)* | 6.56 (5.88–6.84) | |
|
| |||||
| t-test p-value+ | 0.140 | 0.916 | 0.614 | 0.030 | |
|
| |||||
| Microarray | Control (29) | 75.21 (58–97) | 13.70 (1.50–39.67) | 7.36 (4.8–8.5) | 6.64 (6.26–7.32) |
| PD (33) | 77.67 (64–94) | 7.43 (1.16–30.75) | 7.182 (5.2–8.4) | 6.65 (6.27–7.13) | |
| t-test p-value+ | 0.335 | 0.010 | 0.438 | 0.842 | |
PMI: post-mortem interval
RIN: RNA Integrity Number
RIN available only for samples present in the microarray study
t-test between PD and control values
The human tissue blocks were stored at −80°C. For in situ hybridization histochemistry, 10μm-thick sections were cut at −20 ° C using a cryostat. The exact angle of cutting relative to the pial surface could not be controlled for because the samples were provided by the brain banks and the exact orientation of the tissue was unknown. Each section was thaw-mounted onto a chromalum gelatin-coated glass slide and stored at −80 ° C until further processing.
In situ hybridization histochemistry
A 35S radiolabeled complementary RNA (cRNA) probe was transcribed in vitro from a human GAD67 complementary DNA (cDNA) (Soghomonian et al., 1994). The cDNA inserted into the transcription vector Bluescript M13/+/SK was linearized with the restriction enzyme, BamH1, according to standard protocols (Maniatis et al., 1982). Transcription of the radioactive GAD67 cRNA probe was performed for 2 hours at 37° C in the presence of 2.5 μM 35S-uracil triphosphate (UTP; specific activity 1250 Ci/mmol; PerkinElmer Life Sciences) and 10 μM unlabeled UTP with adenosine triphosphate (ATP), cytosine triphosphate (CTP), and guanine triphosphate (GTP) in excess. The cDNA template was then digested with DNAse I. The labeled cRNA was purified by phenol/chloroform extraction and ethanol precipitation. The cRNA probe length was reduced by partial alkaline hydrolysis to improve accessibility of the probe (Cox et al., 1984).
Two adjacent sections per subject were used in order to minimize the possibility that the labeling intensity on a particular section was due to the processing conditions and not representative of labeling in this tissue block. All sections used in the same quantitative analyses were strictly processed in parallel under identical conditions. The hybridization protocol was as previously published (Soghomonian et al., 1994). Briefly, sections were fixed in 3% paraformaldehyde, washed in 2×SSC, phosphate buffer saline, 0.25% acetic anhydride and triethanolamine, Tris-glycine, and dehydrated in ethanol. Sections were hybridized for 4 hours at 52° C with 8 ng of radiolabeled GAD67 cRNA probe in hybridization solution (containing 40% formamide, 10% dextran sulfate, 4×SSC, 10 mM dithiothreitol, 1.0% sheared salmon sperm DNA, 1.0% yeast tRNA, 1×Denhardt’s solution). Post-hybridization washes were in 50% formamide and RNAseA. After dehydration and defatting, sections were apposed to Kodak BioMax MR films in light-tight cassettes for 14 days. After the films were developed, slides were then processed for emulsion radioautography by dipping in Kodak NTB3 nuclear emulsion, air-dried for 3 hours, and stored in light-tight boxes for 14 days. Sections were developed in Kodak D-19, lightly counterstained with eosin and hematoxylin, and mounted with Eukitt (Sigma-Aldrich Chemicals, St. Louis, MO)
Quantification of GAD67 mRNA labeling on X-ray film radioautographs
Images on X-ray film radioautographs were visualized using a Macintosh computer connected to a Sony CCD video camera. The analog signals of mRNA labeling on X-ray films were converted to a digital image of 640 × 480 pixels using NIH Image 1.61 Software. The levels of mRNA labeling were then analyzed using NIH ImageJ64 software (http://rsb.info.nih.gov/ij/). This was accomplished by outlining the region to be quantified with the freehand drawing tool of NIH image. The area inside the outline was measured in pixels. Then, using the threshold function of NIH image, the area covered by silver grains within the outline was highlighted. For each section, the highlighted area was then measured in pixels. The threshold used to highlight silver grains was identical for all sections analyzed. The density of mRNA labeling for each brain section was calculated by dividing the area covered by silver grains by the sampled area. Two adjacent sections per subject were analyzed, and the mean of those two measurements was reported. The investigator who performed this quantification was blind to the experimental groups.
Quantification of GAD67 mRNA labeling on emulsion radioautographs
Levels of GAD67 mRNA labeling were quantified at the single cell level on sections processed for in situ hybridization histochemistry. Individual neurons were visualized under bright-field illumination with a 60X objective on a Nikon E600 microscope connected to a Sony CCD camera, which was connected to a Macintosh computer. Microscope images were observed live with NIH Image 1.61. The area covered by silver grains over each neuron was measured by computerized image analysis using the density slice function. For each section, 50 neuronal profiles were randomly sampled and analyzed and the labeling was reported as a number of pixels per profile. For each subject, two adjacent sections were analyzed so that the mean number of pixels per neuronal profile was calculated as the mean of 100 profiles. We cannot rule out that some cells may have been quantified twice on each of the two adjacent sections. However, this possibility was rather unlikely since the sampled cells were randomly selected out of a large number of cells on each tissue section. The investigator who performed this quantification was blind to the experimental groups.
Density of GAD67 mRNA-labeled neuronal profiles
An unbiased sampling scheme using StereoInvestigator software (Micro Bright Field Biosciences, version 7.5) was applied to compare on emulsion radioautographs the relative density of GAD67 mRNA-labeled neuronal profiles per unit area in PD versus controls. The workstation consisted of a Dell desktop computer loaded with the StereoInvestigator software and connected to a Hitachi CCD camera and Zeiss light microscope with an automated stage. The counting objects for this study were any soma labeled with at least five silver grains. The contour function was used to outline the region of interest, which was the largest available continuous area of grey matter on each tissue section. The grid size for the study was 0.5 mm × 0.5 mm for an area of 0.25 mm2. The x-y dimensions of the counting frame were 70 μm × 50 μm yielding an area of 3500 μm2. For each site visited, StereoInvestigator recorded the number of labeled neurons per counting frame. Any soma meeting criteria that made contact with an exclusionary line was not counted and any within the counting frame or in contact with an inclusionary line was counted. These rules ensure that all objects regardless of size, shape and/or orientation have an equal chance of being counted once (Gundersen et al., 1988; Mouton, 2002). The average density of labeled neuronal profiles was calculated by dividing the total number of neuronal profiles sampled in the two adjacent sections by the total area sampled. The total area sampled was the area of each counting frame multiplied by the number of sites visited. The average number of neuronal profiles counted was 132 per subject and the average number of counting frames visited was 339 per subject.
Microarray analysis
Thirty-three PD and 29 control male samples from BA9 were selected based on 1) lack of reported Alzheimer’s disease pathology, 2) pH value >6.25, and 3) similar age at death for PD cases and controls (Table 3). Total RNA for these samples was extracted with TRIzol (Invitrogen, Carlsbad, CA). RNA was purified using the RNeasy MinElute Cleanup columns (Qiagen Sciences Inc, Germantown, MD) and its quality was assessed with an Agilent 2100 Bioanalyzer Nano Chip (Agilent, Foster City, CA). Two μg of each RNA sample were labeled and hybridized to the One-Color Agilent 60-mer Whole Human Genome Microarray at the Microarray Facility of the Whitehead Institute for Biomedical Research (Cambridge, MA). The dye-normalized and post surrogate processed signal for the green channel, gProcessedSignal, obtained from Agilent’s Feature Extraction Software was used for downstream analyses. The quality control reports for each of the 62 samples were individually inspected, and no systematic errors were determined for any sample. All the microarray processing analyses were performed in R (http://www.R-project.org). The expression data for the 38,995 probes retained after standard filtering criteria were quantile normalized, and natural logarithm transformed. One probe for the coding region of the GAD67 transcript of the GAD1 gene (A_24_P319711, targeting the junction between exons 9 and 10, sequence: CTTGGCTTTGGAACTGACAATGTGATTTTGATAAAGTGCAATGAAAGGGGGAAAAT AATT) was available.
Statistical Analyses
Unless otherwise noted, a p-value<0.05 was considered significant. For the in situ hybridization studies, comparisons of GAD67 mRNA labeling, density of GAD67 mRNA-labeled neurons, pH, age at death, and PMI between control and PD groups were analyzed with two-tailed unpaired t-tests. Correlations between mRNA labeling and age at death, PMI, disease duration, and pH, and between mRNA labeling measured on X-ray films versus mRNA labeling measured on emulsion radioautographs, were analyzed by linear regression. An analysis of covariance (ANCOVA) was used to determine the possible effects of the covariate pH with p<0.05 considered significant.
For the microarray study, the normalized and log transformed mRNA levels were modeled as the dependent variable and the association of PD/control status was adjusted for RIN, PMI, and age at death. We included RIN in the linear model (in addition to age at death and PMI), but not pH, because of the high correlation observed in our data between RIN and pH (Spearman correlation coefficient=0.403, p=0.001). The RIN variable was chosen over pH since it had a larger range of values (Table 3).
Results
GAD67 mRNA levels in PD
GAD67 mRNA labeling was first detected and measured on X-ray films. As shown on Figure 1, labeling appeared distributed across the cortical thickness but no consistent pattern of laminar distribution could be observed in our samples. GAD67 mRNA labeling was less intense in sections from PD cases compared to control cases (Figure 1A–D) and this difference was seen in both the HBTRC and SHRI groups. Quantitative analysis of X-ray films from all subjects confirmed that GAD67 mRNA labeling is significantly lower in the PD group compared to the control group in the brains from the HBTRC and the SHRI (Figure 2). Earlier studies have shown that dementia is paralleled by a decrease in GAD activity in several brain regions including the frontal cortex (e.g. Perry et al., 1977). Because some PD patients were diagnosed with dementia, we tested the possibility that the presence of dementia had an impact on GAD67 mRNA labeling. GAD67 mRNA labeling in PD brains that had a diagnostic of dementia (n=9) and those that did not (n=6) was not significantly different (mean±SEM respectively 0.0434 ± 0.0181 and 0.0696±0.0231; p=0.38).
Figure 1.
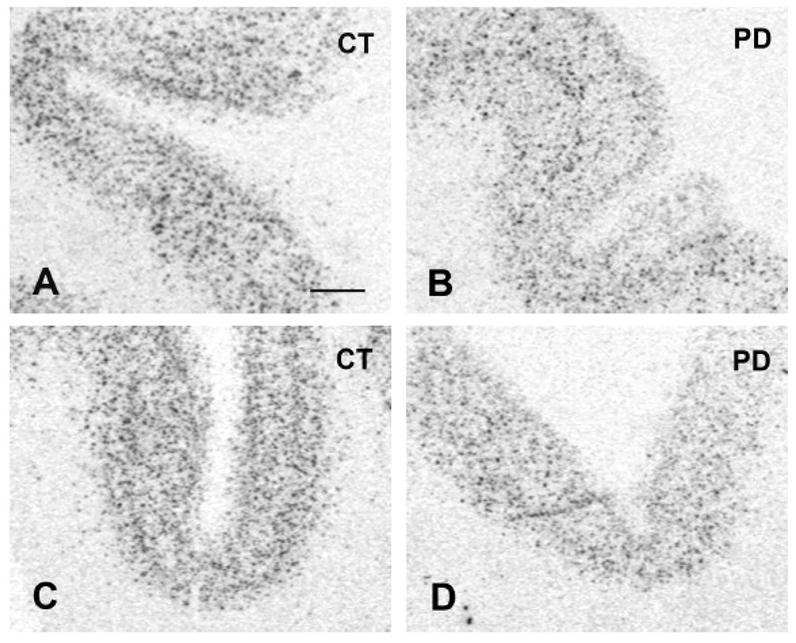
Photographs from X-ray films illustrating GAD67 mRNA labeling in prefrontal cortex BA9. A=Control from the HBTRC. B=PD case from the HBTRC. C=Control from the SHRI. D=PD case from the SHRI. Scale bar: 1 mm.
Figure 2.
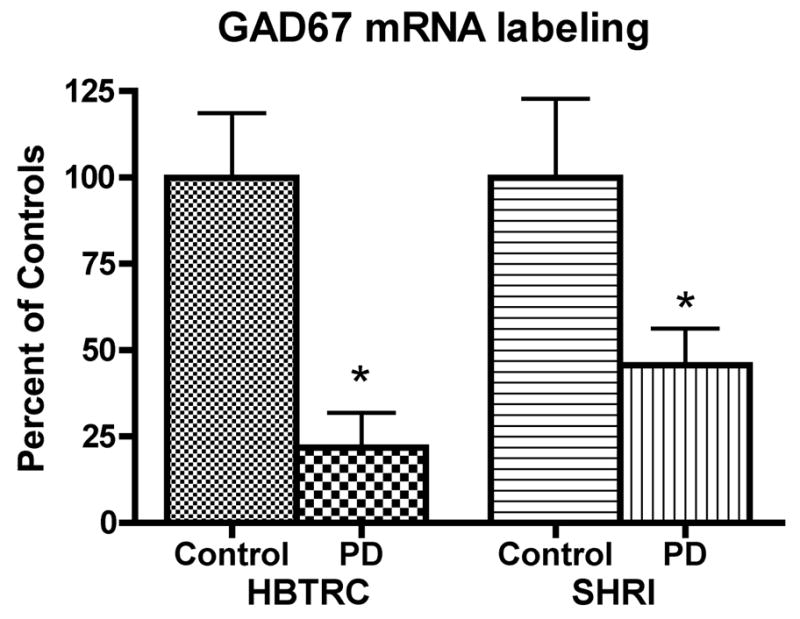
Relative levels of GAD67 mRNA labeling in prefrontal cortex BA9. Values represent the mean (±SEM) mRNA labeling measured on X-ray film radioautographs, and are expressed as percent of controls. For the HBTRC, data are from 8 controls and 8 PD cases. For the SHRI, data are from 12 controls and 11 PD cases (HBTRC: *p<0.005 vs. controls; SHRI: *p<0.05 vs. controls; two-tailed unpaired t-test).
It is well documented that tissue pH can affect levels of some mRNAs in post-mortem brain and that this effect is related to the agonal state (e.g. Harrison et al., 1995; Kingsbury et al., 1995; Mexal et al., 2006). In order to determine if pH had a significant effect on GAD67 mRNA labeling, we performed an ANCOVA with pH as a covariate. Results indicated a main effect of pH and group (p<0.0256 for group and p<0.0146 for pH). In addition, when all control and PD subjects are pooled, GAD67 mRNA labeling was positively and significantly correlated with tissue pH (Figure 3A), raising the possibility that tissue pH may explain the differences in GAD67 mRNA labeling between control and PD groups. In order to control for the extraneous variable pH, we used the equation from the regression line between pH and mRNA to calculate expected values for mRNA and derive residuals from the expected and actual values. We then compared the pH-corrected mRNA values (mRNA residuals) between control and PD groups and found a significant decrease in the PD group compared to the control group (Figure 3B), indicating that pH alone cannot account for the differences between groups. This conclusion was further tested by carrying out an ANCOVA of pH-corrected mRNA labeling values with pH as a covariate. In that case, the pH effect is not significant (p=0.3703) but the group effect is still significant (p=0.0256).
Figure 3.

A: Linear regression between tissue pH and GAD67 mRNA labeling measured on X-ray films. The regression analysis includes all brains from the HBTRC and the SHRI with known pH values. The positive correlation is significant (r=Pearson Correlation Coefficient; p=0.0013). B: Mean (±SEM) of pH-corrected levels of GAD67 mRNA labeling in prefrontal cortex BA9 of control and PD cases (*p<0.05 vs. control; two-tailed unpaired t-test).
Microarray analysis confirmed that GAD67 mRNA expression is lower in PD cases compared to controls. One probe (319711) was available for the coding region of the GAD67 transcript (see Methods). After adjustment for RIN, age at death and PMI covariates, this probe was significantly decreased in PD brains compared to controls (Table 4). As explained in the methods, pH was not included in the model because it was highly correlated with RIN. Nevertheless, although over-adjusted, the results obtained with pH in the model, in addition to age at death, PMI, and RIN, are still significant (beta estimate=−2.473, p=0.0164). Furthermore, in the samples used for the microarray analysis, average tissue pH was not significantly different between controls and PD cases (Table 3).
Table 4.
GAD67 microarray data expression results1.
| Probe (location) | # Samples (controls/cases) | p | Beta |
|---|---|---|---|
| 319711 (exons 9–10) | 62 (29/33) | 0.0142 | −0.267 |
adjusted for RIN, PMI, and age at death
achieves statistical significance
Analysis of GAD67 mRNA labeling on emulsion radioautographs
GAD67 mRNA labeling was further visualized and quantified at the single cell level on emulsion radioautographs from sections from the HBTRC samples (Figure 4A–D). Observation of radioautographs confirmed that GAD67 mRNA labeling was lower in neurons from PD cases compared to controls (Figure 4A–D). Quantitative analysis of silver grains shows that this difference is highly significant (Mean±SEM: control group=71.20±6.384 pixels; PD group=35.83±5.447 pixels; p=0.0009, two-tailed unpaired t-test, n=8). This observation indicates that the decrease in GAD67 mRNA labeling measured on X-ray films at the regional level involves a decrease in mRNA labeling per neuron. In addition, when the values gathered from the single cell analysis were plotted against the values obtained from film analysis, a highly significant positive correlation was found (Figure 5), which demonstrates the consistency of the two methods of analysis of radioautographic labeling. In order to assess the possibility that the decrease in GAD67 mRNA labeling was not also paralleled by a decrease in the number of GAD67 mRNA-labeled neurons, the average density of labeled neuronal profiles per unit area of tissue was estimated. There was no significant difference between the average density of GAD67 mRNA-labeled neuronal profiles in the control and the PD group (respectively 121 neuronal profiles/mm2 and 110 neuronal profiles/mm2; p=0.4813).
Figure 4.
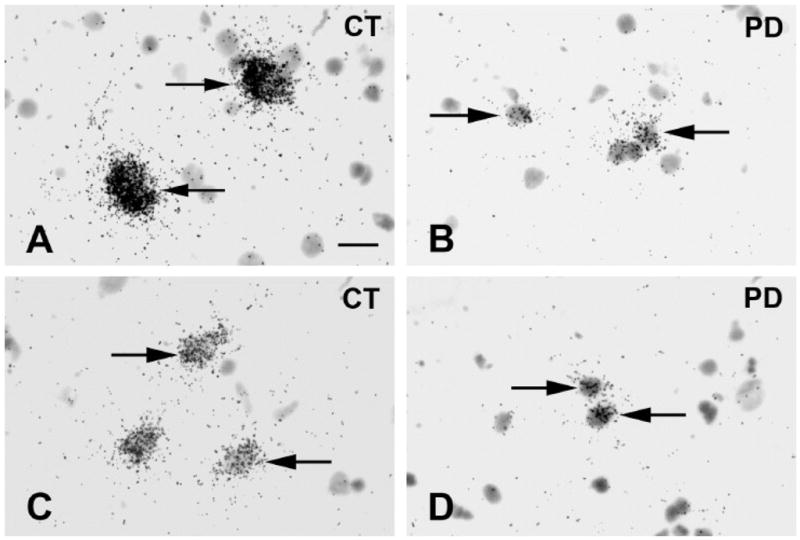
Bright-field photomicrographs illustrating GAD67 mRNA labeling on emulsion radioautographs in prefrontal cortex BA9. Cases are from the HBTRC. Arrows indicate clusters of silver grains over GAD67 mRNA labeled neurons. A=Control. B=PD case. C=Control. D=PD case. Scale bar: 20μm.
Figure 5.

Linear regression between GAD67 mRNA labeling measured by computerized image analysis of X-ray films versus single-cell computerized image analysis of emulsion radioautographs. Mean values are from 8 control and 8 PD cases from the HBTRC. (r=Pearson Correlation Coefficient; p<0.0001).
Correlations with other variables
Although control and PD brains used for the in situ hybridization studies were matched for age at death and PMI (Table 3), it is possible that these two variables had an impact on GAD67 mRNA labeling across all subjects. In order to test for this possibility, linear regression analyses were conducted between mRNA labeling and age at death or PMI. In the samples used for in situ hybridization studies, a negative relationship was found between GAD67 mRNA labeling values and age at death or PMI but these effects did not reach statistical significance (age at death data: see Figure 6B; PMI data: Pearson correlation coefficient: r=−0.2041, p=0.2126). Still, when the same two variables were investigated with the microarray data, age at death (r=−0.50, p<0.0001; Figure 6A) but not PMI (r=0.18, p=0.147), was significantly and negatively correlated with GAD67 mRNA expression levels. In the microarray data, the negative relationship was seen when control and PD cases were individually plotted against age at death. However, the correlation was stronger and reached significance for the controls only (Figure 6C and D).
Figure 6.

Linear regression analyses between age at death and GAD67 mRNA expression include control and PD samples from the microarray (A, C and D) or in situ hybridization (B) experiments. Analyses using data from control and all samples from the microarray experiment show a highly significant correlation. r=Pearson Correlation Coefficient. Panel B: p=0.4379. Panel D: p=0.1346.
Finally, in order to assess a possible role of disease duration on GAD67 mRNA levels, linear regression analyses were conducted between mRNA expression measured by in situ hybridization or by microarray analysis and disease duration in the PD group. As shown on Figure 7A and 7B, GAD67 mRNA expression was not correlated with disease duration. This later finding suggests that the decrease in GAD67 mRNA levels in BA9 is not an index of disease progression.
Figure 7.

A: Linear regression between disease duration in PD cases and mRNA labeling as measured on X-ray films. Regression includes all brains from the HBTRC and the SHRI except one, in which disease duration was not provided. No significant correlation is seen (r=Pearson Correlation Coefficient; p=0.9231). B: Linear regression between disease duration in PD cases and mRNA expression as determined by microarray analysis. No significant correlation is seen (r=Pearson Correlation Coefficient; p=0.5831).
Discussion
Our in situ hybridization histochemistry results provide original evidence that GAD67 mRNA levels are decreased in post-mortem prefrontal cortex of PD patients when compared to age-, sex- and PMI-matched controls. The results are confirmed by GAD67 microarray expression data from post-mortem samples from the same brain region after adjustment for RIN, age at death, PMI and pH. The microarray study also reveals a trend for decreased GAD67 mRNA expression with age but expression levels are not correlated with disease duration in PD cases. In addition, analyses at the single cell level indicate that the decrease in GAD67 mRNA expression in PD is associated with a decreased expression in individual neurons without significant loss of GAD67 mRNA-labeled neurons. The findings suggest that GABAergic activity is deficient in the prefrontal cortex of PD patients compared to controls.
GABAergic activity in the frontal cortex in PD
GAD67 is one of the major isoforms of GAD in the adult brain and studies in knockout mice indicate that this isoform is responsible for the synthesis of a large neuronal pool of GABA in the cerebral cortex (Asada et al., 1997). Our finding that GAD67 mRNA levels are decreased in post-mortem BA9 suggests that patients had deficient GABAergic neurotransmission in BA9. Earlier post-mortem studies in the prefrontal cortex reported that GAD activity was decreased in PD patients (Monfort et al., 1985). However, when the post-mortem severity index (PMSI) was controlled for, this difference was still present but no longer reached statistical significance (Monfort et al., 1985). Other studies failed to detect differences in GAD activity (Nishino et al., 1988) or GABA levels (Gerlach et al., 1996) in the frontal cortex of PD cases compared to control cases. The apparent lack of correspondence between our result on GAD67 mRNA expression and previous studies of GAD activity or GABA levels could be explained by methodological differences. Indeed, it is well documented that GAD activity and GABA levels are highly susceptible to PMI (e.g. Perry et al., 1977; Andén et al., 1987; Martin et al., 2003) and, in one of the studies mentioned above, GAD activity was measured in brains from PD cases and controls that had a different PMI (Monfort et al., 1985). In contrast to GAD activity or GABA levels, mRNAs are relatively stable in the post-mortem brain (Walker and McNicol, 1992; Harrison et al., 1995; Schramm et al., 1999). In our studies, GAD67 mRNA levels were correlated with tissue pH, a finding consistent with the possibility that the agonal state has an impact on mRNA levels in the post-mortem brain. However, GAD67 mRNA levels were still significantly lower in PD brains than in controls when the pH effect was taken into account in both our in situ hybridization and microarray analyses. In addition, our conclusion that GABAergic activity is altered in BA9 of the prefrontal cortex is supported by an earlier anatomical study showing that muscimol binding to GABAA receptors in this region is decreased in PD compared to control brains (Nishino et al., 1988).
Analysis of emulsion radioautographs in our study indicated that the decrease in GAD67 mRNA levels in the prefrontal cortex occurred in individual neurons. Our cell profile counting analysis showed that the average density of GAD67 mRNA-labeled neurons was slightly lower in PD cases compared to controls but this difference was not statistically significant. It is therefore assumed that the decrease in GAD67 mRNA levels can be explained mainly by a decrease in mRNA expression per neuron without significant loss of cortical GABAergic neurons. This conclusion appears consistent with evidence that no global loss of neocortical neurons occurs in brains of PD patients with relatively short disease duration (Pedersen et al., 2005).
Several classes of GABAergic interneurons are distributed throughout the prefrontal cortex. In particular, GABAergic basket and chandelier cells co-express the calcium-binding protein parvalbumin and their axon terminals target the soma or axon initial segment of pyramidal neurons whereas double bouquet cells, Martinotti cells, and neurogliaform cells express other calcium-binding proteins including calretinin or calbindin and target the distal dendrites of pyramidal cells or other GABAergic interneurons (Reviewed in Benes and Berretta, 2001; Lewis et al., 2005). In the cerebral cortex, basket cells are most abundant in layers III–V while chandelier cells are predominant in layers II–III (Benes and Berretta, 2001). On the other hand, calbindin-positive neurons are mostly found in layer II and the upper third of layer III (e.g. Rajkowska et al., 2007). Quantification of GAD67 mRNA labeling in different layers was not attempted in our study because the lamination of cortical neurons in these post-mortem samples was not clear, presumably because the angle of sectioning varied between different samples and because of the less than optimal morphological preservation. However, based on the observation of X-ray films and emulsion radioautographs, the decrease in GAD67 mRNA levels in our study seemed to involve the whole cortical thickness, suggesting that the decrease may have involved several classes of GABAergic interneurons. However, this possibility remains to be established.
Functional considerations
Motor symptoms such as tremor, rigidity and bradykinesia are classical PD symptoms. It is now well recognized that cognitive dysfunction is also present in the early stages of the disease (e.g. Brown and Marsden, 1990; Dubois and Pillon 1997; Karlsen et al., 1998). Imaging studies have documented abnormalities in the activation of the DLPFC in PD patients (Kikuchi et al., 2001; Lewis et al., 2003). On the other hand, various stimulation experiments have shown that inhibitory cortical pathways are less excitable in the cortex of PD patients (e.g. Ridding et al., 1995; Pierantozzi et al., 2001; Buhmann et al., 2004; Lefaucheur, 2005). The finding that GAD67 mRNA expression is decreased in the prefrontal cortex suggests that deficient GABAergic signaling in PD patients is involved in the cognitive abnormalities and/or abnormal cortical inhibition. Interestingly, earlier studies in humans have shown that GAD67 mRNA expression is also decreased in the caudate, putamen and ventral striatum and external, but not internal, globus pallidus of PD compared to controls (Levy et al., 1995; Nisbet et al., 1996; Herrero et al., 1996). In another study, GAD67 mRNA labeling was slightly lower in the putamen of aged versus young human control brains and even lower in PD brains but these effects did not reach statistical significance (Backman et al., 2007). Therefore, decreased GAD67 mRNA expression in PD may occur in subcortical as well as cortical brain regions.
Our results suggest that GAD67 mRNA expression decreases in BA9 with age. Although the effect reached significance only in the microarray study when all samples or only controls were included, the decrease suggests that GABAergic neurotransmission is impaired in normal aging. This possibility is consistent with recent electron microscope studies in macaque monkeys showing that aging is paralleled by a loss of inhibitory synapses in the prefrontal cortex (Peters et al., 2008). Another study in rats found a decrease in GAD levels with aging in the auditory cortex (Burianova et al., 2009), suggesting that such a decrease may affect several cortical regions. In any case, the finding that the negative relationship between GAD67 mRNA expression and age at death is not stronger for PD cases suggests that disease condition does not accelerate the rate of decrease of GAD67 mRNA expression with age. An earlier study found that decreased GAD67 mRNA expression in the caudate and putamen in PD cases was not correlated with age at death (Levy et al., 1995). Thus, it is unclear if decreased GAD67 expression in normal aging in humans also affects subcortical regions. On the other hand, the lack of correlation between GAD67 mRNA expression and disease duration in PD brains suggests that the decrease in mRNA expression may occur early in the disease process.
The mechanisms involved in the decrease in GAD67 mRNA levels in prefrontal cortex from post-mortem PD compared to control brains are unclear but could be linked to distinct contributing factors. First, it is possible that decreased gene expression is linked to widespread cellular dysfunction in the prefrontal cortex. For instance, Lewy body pathology (Reviewed in Mori, 2005; Jellinger, 2008), altered alpha-synuclein expression (Kingsbury et al., 2004) and mitochondrial dysfunction (Parker et al., 2008) have been reported in the frontal cortex in PD. It should be mentioned, however, that Lewy body pathology is usually associated with the limbic system and that the contribution of Lewy bodies and neurites to cognitive impairments in PD remains controversial (Ferrer, 2009). Alzheimer’s disease pathology has also been found in PD brains (e.g. Braak et al., 1996). However, the brains used in our study had low Braak stages suggesting that Alzheimer’s pathology in the prefrontal cortex may not be a major contributing factor. Alteration of GABAergic activity in the DLPFC could also be secondary to a deficit in dopamine neurotransmission. It is well known that the DLPFC receives relatively dense dopaminergic innervation (Levitt et al., 1984; Lewis et al., 1987, 1988; Berger et al., 1988) and earlier studies have documented a decrease in dopaminergic innervation in the prefrontal cortex (Gaspar et al., 1991) and decreased dopamine transporter binding site density in the orbitofrontal cortex in PD (Ouchi et al., 1999). Through the activation of dopamine D1 receptors, dopamine can increase the excitability of GABAergic interneurons in the frontal/prefrontal cortex (Zhou and Hablitz 1999; Gorelova et al., 2002; Gao and Goldman-Rakic 2003; Kröner et al., 2007) and the loss of dopamine could depress the activity of these neurons, which may result in a decrease in GAD67 expression. However, the possibility that prefrontal dopamine is deficient in PD is uncertain since imaging studies show that, even in advanced PD, methamphetamine can induce dopamine release in the prefrontal cortex to a similar extent in control and PD patients (Piccini et al., 2003). In addition, in vivo imaging studies indicate that raclopride binding is reduced during a working memory task to a similar extent in the anterior cingulate cortex in both control and PD patients, suggesting that dopamine release is preserved in the prefrontal cortex in PD brains (Sawamoto et al., 2008). A third mechanism that could account for an alteration of GABAergic activity in PD is as a result of dysfunction of the basal ganglia-thalamocortical circuitry. Retrograde axonal tracing studies in primates have shown that the DLPFC, including BA9, is an integral part of the cortico-basal ganglia-thalamocortical circuit (Reviewed in Middleton and Strick 2002). The globus pallidus internus and the substantia nigra, pars reticulata, send projections to BA9 via a thalamic relay (Middleton and Stick, 2002). The GABAergic ouput from the basal ganglia is abnormally enhanced in PD (e.g. Wichman and DeLong, 1996), which could induce a depression of thalamocortical projections that synapse on cortical GABAergic interneurons.
Conclusions
We provide original evidence for a decrease in GAD67 mRNA expression in BA9 of the prefrontal cortex in PD. This suggests that GABAergic neurotransmission is depressed in the prefrontal cortex in PD. Interestingly, altered activity in subsets of GABAergic neurons in the DLPFC has been linked to deficits in working memory in schizophrenia (Reviewed in Lewis et al., 2005; Lisman et al., 2008). It would be of interest to determine if similar mechanisms are linked to deficits in working memory or other cognitive abnormalities in PD patients. Such a determination would be helpful in designing new therapeutic approaches to cognitive dysfunction in PD.
Acknowledgments
The authors would like to thank the following institutions for providing us with brain tissue used in this study: the Sun Health Research Institute in Sun City, Arizona, which is supported by the National Institute on Aging (P30 AG19610 Arizona Alzheimer’s Disease Core Center), the Arizona Department of Health Services (contract 211002, Arizona Alzheimer’s Research Center), the Arizona Biomedical Research Commission (contracts 4001, 0011 and 05-901 to the Arizona Parkinson’s Disease Consortium) and the Prescott Family Initiative of the Michael J. Fox Foundation for Parkinson’s Research, the Harvard Brain Tissue Resource Center, which is supported in part by PHS grant number R24 MH 068855, and the Human Brain and Spinal Fluid Resource Center VA West Los Angeles Healthcare Center, 11301 Wilshire Blvd. Los Angeles, CA 90073, which is sponsored by NINDS/NIMH, National Multiple Sclerosis Society, Department of Veterans, the Bumpus Foundation, and R01-NS036711 (Genetic Linkage Study in Parkinson’s disease). We also acknowledge the support of the American Parkinson’s Disease Association (APDA).
Footnotes
Publisher's Disclaimer: This is a PDF file of an unedited manuscript that has been accepted for publication. As a service to our customers we are providing this early version of the manuscript. The manuscript will undergo copyediting, typesetting, and review of the resulting proof before it is published in its final citable form. Please note that during the production process errors may be discovered which could affect the content, and all legal disclaimers that apply to the journal pertain.
References
- 1.Anden NE, Lindgren S, Magnusson A. Regional differences in the changes in rat brain GABA concentrations post mortem and following inhibition of the synthesis and metabolism. Pharmacol Toxicol. 1987;60:393–396. doi: 10.1111/j.1600-0773.1987.tb01534.x. [DOI] [PubMed] [Google Scholar]
- 2.Asada H, Kawamura Y, Maruyama K, Kume H, Ding RG, Kanbara N, Kuzume H, Sanbo M, Yagi T, Obata K. Cleft palate and decreased brain gamma-aminobutyric acid in mice lacking the 67-kDa isoform of glutamic acid decarboxylase. Proc Natl Acad Sci U S A. 1997;94:6496–6499. doi: 10.1073/pnas.94.12.6496. [DOI] [PMC free article] [PubMed] [Google Scholar]
- 3.Backman CM, Shan L, Zhang Y, Hoffer BJ, Tomac AC. Alterations in prodynorphin, proenkephalin, and GAD67 mRNA levels in the aged human putamen: correlation with Parkinson’s disease. J Neurosci Res. 2007;85:798–804. doi: 10.1002/jnr.21164. [DOI] [PubMed] [Google Scholar]
- 4.Benes FM, Berretta S. GABAergic interneurons: implications for understanding schizophrenia and bipolar disorder. Neuropsychopharmacology. 2001;25:1–27. doi: 10.1016/S0893-133X(01)00225-1. [DOI] [PubMed] [Google Scholar]
- 5.Berger B, Trottier S, Verney C, Gaspar P, Alvarez C. Regional and laminar distribution of the dopamine and serotonin innervation in the macaque cerebral cortex: a radioautographic study. J Comp Neurol. 1988;273:99–119. doi: 10.1002/cne.902730109. [DOI] [PubMed] [Google Scholar]
- 6.Braak H, Braak E, Yilmazer D, de Vos RA, Jansen EN, Bohl J. Pattern of brain destruction in Parkinson’s and Alzheimer’s diseases. J Neural Transm. 1996;103:455–490. doi: 10.1007/BF01276421. [DOI] [PubMed] [Google Scholar]
- 7.Brooks DJ, Piccini P. Imaging in Parkinson’s disease: the role of monoamines in behavior. Biol Psychiatry. 2006;59:908–918. doi: 10.1016/j.biopsych.2005.12.017. [DOI] [PubMed] [Google Scholar]
- 8.Brown RG, Marsden CD. Cognitive function in Parkinson’s disease: from description to theory. Trends Neurosci. 1990;13:21–29. doi: 10.1016/0166-2236(90)90058-i. [DOI] [PubMed] [Google Scholar]
- 9.Buhmann C, Gorsler A, Baumer T, Hidding U, Demiralay C, Hinkelmann K, Weiller C, Siebner HR, Munchau A. Abnormal excitability of premotor-motor connections in de novo Parkinson’s disease. Brain. 2004;127:2732–2746. doi: 10.1093/brain/awh321. [DOI] [PubMed] [Google Scholar]
- 10.Burianova J, Ouda L, Profant O, Syka J. Age-related changes in GAD levels in the central auditory system of the rat. Exp Gerontol. 2009;44(3):161–9. doi: 10.1016/j.exger.2008.09.012. [DOI] [PubMed] [Google Scholar]
- 11.Campbell MC, Karimi M, Weaver PM, Wu J, Perantie DC, Golchin NA, Tabbal SD, Perlmutter JS, Hershey T. Neural correlates of STN DBS-induced cognitive variability in Parkinson disease. Neuropsychologia. 2008;46:3162–3169. doi: 10.1016/j.neuropsychologia.2008.07.012. [DOI] [PMC free article] [PubMed] [Google Scholar]
- 12.Carbon M, Ghilardi MF, Feigin A, Fukuda M, Silvestri G, Mentis MJ, Ghez C, Moeller JR, Eidelberg D. Learning networks in health and Parkinson’s disease: reproducibility and treatment effects. Hum Brain Mapp. 2003;19:197–211. doi: 10.1002/hbm.10115. [DOI] [PMC free article] [PubMed] [Google Scholar]
- 13.Cools R. Dopaminergic modulation of cognitive function-implications for L-DOPA treatment in Parkinson’s disease. Neurosci Biobehav Rev. 2006;30:1–23. doi: 10.1016/j.neubiorev.2005.03.024. [DOI] [PubMed] [Google Scholar]
- 14.Cox KH, DeLeon DV, Angerer LM, Angerer RC. Detection of mrnas in sea urchin embryos by in situ hybridization using asymmetric RNA probes. Dev Biol. 1984;101:485–502. doi: 10.1016/0012-1606(84)90162-3. [DOI] [PubMed] [Google Scholar]
- 15.Dubois B, Pillon B. Cognitive deficits in Parkinson’s disease. J Neurol. 1997;244:2–8. doi: 10.1007/pl00007725. [DOI] [PubMed] [Google Scholar]
- 16.Erlander MG, Tillakaratne NJ, Feldblum S, Patel N, Tobin AJ. Two genes encode distinct glutamate decarboxylases. Neuron. 1991;7:91–100. doi: 10.1016/0896-6273(91)90077-d. [DOI] [PubMed] [Google Scholar]
- 17.Esclapez M, Tillakaratne NJ, Kaufman DL, Tobin AJ, Houser CR. Comparative localization of two forms of glutamic acid decarboxylase and their mRNAs in rat brain supports the concept of functional differences between the forms. J Neurosci. 1994;14:1834–1855. doi: 10.1523/JNEUROSCI.14-03-01834.1994. [DOI] [PMC free article] [PubMed] [Google Scholar]
- 18.Feldblum S, Erlander MG, Tobin AJ. Different distributions of GAD65 and GAD67 mRNAs suggest that the two glutamate decarboxylases play distinctive functional roles. J Neurosci Res. 1993;34:689–706. doi: 10.1002/jnr.490340612. [DOI] [PubMed] [Google Scholar]
- 19.Ferrer I. Early involvement of the cerebral cortex in Parkinson’s disease: convergence of multiple metabolic defects. Prog Neurobiol. 2009;88:89–103. doi: 10.1016/j.pneurobio.2009.02.004. [DOI] [PubMed] [Google Scholar]
- 20.Fuster JM. Prefrontal neurons in networks of executive memory. Brain Res Bull. 2000;52:331–336. doi: 10.1016/s0361-9230(99)00258-0. [DOI] [PubMed] [Google Scholar]
- 21.Gao WJ, Goldman-Rakic PS. Selective modulation of excitatory and inhibitory microcircuits by dopamine. Proc Natl Acad Sci U S A. 2003;100:2836–2841. doi: 10.1073/pnas.262796399. [DOI] [PMC free article] [PubMed] [Google Scholar]
- 22.Gaspar P, Duyckaerts C, Alvarez C, Javoy-Agid F, Berger B. Alterations of dopaminergic and noradrenergic innervations in motor cortex in Parkinson’s disease. Ann Neurol. 1991;30:365–374. doi: 10.1002/ana.410300308. [DOI] [PubMed] [Google Scholar]
- 23.Gerlach M, Gsell W, Kornhuber J, Jellinger K, Krieger V, Pantucek F, Vock R, Riederer P. A post mortem study on neurochemical markers of dopaminergic, GABA-ergic and glutamatergic neurons in basal ganglia-thalamocortical circuits in Parkinson syndrome. Brain Res. 1996;741:142–152. doi: 10.1016/s0006-8993(96)00915-8. [DOI] [PubMed] [Google Scholar]
- 24.Goldman-Rakic PS. Cellular basis of working memory. Neuron. 1995;14:477–485. doi: 10.1016/0896-6273(95)90304-6. [DOI] [PubMed] [Google Scholar]
- 25.Gorelova N, Seamans JK, Yang CR. Mechanisms of dopamine activation of fast-spiking interneurons that exert inhibition in rat prefrontal cortex. J Neurophysiol. 2002;88:3150–3166. doi: 10.1152/jn.00335.2002. [DOI] [PubMed] [Google Scholar]
- 26.Gundersen HJ, Bagger P, Bendtsen TF, Evans SM, Korbo L, Marcussen N, Moller A, Nielsen K, Nyengaard JR, Pakkenberg B, et al. The new stereological tools: disector, fractionator, nucleator and point sampled intercepts and their use in pathological research and diagnosis. Apmis. 1988;96:857–881. doi: 10.1111/j.1699-0463.1988.tb00954.x. [DOI] [PubMed] [Google Scholar]
- 27.Harrison PJ, Heath PR, Eastwood SL, Burnet PW, McDonald B, Pearson RC. The relative importance of premortem acidosis and postmortem interval for human brain gene expression studies: selective mRNA vulnerability and comparison with their encoded proteins. Neurosci Lett. 1995;200:151–154. doi: 10.1016/0304-3940(95)12102-a. [DOI] [PubMed] [Google Scholar]
- 28.Hendrickson AE, Tillakaratne NJ, Mehra RD, Esclapez M, Erickson A, Vician L, Tobin AJ. Differential localization of two glutamic acid decarboxylases (GAD65 and GAD67) in adult monkey visual cortex. J Comp Neurol. 1994;343:566–581. doi: 10.1002/cne.903430407. [DOI] [PubMed] [Google Scholar]
- 29.Herrero MT, Levy R, Ruberg M, Luquin MR, Villares J, Guillen J, Faucheux B, Javoy-Agid F, Guridi J, Agid Y, Obeso JA, Hirsch EC. Consequence of nigrostriatal denervation and L-dopa therapy on the expression of glutamic acid decarboxylase messenger RNA in the pallidum. Neurology. 1996;47:219–224. doi: 10.1212/wnl.47.1.219. [DOI] [PubMed] [Google Scholar]
- 30.Jellinger KA. A critical reappraisal of current staging of Lewy-related pathology in human brain. Acta Neuropathol. 2008;116:1–16. doi: 10.1007/s00401-008-0406-y. [DOI] [PubMed] [Google Scholar]
- 31.Karlsen KH, Larsen JP, Tandberg E, Maland JG. Quality of life measurements in patients with Parkinson’s disease: A community-based study. Eur J Neurol. 1998;5:443–450. doi: 10.1046/j.1468-1331.1998.550443.x. [DOI] [PubMed] [Google Scholar]
- 32.Kikuchi A, Takeda A, Kimpara T, Nakagawa M, Kawashima R, Sugiura M, Kinomura S, Fukuda H, Chida K, Okita N, Takase S, Itoyama Y. Hypoperfusion in the supplementary motor area, dorsolateral prefrontal cortex and insular cortex in Parkinson’s disease. J Neurol Sci. 2001;193:29–36. doi: 10.1016/s0022-510x(01)00641-4. [DOI] [PubMed] [Google Scholar]
- 33.Kingsbury AE, Foster OJ, Nisbet AP, Cairns N, Bray L, Eve DJ, Lees AJ, Marsden CD. Tissue pH as an indicator of mRNA preservation in human post-mortem brain. Brain Res Mol Brain Res. 1995;28:311–318. doi: 10.1016/0169-328x(94)00219-5. [DOI] [PubMed] [Google Scholar]
- 34.Kingsbury AE, Daniel SE, Sangha H, Eisen S, Lees AJ, Foster OJ. Alteration in alpha-synuclein mRNA expression in Parkinson’s disease. Mov Disord. 2004;19:162–170. doi: 10.1002/mds.10683. [DOI] [PubMed] [Google Scholar]
- 35.Kroner S, Krimer LS, Lewis DA, Barrionuevo G. Dopamine increases inhibition in the monkey dorsolateral prefrontal cortex through cell type-specific modulation of interneurons. Cereb Cortex. 2007;17:1020–1032. doi: 10.1093/cercor/bhl012. [DOI] [PubMed] [Google Scholar]
- 36.Lefaucheur JP. Motor cortex dysfunction revealed by cortical excitability studies in Parkinson’s disease: influence of antiparkinsonian treatment and cortical stimulation. Clin Neurophysiol. 2005;116:244–253. doi: 10.1016/j.clinph.2004.11.017. [DOI] [PubMed] [Google Scholar]
- 37.Levitt P, Rakic P, Goldman-Rakic P. Region-specific distribution of catecholamine afferents in primate cerebral cortex: a fluorescence histochemical analysis. J Comp Neurol. 1984;227:23–36. doi: 10.1002/cne.902270105. [DOI] [PubMed] [Google Scholar]
- 38.Levy R, Herrero MT, Ruberg M, Villares J, Faucheux B, Guridi J, Guillen J, Luquin MR, Javoy-Agid F, Obeso JA, et al. Effects of nigrostriatal denervation and L-dopa therapy on the GABAergic neurons in the striatum in MPTP-treated monkeys and Parkinson’s disease: an in situ hybridization study of GAD67 mRNA. Eur J Neurosci. 1995;7:1199–1209. doi: 10.1111/j.1460-9568.1995.tb01110.x. [DOI] [PubMed] [Google Scholar]
- 39.Lewis DA, Campbell MJ, Foote SL, Goldstein M, Morrison JH. The distribution of tyrosine hydroxylase-immunoreactive fibers in primate neocortex is widespread but regionally specific. J Neurosci. 1987;7:279–290. doi: 10.1523/JNEUROSCI.07-01-00279.1987. [DOI] [PMC free article] [PubMed] [Google Scholar]
- 40.Lewis DA, Foote SL, Goldstein M, Morrison JH. The dopaminergic innervation of monkey prefrontal cortex: a tyrosine hydroxylase immunohistochemical study. Brain Res. 1988;449:225–243. doi: 10.1016/0006-8993(88)91040-2. [DOI] [PubMed] [Google Scholar]
- 41.Lewis DA, Hashimoto T, Volk DW. Cortical inhibitory neurons and schizophrenia. Nat Rev Neurosci. 2005;6:312–324. doi: 10.1038/nrn1648. [DOI] [PubMed] [Google Scholar]
- 42.Lewis SJ, Dove A, Robbins TW, Barker RA, Owen AM. Cognitive impairments in early Parkinson’s disease are accompanied by reductions in activity in frontostriatal neural circuitry. J Neurosci. 2003;23:6351–6356. doi: 10.1523/JNEUROSCI.23-15-06351.2003. [DOI] [PMC free article] [PubMed] [Google Scholar]
- 43.Lisman JE, Coyle JT, Green RW, Javitt DC, Benes FM, Heckers S, Grace AA. Circuit-based framework for understanding neurotransmitter and risk gene interactions in schizophrenia. Trends Neurosci. 2008;31:234–242. doi: 10.1016/j.tins.2008.02.005. [DOI] [PMC free article] [PubMed] [Google Scholar]
- 44.Maniatis T, Frisch EF, Sambrook P. Molecular cloning: a laboratory manual. New York: Cold Spring Harbor Laboratory; 1982. [Google Scholar]
- 45.Martin SB, Waniewski RA, Battaglioli G, Martin DL. Post-mortem degradation of brain glutamate decarboxylase. Neurochem Int. 2003;42:549–554. doi: 10.1016/s0197-0186(02)00189-4. [DOI] [PubMed] [Google Scholar]
- 46.Mexal S, Berger R, Adams CE, Ross RG, Freedman R, Leonard S. Brain pH has a significant impact on human postmortem hippocampal gene expression profiles. Brain Res. 2006;1106:1–11. doi: 10.1016/j.brainres.2006.05.043. [DOI] [PubMed] [Google Scholar]
- 47.Middleton FA, Strick PL. Basal-ganglia ‘projections’ to the prefrontal cortex of the primate. Cereb Cortex. 2002;12:926–935. doi: 10.1093/cercor/12.9.926. [DOI] [PubMed] [Google Scholar]
- 48.Monfort JC, Javoy-Agid F, Hauw JJ, Dubois B, Agid Y. Brain glutamate decarboxylase in Parkinson’s disease with particular reference to a premortem severity index. Brain. 1985;108 (Pt 2):301–313. doi: 10.1093/brain/108.2.301. [DOI] [PubMed] [Google Scholar]
- 49.Mori H. Pathological substrate of dementia in Parkinson’s disease--its relation to DLB and DLBD. Parkinsonism Relat Disord. 2005;11(Suppl 1):S41–45. doi: 10.1016/j.parkreldis.2005.02.012. [DOI] [PubMed] [Google Scholar]
- 50.Mouton PR. Principles And Practices Of Unbiased Stereology: An Introduction For Bioscientists. Baltimore and London: The Johns Hopkins University Press; 2002. [Google Scholar]
- 51.Nakamura T, Ghilardi MF, Mentis M, Dhawan V, Fukuda M, Hacking A, Moeller JR, Ghez C, Eidelberg D. Functional networks in motor sequence learning: abnormal topographies in Parkinson’s disease. Hum Brain Mapp. 2001;12:42–60. doi: 10.1002/1097-0193(200101)12:1<42::AID-HBM40>3.0.CO;2-D. [DOI] [PMC free article] [PubMed] [Google Scholar]
- 52.Nisbet AP, Eve DJ, Kingsbury AE, Daniel SE, Marsden CD, Lees AJ, Foster OJ. Glutamate decarboxylase-67 messenger RNA expression in normal human basal ganglia and in Parkinson’s disease. Neuroscience. 1996;75:389–406. doi: 10.1016/0306-4522(96)00299-0. [DOI] [PubMed] [Google Scholar]
- 53.Nishino N, Fujiwara H, Noguchi-Kuno SA, Tanaka C. GABAA receptor but not muscarinic receptor density was decreased in the brain of patients with Parkinson’s disease. Jpn J Pharmacol. 1988;48:331–339. doi: 10.1254/jjp.48.331. [DOI] [PubMed] [Google Scholar]
- 54.Ouchi Y, Yoshikawa E, Okada H, Futatsubashi M, Sekine Y, Iyo M, Sakamoto M. Alterations in binding site density of dopamine transporter in the striatum, orbitofrontal cortex, and amygdala in early Parkinson’s disease: compartment analysis for beta-CFT binding with positron emission tomography. Ann Neurol. 1999;45:601–610. [PubMed] [Google Scholar]
- 55.Parker WD, Jr, Parks JK, Swerdlow RH. Complex I deficiency in Parkinson’s disease frontal cortex. Brain Res. 2008;1189:215–218. doi: 10.1016/j.brainres.2007.10.061. [DOI] [PMC free article] [PubMed] [Google Scholar]
- 56.Pedersen KM, Marner L, Pakkenberg H, Pakkenberg B. No global loss of neocortical neurons in Parkinson’s disease: a quantitative stereological study. Mov Disord. 2005;20:164–171. doi: 10.1002/mds.20289. [DOI] [PubMed] [Google Scholar]
- 57.Perry EK, Gibson PH, Blessed G, Perry RH, Tomlinson BE. Neurotransmitter enzyme abnormalities in senile dementia. Choline acetyltransferase and glutamic acid decarboxylase activities in necropsy brain tissue. J Neurol Sci. 1977;34:247–265. doi: 10.1016/0022-510x(77)90073-9. [DOI] [PubMed] [Google Scholar]
- 58.Peters A, Sethares C, Luebke JI. Synapses are lost during aging in the primate prefrontal cortex. Neuroscience. 2008;152:970–981. doi: 10.1016/j.neuroscience.2007.07.014. [DOI] [PMC free article] [PubMed] [Google Scholar]
- 59.Petrides M. The role of the mid-dorsolateral prefrontal cortex in working memory. Exp Brain Res. 2000;133:44–54. doi: 10.1007/s002210000399. [DOI] [PubMed] [Google Scholar]
- 60.Piccini P, Pavese N, Brooks DJ. Endogenous dopamine release after pharmacological challenges in Parkinson’s disease. Ann Neurol. 2003;53:647–653. doi: 10.1002/ana.10526. [DOI] [PubMed] [Google Scholar]
- 61.Pierantozzi M, Palmieri MG, Marciani MG, Bernardi G, Giacomini P, Stanzione P. Effect of apomorphine on cortical inhibition in Parkinson’s disease patients: a transcranial magnetic stimulation study. Exp Brain Res. 2001;141:52–62. doi: 10.1007/s002210100839. [DOI] [PubMed] [Google Scholar]
- 62.Rajkowska G, O’Dwyer G, Teleki Z, Stockmeier CA, Miguel-Hidalgo JJ. GABAergic neurons immunoreactive for calcium binding proteins are reduced in the prefrontal cortex in major depression. Neuropsychopharmacology. 2007;32:471–482. doi: 10.1038/sj.npp.1301234. [DOI] [PMC free article] [PubMed] [Google Scholar]
- 63.Ridding MC, Inzelberg R, Rothwell JC. Changes in excitability of motor cortical circuitry in patients with Parkinson’s disease. Ann Neurol. 1995;37:181–188. doi: 10.1002/ana.410370208. [DOI] [PubMed] [Google Scholar]
- 64.Sawamoto N, Piccini P, Hotton G, Pavese N, Thielemans K, Brooks DJ. Cognitive deficits and striato-frontal dopamine release in Parkinson’s disease. Brain. 2008;131:1294–1302. doi: 10.1093/brain/awn054. [DOI] [PubMed] [Google Scholar]
- 65.Schramm M, Falkai P, Tepest R, Schneider-Axmann T, Przkora R, Waha A, Pietsch T, Bonte W, Bayer TA. Stability of RNA transcripts in post-mortem psychiatric brains. J Neural Transm. 1999;106:329–335. doi: 10.1007/s007020050162. [DOI] [PubMed] [Google Scholar]
- 66.Sestini S, Scotto di Luzio A, Ammannati F, De Cristofaro MT, Passeri A, Martini S, Pupi A. Changes in regional cerebral blood flow caused by deep-brain stimulation of the subthalamic nucleus in Parkinson’s disease. J Nucl Med. 2002;43:725–732. [PubMed] [Google Scholar]
- 67.Soghomonian JJ, Pedneault S, Audet G, Parent A. Increased glutamate decarboxylase mRNA levels in the striatum and pallidum of MPTP-treated primates. J Neurosci. 1994;14:6256–6265. doi: 10.1523/JNEUROSCI.14-10-06256.1994. [DOI] [PMC free article] [PubMed] [Google Scholar]
- 68.Soghomonian JJ, Martin DL. Two isoforms of glutamate decarboxylase: why? Trends Pharmacol Sci. 1998;19:500–505. doi: 10.1016/s0165-6147(98)01270-x. [DOI] [PubMed] [Google Scholar]
- 69.Stefurak T, Mikulis D, Mayberg H, Lang AE, Hevenor S, Pahapill P, Saint-Cyr J, Lozano A. Deep brain stimulation for Parkinson’s disease dissociates mood and motor circuits: a functional MRI case study. Mov Disord. 2003;18:1508–1516. doi: 10.1002/mds.10593. [DOI] [PubMed] [Google Scholar]
- 70.Walker E, McNicol AM. In situ hybridization demonstrates the stability of mRNA in post-mortem rat tissues. J Pathol. 1992;168:67–73. doi: 10.1002/path.1711680112. [DOI] [PubMed] [Google Scholar]
- 71.Wichmann T, DeLong MR. Functional and pathophysiological models of the basal ganglia. Curr Opin Neurobiol. 1996;6:751–758. doi: 10.1016/s0959-4388(96)80024-9. [DOI] [PubMed] [Google Scholar]
- 72.Zhou FM, Hablitz JJ. Dopamine modulation of membrane and synaptic properties of interneurons in rat cerebral cortex. J Neurophysiol. 1999;81:967–976. doi: 10.1152/jn.1999.81.3.967. [DOI] [PubMed] [Google Scholar]