Abstract
The ReI(CO)3(4,7-dimethyl-1,10-phenanthroline)(histidine-124)(tryptophan-122) complex, denoted ReI(dmp)(W122), of Pseudomonas aeruginosa azurin behaves as a single photoactive unit that triggers very fast electron transfer (ET) from a distant (2 nm) CuI center in the protein. Analysis of time-resolved (ps-μs) IR spectroscopic and kinetics data collected on ReI(dmp)(W122)AzM (M = ZnII CuII, CuI; Az = azurin) and position-122 tyrosine (Y), phenylalanine (F), and lysine (K) mutants together with excited-state DFT/TDDFT calculations and X-ray structural characterization reveal the character, energetics, and dynamics of the relevant electronic states of the ReI(dmp)(W122) unit and a cascade of photoinduced ET and relaxation steps in the corresponding Re-azurins. Optical population of ReI(imidazole-H124)(CO)3→dmp 1CT states is followed by ~110 fs intersystem crossing and ~600 ps structural relaxation to a 3CT state whose IR spectrum indicates a mixed ReI(CO)3,A→dmp/π→π*(dmp) character for aromatic amino acids A122 (A = W, Y, F) and ReI(CO)3→dmp MLCT for ReI(dmp)(K122)AzCuII. In a few ns, the 3CT state of ReI(dmp)(W122)AzM establishes an equilibrium with the ReI(dmp•−)(W122•+)AzM charge-separated state, 3CS, whereas the 3CT state of the other Y, F, and K122 proteins decays to the ground state. In addition to this main pathway, 3CS is populated by fs and ps W(indole)→ReII ET from 1CT and the initially “hot” 3CT states, respectively. The 3CS state undergoes a tens-of-ns dmp•−→W122•+ ET recombination leading to the ground state or, in the case of the CuI azurin, competitively fast (~30 ns over 1.12 nm) CuI→W•+ ET producing ReI(dmp•−)(W122)AzCuII. The overall photoinduced CuI→Re(dmp) ET through ReI(dmp)(W122)AzCuI occurs over a 2 nm distance in <50 ns after excitation, the intervening fast 3CT-3CS equilibrium being the principal accelerating factor. No reaction was observed for the three Y, F, and K122 analogues. Although the presence of Re(dmp)(W122)AzCuII oligomers in solution was documented by mass spectrometry and phosphorescence anisotropy, kinetics data do not indicate any significant interference from intermolecular ET steps. The ground-state dmp-indole ππ interaction together with well-matched W/W•+ and excited-state ReII(CO)3(dmp•−)/ReI(CO)3(dmp•−) potentials, that result in very rapid electron interchange and 3CT - 3CS energetic proximity, are the main factors responsible for the unique ET behavior of ReI(dmp)(W122)-containing azurins.
Introduction
Kinetics studies of long-range ET through metallolabeled mutants of a blue copper protein Pseudomonas aeruginosa azurin have greatly advanced our understanding of electron tunneling pathways through peptide β-strands[1-5] as well as at protein interfaces.[6] Theoretical analysis has revealed the roles of molecular fluctuations and multiple interfering tunneling pathways in tuning intraprotein ET rates in Ru-azurins.[7, 8]
Whereas oxidation of the azurin CuI center by electronically excited or oxidized metallolabels usually occurs on a μs-ms timescale,[1, 2] dramatic ET acceleration into the tens-of-ns range has been observed[9] in an azurin mutant where a tryptophan (W122) is placed next to a ReI(CO)3(dmp) label bound to the imidazole group of H124. (This Re-modified protein is denoted Re(dmp)(W)AzCuI (dmp = 4,7-dimethyl-phenanthroline).)[10]-FOOTNOTE A sequential tunneling mechanism was proposed (Scheme 1), whereby the 3CT-excited Re label is first reduced by the W122 indole group, followed by a CuI→W•+ ET, effectively splitting the ~2 nm ET pathway into two shorter steps.[9] The reaction mechanism involves several relaxation and ET events occurring on a timescales ranging from femto- to nanoseconds.
Scheme 1.
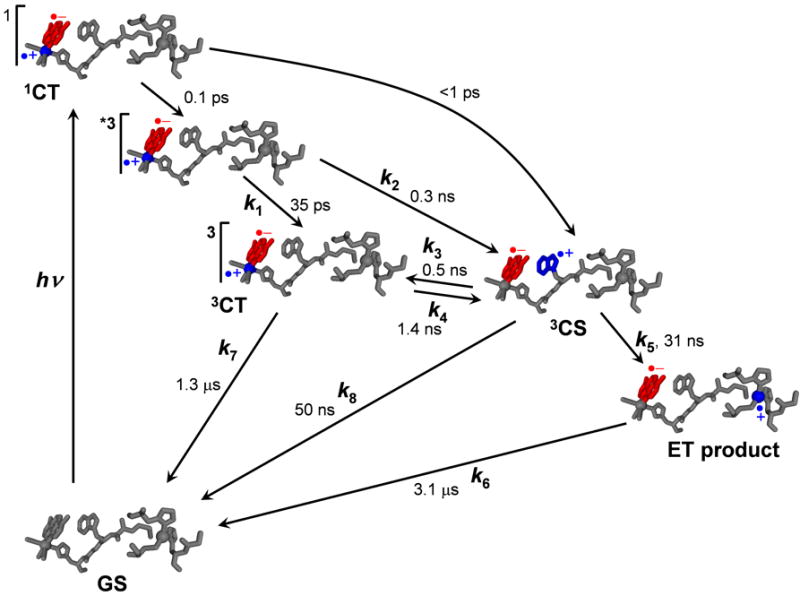
Photoinduced electron transfer through ReI(dmp)(W)AzCuI. Optical population of several 1CT excited states is followed by a series of relaxation and ET steps. The sites of the excited electron and hole are shown in red and blue, respectively. Lifetime values[9] are pertinent to ReI(dmp)(W)AzCuI.
This work has raised important questions about the roles of the ReI(CO)3(dmp)/W122 unit and its electronic excited states in the ET mechanism. By replacing the CuI center with CuII or ZnII, we cut out the long-range charge separation across the Re-labeled azurin (i.e. the 31 ns step in Scheme 1), isolate the reactive ReI(dmp)(W) unit, and focus on the kinetics and mechanism of the primary ET step from W to the excited Re chromophore. Detailed structural, kinetics, and spectroscopic studies of ReI(dmp)(W)AzM (M = ZnII, CuII, and CuI) using ps-ns time-resolved IR and emission spectroscopy, combined with a theoretical (TD-DFT) excited-state analysis, provide a comprehensive picture of ReI(dmp)(W) photobehavior and single out factors that make this unit a unique ultrafast ET phototrigger. It emerges that the ET-accelerating role of the tryptophan intermediate goes well beyond the simple splitting of the ET path, with interesting implications for long-range hopping in biological systems as well as for the design of new molecular schemes for photoinduced charge separation.
Experimental
Materials
ReI(dmp)(A)AzCuII (A = W, Y, F) were prepared and handled as described previously[9, 11] and in the Supplementary Information. The ReI(dmp)(A)AzZnII samples were made from the corresponding apoprotein by ZnII addition. TRIR experiments were performed in 50 mM Na/KPi buffer in D2O (pD ≅ 7.2) at 21 °C. Emission experiments were performed in H2O, 50 mM NaPi (pH ≅7.1) at 21 °C. Reduction to ReI(dmp)(A)AzCuI was accomplished by slow additions of a concentrated solution of sodium dithionite (Aldrich) in 0.5-1.0 μL steps into an azurin solution under nitrogen atmosphere until it turned colorless. TRIR experiments were thus performed in the presence of a small excess of dithionite. The crystallographic structure determination of ReI(dmp)W122AzCuII was reported previously,[9] and the coordinates are deposited in the protein data band with id 2i7o.
Time-resolved infrared (TRIR) and luminescence spectroscopy
TRIR measurements and procedures have been described in detail.[12, 13] In short, for ps experiments (0 – 2 ns), the sample solution was excited at 400 nm, using frequency-doubled pulses from a Ti:sapphire laser of ~150 fs duration (FWHM) and ca. 3 μJ energy, focused at an area ~200 μm in diameter. TRIR spectra were probed with IR (~150 fs) pulses obtained by difference-frequency generation. The IR probe pulses cover a 150-200 cm-1 spectral range. For ns-μs measurements, the sample was pumped with 355 nm, 0.7 ns FWHM, and probed with electronically synchronized 150 fs IR pulses.[14] The sample solutions were placed in a round dip ca. 0.75 mm deep, drilled into a CaF2 plate and tightly covered with a polished CaF2 window. The cell was scanned-rastered across the area of the dip in two dimensions to prevent laser heating and decomposition of the sample. FTIR spectra measured before and after the experiment demonstrated sample stability.
Emission lifetime and time-resolved anisotropy measurements were performed using time-correlated single-photon counting (TCSPC) on an IBH 5000 U instrument equipped with a cooled Hamamatsu R3809U-50 microchannel plate photomultiplier, following the procedures described previously.[15] The samples were excited at 370 nm with an IBH NanoLED-11 diode laser (FWHM 100 ps, 500 kHz repetition rate).
TRIR data analysis
TRIR data were analyzed using singular value decomposition (SVD) followed by fitting to a multiexponential kinetics equation[16, 17] implemented (EPFL, Switzerland) in the WaveMetrics IGOR Pro software tool. In brief, this analysis allows us to separate the stochastic noise from the signal ΔA(ν̃, t) and express the latter in terms of P spectral εl(ν̃) and temporal cl(t) components:
| (1) |
Where ΔA(ν̃, t) is the IR difference absorbance measured at time delay t and wavenumber ν̃. The cl(t) components are then fitted simultaneously to the appropriate kinetics equation. Herein we used a multiexponential kinetics model, eq. 2.
| (2) |
where a common set of lifetimes (τk) describes the dynamic behavior of all the temporal components. This allows us to rewrite eq. 2 as follows:
| (3) |
where DASk(ν̃) is the Decay Associated Spectrum describing the spectral contribution of the respective decay component with a time constant τk. The last term describes convolution with the Gaussian instrument response function. ΔIRF = 1 ps (or 1 ns) was used for ps (or ns) experiments. Elementary rate constants were extracted from an analytical solution of the differential equations describing the kinetics model depicted in Scheme 1.[9]
Electronic structure calculations
The electronic structure of the model fragment [ReI(CO)3(phen)(W)]+ (Figure 1 bottom) was calculated by density functional theory (DFT) methods using the Gaussian 09 program package,[18] employing the hybrid functionals PBE0[19, 20], M06[21] and long-range corrected CAM-B3LYP[22]. For H, C, N, O atoms, 6-31g* polarized triple - ζ basis sets[23] were used for geometry optimization and vibrational analysis and cc-pvdz correlation consistent polarized valence double-ζ basis sets[24] were utilized in TDDFT calculations. Quasirelativistic effective core pseudopotentials and a corresponding optimized set of basis functions were employed for Re.[25] The solvent was described by a conductor-like polarizable continuum model (CPCM).[26] Electronic transitions were calculated by the time-dependent DFT (TDDFT) method at the ground-state geometry optimized with solvent correction. The structure of the lowest triplet excited state a3A was optimized by UKS calculations. The triplet excited state calculation is in satisfactory agreement with experimental TRIR spectra in the ν(CO) region. The electron density difference plots were drawn using the GaussView program. [ReI(CO)3(phen)(W)]+ was chosen as a computational model instead of [ReI(CO)3(dmp)(W)]+ because of a better convergence of UKS optimizations of some of the excited-state structures. Ground-state PBE0 calculations of [ReI(CO)3(dmp)(W)]+ and [ReI(CO)3(phen)(W)]+ yield very similar structural parameters (Table S1) as well as excitation energies (Table S2a-b), closely matching the experimental values.
Figure 1.
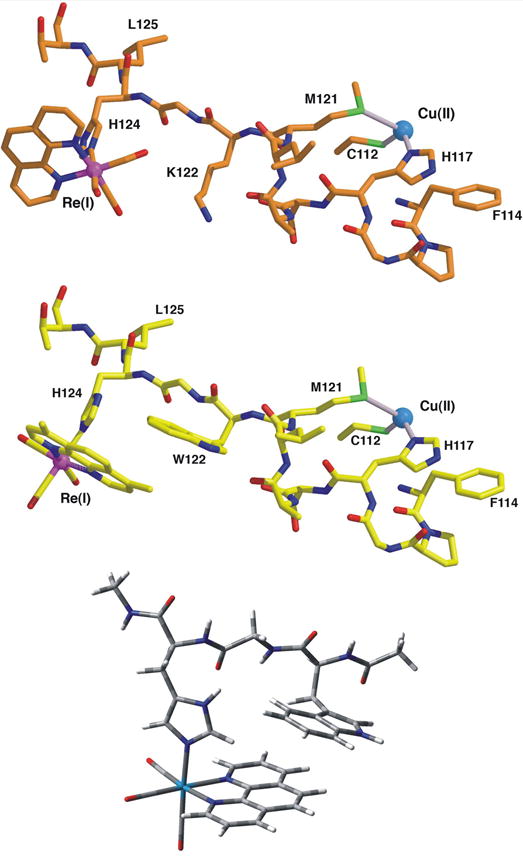
Fragments of the ReI(phen)(K)AzCuII (top) and ReI(dmp)(W)AzCuII (middle) crystal structures showing the Re(CO)3(N,N) label attached to the imidazole group of H124 and the peptide link to the Cu atom.[9, 15] Bottom: Optimized structure of the [ReI(phen)(W)]+ unit used in DFT and TDDFT calculations.
Results
Crystal structures
The crystal structure of ReI(dmp)(W)AzCuII (Figure 1) shows the Re and Cu atoms 19.4 Å apart. W122 lies between them, 11.2 Å from Cu and 8.9 Å from Re, as measured to the indole Cγ atom. The dmp and W122 aromatic rings slightly overlap, with one dmp methyl group projecting directly over the indole ring; the planes of the respective π-systems making a 20.9° angle. The average separation of atoms on the overlapped six-membered rings is 3.82 Å, whereas the W122 indole and the H124 imidazole edges are separated by 4.1 Å. Comparison of the structures of ReI(dmp)(W)AzCuII and ReI(phen)(K)AzCuII in Figure 1 shows that the orientations of the Re(CO)2(N,N) units (N,N = dmp, phen) relative to the peptide chain and the im(H124) ligand differ by close to 90°. The H124 imidazole ring and the equatorial Re(CO)2(dmp) plane in ReI(dmp)(W)AzCuII adopt an unusual orientation, whereby the imidazole plane lies close (16°) to the symmetry plane of the equatorial Re(CO)2(dmp) moiety, bisecting the plane of the dmp ligand (Figures 1, 2). In contrast, the plane of the axial ligand is oriented perpendicularly to the symmetry plane, bisecting the equatorial OC-Re-N angles in ReI(phen)(K)AzCuII (Figure 1 top), other structurally characterized Re-azurins[2, 15, 27] except ReI(phen)(H83)AzCuII, the small-molecule analogue[28] [ReI(im)(CO)3(phen)]+, and various complexes [ReI(R-py)(CO)3(N,N)]+ (N,N = phen, bpy).[29-33]
Figure 2.
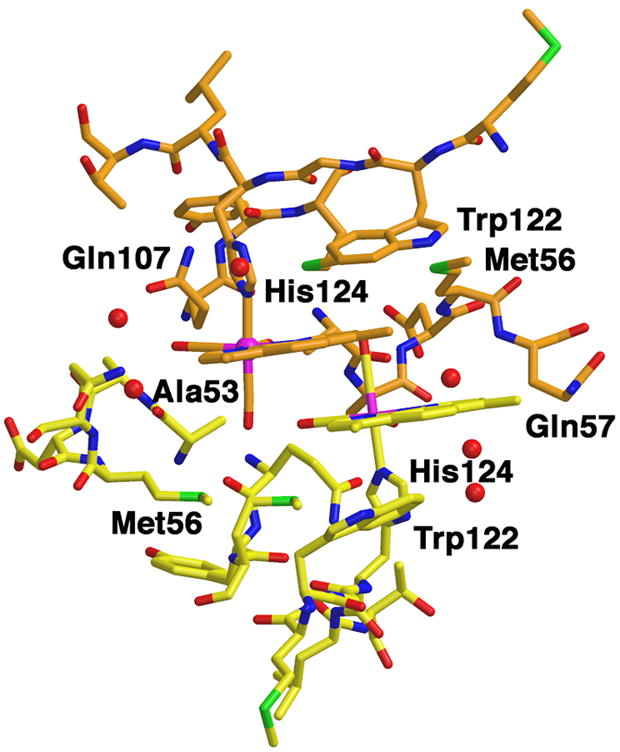
Structure of ReI(dmp)(W)AzCuII in the metallolabel region.
The red spheres represent water molecules.
Figure 2 shows that ReI(dmp)(W)AzCuII is a dimer with two-fold symmetry in the crystal; the dominant interactions between neighboring molecules involve the dmp ligands, which cover each other on their outside faces. Unlike the hooking interactions that interdigitate the phen moieties in ReI(dmp)(H107)AzCuII (PDB code 1i53)[11, 15, 34] and ReI(phen)(K)AzCuII (PDB code 2i7s) [15] crystals, the ReI(dmp)(W)AzCuII dmp ligands are not constrained by the axial H124 and thus can align to a greater extent. One six-membered dmp ring directly stacks with one from a neighboring complex. A 4-centered weakly interacting W122⋯dmp⋯dmp⋯W122 stack is apparent in the dimer structure. The Re(CO)3 unit makes van der Waals contacts with the peptide chains: one equatorial carbonyl ligand abuts the methyl side chain of Ala53, whereas the other is within 3.6 Å of the Gln107 side chain. The axial carbonyl points towards an adjacent molecule in the lattice and is within 4.0 Å of the sulfur atoms of both Met109 and Met56 side chains. The axial carbonyl would point away from the protein surface in a solvated monomer in solution.
Solution structure
Solution IR spectra in the region of CO stretching vibrations, ν(CO) (Figure 3), show the same pattern for all three ReI(dmp)(A)AzMII: a sharp band due to the in-phase A’(1) vibration at 2028 cm-1; and a broad band at ca. 1917 cm-1 that corresponds to quasidegenerate out-of-phase A’(2) and equatorial asymmetric A” vibrations. In the IR spectrum of ReI(phen)(K)AzCuII, the A’(2) and A” bands are split: 1907 and 1924 cm-1, respectively. (Symmetry labels assume Cs local symmetry; the assignment is based on previous work[35, 36] and DFT calculations reported below.) We conclude from the IR spectra that all the Re(dmp)(A)AzMII proteins containing a 122 aromatic amino acid have the same Re-site solution structure, different from ReI(phen)(K)AzCuII. The A’(2)+A” bandshapes indicate that the three CO ligands reside in a much more diverse environment in ReI(phen)(K)AzCuII than ReI(dmp)(A)AzMII. Accordingly, the crystal structures show large asymmetry between the two equatorial COs in ReI(phen)(K)AzCuII, where one equatorial CO is directed at Lys122 and Gln107 and the other is solvated, unlike ReI(dmp)(W)AzCuII, where both equatorial COs point against an aliphatic side chain of the same molecule.
Figure 3.
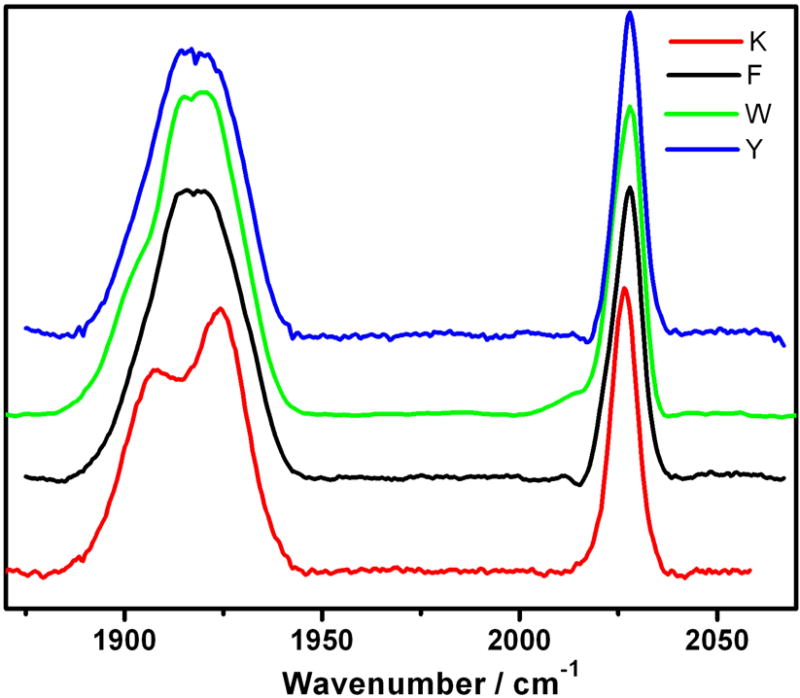
Ground-state FTIR spectra of ReI(dmp)(A)AzCuII (A = W, F), ReI(dmp)(Y)AzZnII (Y) and ReI(phen)(K)AzCuII (K) in a KPi (D2O, pD ~ 7.1) buffer.
Mass spectra (LILBID-MS) obtained from aqueous (20 mM NaPi, pH ~7.0) solutions of ReI(dmp)(W)AzCuII clearly show the presence of higher azurin oligomers, especially at higher concentrations, 1-3 mM.[37] Oligomers also are indicated by relatively high values of protein rotation times T2 that were determined from the biexponential emission anisotropy decay of ReI(dmp)(W)AzCuII in 20 mM NaPi, pH ~7.1 (3.7 mM: T1 = 5.1±4.3 ns (18%), T2 = 31.5 (82%); 0.37 mM: T1 = 5.1±3.4 ns (36%), T2 = 16.5±3.5 ns (64%)) and ReI(dmp)(Y)AzZnII in 50 mM Na/KPi, D2O, pD ~7.1 (4.4 mM: T1 = 4.8±0.7 ns (32%), T2 = 50±2 ns (68%); 0.44 mM: T1 ≅ 1 ns, T2 = 30±1 ns (45%)). At the same time, the relatively large T1 values are attributable to slower Re(dmp)-chromophore motions relative to the peptide than those in Re-azurins that do not contain an aromatic amino acid next to the Re label.[15]
Photoinduced electron transfer: TRIR spectra and emission decay
TRIR spectroscopy is a technique-of-choice to study excited-state behavior of metal carbonyls since the CO stretching vibrations sensitively respond to changes in electronic and molecular structure[38] as well as to relaxation dynamics of the molecular environment following photoexcitation.[15] The IR spectra were measured at selected ps time delays after 400 nm excitation directed to the low-energy part of the Re(CO)3→dmp MLCT absorption band, Figure S2-bottom. By exciting into the red part of band we have avoided additional vibrational excitation. Excitation at 355 nm close to the MLCT band maximum was used (for instrumental reason) in nanosecond experiments. Spectra measured at 355 and 400 nm overlapped in the 1-2 ns time range where either instrumental setup can be used, excluding any specific excitation-wavelength effects on the nature of the populated excited states and their reactivity.
For ReI(dmp)(Y)AzZnII, ReI(dmp)(Y)AzCuII, and ReI(dmp)(F)AzCuII, TRIR spectra show only the negative bleach bands due to ground-state depletion and three upshifted bands attributable[15, 27, 35, 38-43] to a Re(CO)3→dmp 3CT state, approximately described as ReII(dmp•−)(A)AzM (Figures 4 and S1). The excited-state IR features undergo a small ps-ns upshift due to relaxation processes (Figure S1).[15] On a longer timescale, the transient and bleach bands decay with virtually identical kinetics (Figure S1), demonstrating that the 3CT state decays directly to the ground state. A 3CT lifetime of 1.36±0.17 μs determined (TRIR) for ReI(dmp)(Y)AzZnII is close to the ReI(dmp)(F)AzCuI emission lifetime of 1.3 μs.[9] ReI(dmp)(F)AzCuII (1 mM in H2O, 50 mM NaPi pH ≅ 7.1) shows triexponential emission decay with lifetimes of 3.5±0.3 (12%), 76.0±2.6 (32%), and 344±10 ns (55%). The longest decay component corresponds to the 3CT population decay, whereas structural relaxation dynamics and/or oligomerization could account for the shorter kinetics components. The shorter excited-state lifetime in CuII (as compared to ZnII) azurins is attributed to 3CT→CuII energy transfer,[44-46] as dmp•−→CuII ET is excluded by the absence of TRIR signals that would accompany the production of ReII(CO)3(dmp). (Oxidation of excited Re-label (E’ ≅ −0.9 V)[28] by CuII in azurin (+0.31 V) is thermodynamically possible but presumably slow because of long distance and large reorganization energy on the Re side.)
Figure 4.
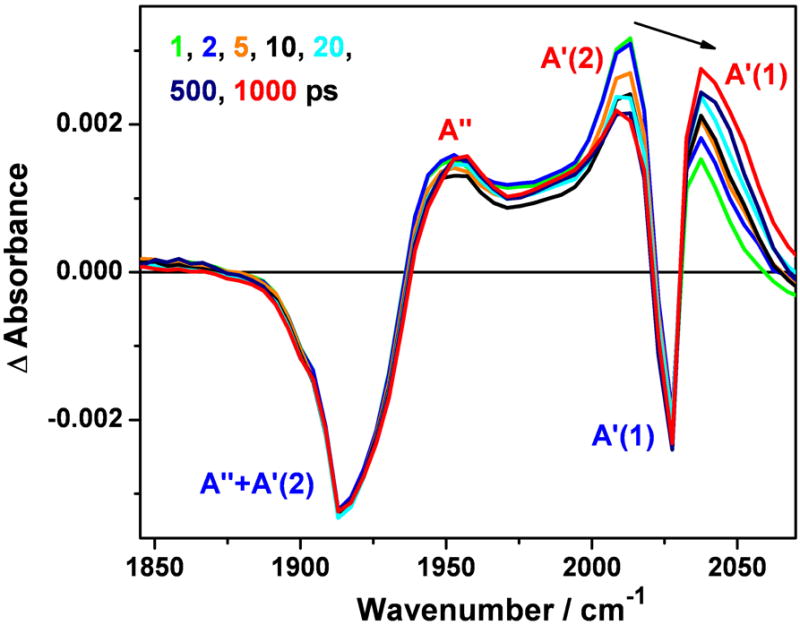
Picosecond TRIR spectra of ReI(dmp)(Y)AzZnII measured at selected time delays after 400 nm, ~150 fs excitation. Positive and negative bands correspond to excited-state and bleached ground-state absorptions, respectively. The experimental points are separated by 4-5 cm-1. The black arrow shows the dynamical evolution of the excited-state A’(1) band shifting with time from about ~2014 to ~2039 cm-1. The ground-state band occurs at 2029 cm-1. Virtually identical TRIR spectra were obtained for 1.9 mM solutions of ReI(dmp)(Y)AzCuII and ReI(dmp)(F)AzCuII in 50 mM KPi buffer in D2O (pD ~7.0) at 21 °C. See Figure S1 for the ns TRIR.
TRIR spectra (Figure 5) of ReI(dmp)(W)AzM (M = ZnII, CuII, CuI) exhibit the typical three upshifted bands due to the 3CT state, together with a broad band at ~1885 cm-1 and a sharp band at ~2004 cm-1 that are assigned to the A”+A’(2) and A’(1) vibrations, respectively, of the W(indole)→Re(CO)3(dmp) 3CS state, ReI(dmp•−)(W•+)AzM. (Hereinafter, these sets of IR bands will be abbreviated 3CT and 3CS bands, respectively.) The 3CS band assignment is based on the similarity with IR spectra of [ReI(N-L)(CO)3(bpy•−/phen•−)] (N-L = nitrogen-donor ligand such as MeCN, picoline or pyridine) generated either electrochemically[47-49] or photochemically[38, 48, 50, 51] by intramolecular electron transfer. Whereas the spectral pattern consisting of 3CT and 3CS bands is very similar for all three ReI(dmp)(W)AzM (M = ZnII, CuII, CuI) derivatives, the kinetics and 3CS yields depend on M. Temporal evolution of TRIR spectra of the individual ReI(dmp)(W)AzM systems in ps and ns-μs time ranges are described in terms of exponential lifetimes and their corresponding decay associated spectra (DAS), eq. 3, obtained by SVD analysis/global fitting. Comparable kinetics data were obtained on different samples of each azurin using variations of the fitting procedure. For M = CuII and CuI, the results obtained on 3-4 and 1.7 mM samples are the same within experimental accuracy. The resultant TRIR and emission lifetime data are summarized in Table 1.
Figure 5.
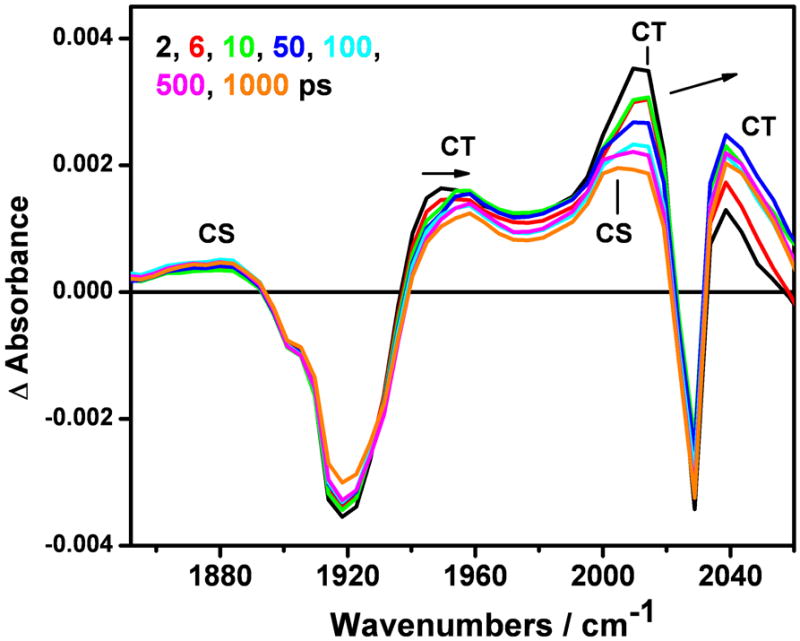
Picosecond TRIR spectra of ReI(dmp)(W)AzZnII measured at selected time delays (in ps) after 400 nm, ~150 fs excitation. Experimental points are separated by 4-5 cm−1. The arrows show the relaxation-related 3CT band shifts (the small 3CS rise is apparent only after background subtraction). Solution in 50 mM KPi buffer in D2O (pD ~7.0) at 21 °C.
Table 1.
Exponential time constants of TRIR spectral evolution and emission decay of Re(dmp)(W)AzM. Kinetics data obtained from solutions in 50 mM KPi buffer in D2O (pD ~7.0) at 21 °C.
| Re(dmp)(W)AzM | M = ZnII | M = CuII | M = CuII emissionc | M = CuI Alternative TRIR | M = CuI emissione |
|---|---|---|---|---|---|
| ultrafast CS rise / CT decay | <1 ps | <1 ps | <1ps | ||
|
| |||||
| relaxationa | - | 4-5 ps | 3-4 ps | ||
|
| |||||
| CS rise / CT decay relaxation | ≤50 ps | 100-270 ps | 2.9±0.1 nsd | 40-100 ps | 350 ps |
|
| |||||
| CS rise / CT decay | - | 4-8 ns | 19±1 ns | 1.6 ns | |
|
| |||||
| CS rise / CT decay | - | - | - | 8±1.6 ns | |
|
| |||||
| CS rise / CT decay | - | - | - | 27±7 ns | 25 ns |
|
| |||||
| CS + CT decay | 18±4 ns | 40-60 ns | 63±1 ns | - | |
| 157±7 nsa | |||||
|
| |||||
| CS decay | 1.0-1.5 μsb | 330±172 ns | |||
| 3.6±0.3 μs | |||||
Additional very weak 3CT signal is present, decaing with τ of 1.3 μs.
Very weak residual signal.
1.9 mM solution in H2O, 50 mM NaPi (pH ≅7.1).
Likely due to dynamic Stokes shift.
From ref. 9.
ReI(dmp)(W)AzZnII
The IR bands of the 3CT state are fully developed within the experimental time resolution of ~1 ps, undergoing relaxation-related dynamic upshifts in the first ~1.5 ns, (Figure 5). The 3CS band at ~1885 cm-1 is also apparent at 1-2 ps, increasing in intensity by ~60% during the first 30-50 ps.
In the ns range, formation of both 3CT and 3CS transients appears to be complete within the 0.7 ns excitation pulse, followed by biexponential decay with low-amplitude 18 ns and principal 157 ns kinetics components, the former involving some 1885 cm-1 band-shape changes (Figure 6). A very small 3CT population persists on a longer timescale, after the 3CS bands had disappeared (see the 500 and 1000 ns experimental traces and the 1300 ns DAS that copies the 3CT spectrum, Figure 6).
Figure 6.
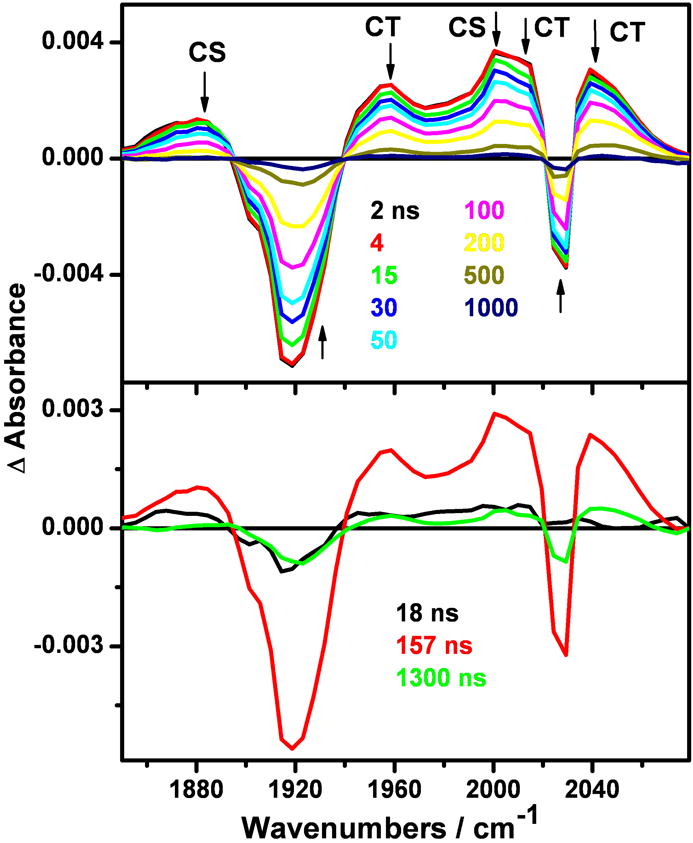
Top: Nanosecond TRIR spectra of 4.4 mM ReI(dmp)(W)AzZnII measured at selected time delays (in ns) after 355 nm, ~0.7 ns excitation. Experimental points are separated by 4-5 cm-1. Bottom: DAS obtained by SVD/global fitting. The 1300 ns lifetime was fixed in the analysis, based on ReI(dmp)(Y)AzZnII emission decay. The spectra evolve in the direction of the arrows. Solution in 50 mM KPi buffer in D2O (pD ~7.0) at 21 °C.
ReI(dmp)(W)AzCuII
Picosecond TRIR spectra (Figure 7, left panel) show both the 3CT and 3CS states being formed within the first ps after excitation. The temporal evolution on the ps timescale consists of band shifts, width narrowing and intensity variations that make it hard to distinguish population changes from relaxation effects. To address this matter, we have performed separate SVD/global fitting analyses in the full spectral range where the relaxation strongly manifests itself by spectral shifts above ~1980 cm−1, and in the 1843-1972 cm−1 range, where population changes prevail. These analyses have identified 4-5 ps and ~110 ps upshifts of the 3CT A” and A’(1) bands. The latter component slows to 220-300 ps when fitted over the whole spectral range. The negative DAS in the region of the 3CS 1885 cm-1 band and at ~2004 cm−1, together with the relatively large positive DAS amplitudes corresponding to hot 3CT bands indicate that ps relaxation processes are accompanied by conversion of the 3CT state to 3CS, whose IR features become more pronounced in the 100-300 ps range. On the nanosecond scale (Figure 7, right panel), there is a major 4-8 ns 3CS rise / 3CT decay followed by a common 40-60 ns decay of both 3CS and 3CT states. Whereas 3CT bands decay completely, a weak long-lived (1000-1500 ns) 3CS signal persists. In addition to intensity changes, the ~1885 cm-1 3CS band undergoes a small upshift to ~1992 cm-1 that is complete in 150-200 ns.
Figure 7.
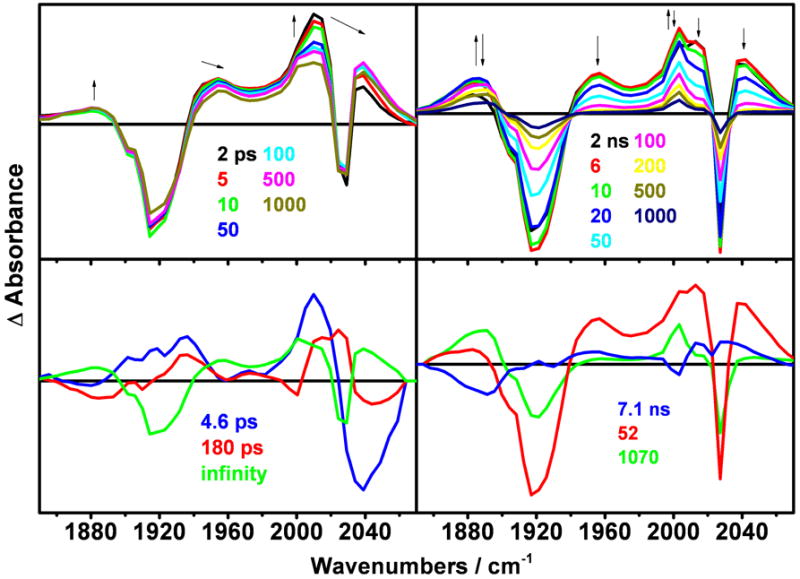
Top: TRIR spectra of ReI(dmp)(W)AzCuII measured in the ps time range after 400 nm, ~150 fs excitation (left panel) and the ns range after 355 nm, ~0.7 ns excitation (right panel). The spectra evolve in the direction of the arrows. Bottom: DAS spectra corresponding to kinetics components of 4.6±1.1, and 180±90 ps (left panel); 7.1±1, 52.3±6.5, and 1069±142 ns (right panel). The “infinity” DAS results from extrapolation of the ps measurement to long time delays, approximately corresponding to an early-ns spectrum. Solution in 50 mM KPi buffer in D2O (pD ~7.0) at 21 °C.
Re(dmp)(W)AzCuI
TRIR spectra (Figure 8) show qualitatively the same pattern as that of the CuII species, albeit with much stronger 3CS bands. The 3CT state and part of the 3CS population are formed within the 1 ps experimental resolution. Further picosecond spectral time evolution consists of a 3-4 ps upshift of the 3CT bands, followed by a 40-100 ps 3CT upshift and small decay, combined with a 3CS rise. On the nanosecond scale, the 3CS rise and 3CT decay continue with time constants of 1.6 ns (determined from the ps experiment), 8 ns (major) and 27 ns (minor). The latter is manifested by a rise mostly of the high-energy side of the 1885 cm-1 band and a 3CT decay. The 27 ns process leaves only the 3CS product that decays with minor 330 ns and major 3.6 μs kinetics components. As in the case of the CuII species, there is a small upshift and shape-change of the 1885 cm-1 3CS band after 150-200 ns.
Figure 8.
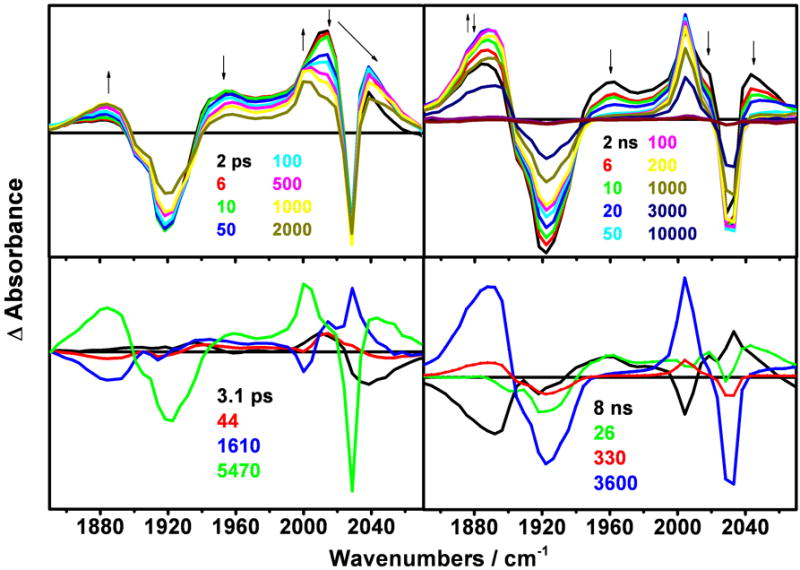
Top: TRIR spectra of ReI(dmp)(W)AzCuI measured in the ps time range after 400 nm, ~150 fs excitation (left panel) and the ns range after 355 nm, ~0.7 ns excitation (right panel). Bottom: DAS spectra corresponding to kinetics components specified in Table 1. The 5470 ps DAS (bottom left, green) results from extrapolation to long time delays, approximately corresponding to an early-ns spectrum.
TRIR spectra also were measured from solutions of Re(dmp)(Y)AzZnII, Re(dmp)(Y)AzCuII and Re(dmp)(F)AzCuII in the presence of a large excess of Na2S2O4. TRIR bands of ReI(dmp•−)(Y)AzM (M = ZnII, CuI) are formed at ~1885 and 2004 cm-1 with lifetimes of hundreds-of-ns. The absence of such long rise kinetics in TRIR measurements on Re(dmp)(W)AzCuI excludes any possible contamination from 3CT quenching by sodium dithionite in solution.
Electron transfer kinetics and mechanism
The spectroscopic and kinetics data for ReI(dmp)(W)AzM are consistent with the mechanism[9] outlined in Scheme 1 for ReI(dmp)(W)AzCuI. The long-range ET is shut out in the case of M = ZnII, CuII (k5 = k6 = 0), restricting the ET activity to the ReI(dmp)(W) moiety. The kinetics data (Table 1) were analyzed using the model[9] shown in Scheme I, revealing the time ranges of individual reaction steps and estimating values of the 3CT-3CS equilibrium constant K.
ReI(dmp)(W)AzZnII
The 3CS state is produced in <1 and <50 ps (Figures 5, S1). No 3CT / 3CS equilibration is seen on the ns timescale, indicating that 3CS formation occurs only from 1CT and unequilibrated 3CT states. By deconvoluting the 3CT and 3CS spectra and comparing their ratio with ReI(dmp)(W)AzCuII, K was estimated as 0.34. The major 157 ns decay component corresponds to the 3CS decay that is in a fast equilibrium with the long-lived (1.36 μs) 3CT state. The minor 18 ns component probably reflects conformational changes in the 3CS state since the corresponding DAS indicates shape changes of the ~1885 cm-1 band.
ReI(dmp)(W)AzCuII
Using the time constants from Figure 7, we estimate K as 1.6. The 4-8 ns lifetime (Table 1) reflects 3CT / 3CS equilibration, k3+k4. 3CS decays (together with 3CT) with a ~60 ns lifetime that is related to k8. The small residual 3CS signal (apparent in Figure 7, the 1000 ns spectrum and the 1070 ns DAS) that decays with a 1-1.5 μs lifetime is tentatively attributed to the deprotonated species ReI(dmp•−)(W•)AzCuII produced by a slow side reaction from the 3CS state ReI(dmp•−)(W•+)AzCuII. W•+ deprotonation is expected to occur with a time constant of 100-200 ns.[52] Consistent with this expectation, the ~1885 cm-1 3CS band reshapes and shifts to ~1990 cm-1 between 50 and 150 ns.
ReI(dmp)(W)AzCuI
Empirical rate constants determined herein by SVD/global fitting (Table 1) of the TRIR data generally agree with the results of our previous analysis (Scheme I).[9] The IR spectra of the 3CS state and the ET product are very similar, belonging to the same chromophore, ReI(CO)3(dmp•−), albeit in a different protein environment. The main 1.6 ns kinetics component corresponds to 3CT/3CS equilibration k3+k4 (K ≅ 3)[9] whereas the 8-9 ns lifetime probably belongs to the same process in a less reactive conformer or an oligomer. The ~27 ns kinetics component is related to CuII→W•+ ET in the 3CS state (k5), since the corresponding DAS indicates reshaping of both 3CS bands. The ca. 330 ns lifetime could be related to structural changes of the ReI(dmp•−)(W)AzCuII product. The ground state is regenerated by 3.1-3.6 μs dmp•−→CuII ET (k6) that is exergonic by ca. 1.8 eV
Re-label excited-state character and dynamics: TRIR spectra
The Re-chromophore in ReI(dmp)(A)AzM shows the typical 3CT broad emission band peaking at 540-550 nm and three excited-state ν(CO) IR bands that are shifted to higher wavenumbers relative to the ground-state bands (Figures 4-8 and S1). The A” and A’(2) bands become well separated upon excitation, shifted from their common ground-state value of 1917 cm-1 to ca. 1960 and 2014 cm-1, respectively, as observed for other ReI-azurins and ReI carbonyl-diimine complexes.[15, 27, 35, 38-43] The A’(1) bands of Re(phen)(K)AzCuII and Re(dmp)(K)AzCuII shift by +38.5 and ~25 cm-1, respectively, on going from the ground state to the relaxed 3CT excited state, indicating a smaller degree of Re(CO)3→N,N charge separation for N,N = dmp. Further differences concern the dynamical behavior of the A’(1) band after excitation (Figure 9). For ReI(phen)(K)AzCuII, A’(1) undergoes an “instantaneous” (i.e. <1 ps) shift of +9.4 cm-1, followed by a triexponential dynamical upshift with time constants of 2, 7.8, and 539 ps, and a total amplitude of +29 cm-1; the slowest (539 ps) component corresponds to structural motions relocating the ReI-chromophore relative to the peptide chain.[15] The excited-state A’(1) IR band of ReI(dmp)(K)AzCuII is much broader, the “instantaneous” shift is slightly negative and the dynamic blue shift is still apparent between 2 and 3 ns, although it cannot readily be quantified. The Re-azurins containing position-122 aromatic amino acids show a common excited-state IR-pattern (Figure 9) that is different from that of ReI(dmp)(K)AzCuII and other Re-azurins.[15] The excited-state A’(1) band partly overlaps with the bleach and tails toward higher energies. At 1-2 ps after excitation, the A’(1) band is shifted to lower energies by at least -12 cm-1. This negative “instantaneous” shift is followed by a dynamic upshift across the bleach region that is apparent until ~2 ns. The band maximum of the relaxed excited state is upshifted from the ground-state position by only 8-10 cm-1 for W122 and 10-13 cm-1 for Y122 and F122. The relatively small A’(1) upshift points to a smaller Re(CO)3→dmp MLCT contribution to the excited state if an aromatic amino acid is placed next to the Re chromophore; this conclusion is further supported by DFT and TD-DFT calculations below.
Figure 9.
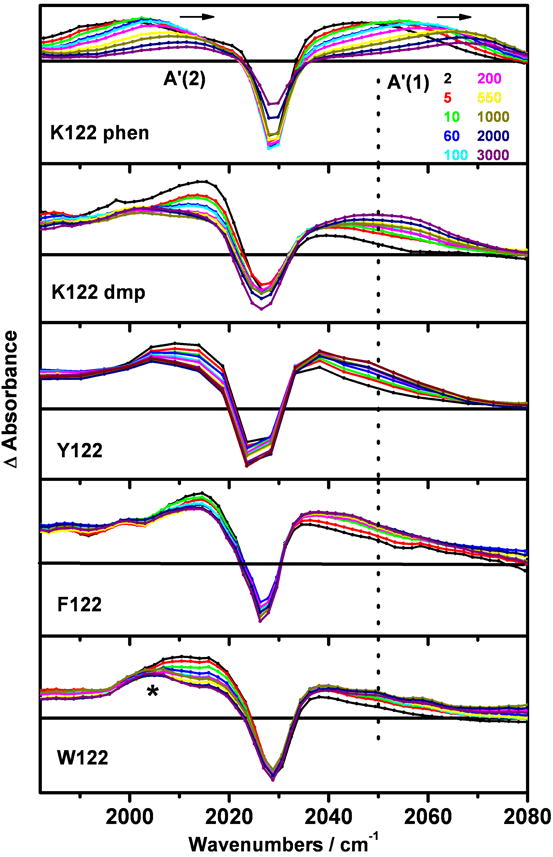
Time-resolved IR spectra of Re(N,N)(A)-labeled azurins in the high-energy part of the ν(CO) region. From top to bottom: Re(phen)(K)AzCuII, Re(dmp)(K)AzCuII, ReI(dmp)(Y)AzCuII, ReI(dmp)(F)AzCuII, and ReI(dmp)(W)AzCuII (3-4 mM in KPi-D2O, pD ~ 7.1, 21 °C) measured at selected time delays (see the top panel) after 400 nm, ~150 fs laser-pulse excitation. The dotted line shows the position of the highest excited-state band of ReI(dmp)(K)AzCuII. Experimental points are separated by ~5 cm-1 for ReI(dmp)(Y)AzCuII and ~1.9 cm-1 for all others.
*: spectral feature due to the 3CS formation.
Re-label excited-state character and dynamics: Electronic structure calculations
DFT calculations were performed on a model peptide fragment [ReI(phen)(W)]+ with L125 and M121 replaced by CH3NH- and CH3C(O)-, respectively (Figure 1, bottom). The H2O solvent was described by a continuum dielectric model CPCM. Calculations with three different functionals (PBE0, M06, and CAM-B3LYP) were compared, each of which provides an optimized [Re(phen)(W)]+ structure that represents the relevant part of the protein (Figure 1, Table S1). However, M06 overestimates the ground-state W(indole)-phen interaction, giving distances and the angle between the indole and phen planes too small. The long-range corrected B3LYP functional (CAM-B3LYP) reproduces well the ground-state structure (Table S1) and models the 3CS state in accordance with the M06 result (Figure S5), but predicts that the lowest allowed electronic transitions are at much higher energies than observed in the experimental absorption spectrum.
According to PBE0, the three LUMOs are localized on phen, while HOMO and HOMO-1 are W122 indole-ring π orbitals (Figure 10). Re dπ orbitals occur slightly lower in energy, as HOMO-2, which contains a large H124-imidazole π contribution; and HOMO-3. The orbitals HOMO-4,5 are π peptide (W122) orbitals.
Figure 10.
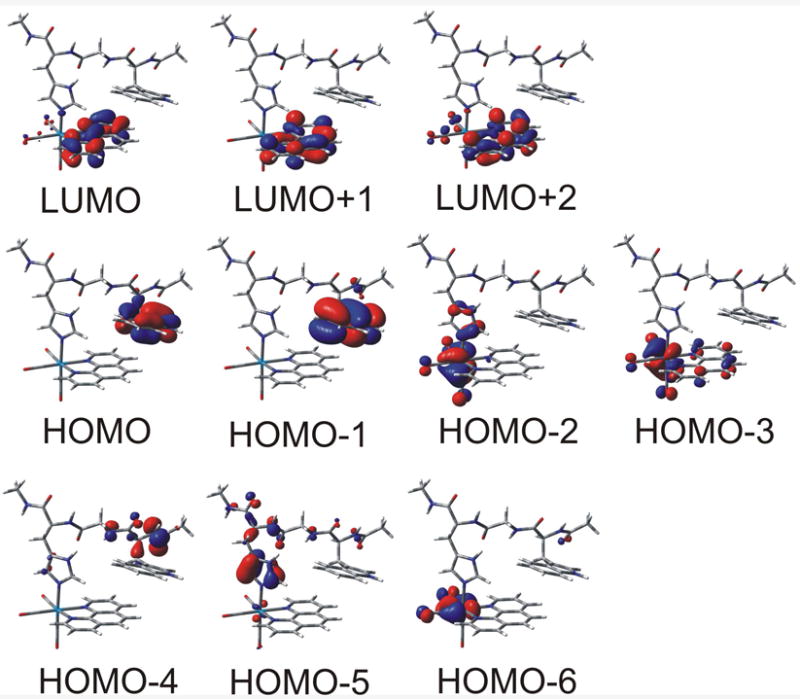
Frontier molecular orbitals of the [ReI(phen)(W)]+ fragment calculated by DFT (PBE0, CPCM-H2O)
TDDFT positions of singlet electronic transitions of [ReI(phen)(W)]+ are summarized in Tables S2, S4, and S5. The simulated and experimental spectra are shown in Figure S2. The two lowest transitions calculated (PBE0) at 465 (b1A) and 424 nm (c1A) have W(indole)→phen charge transfer character, originating in HOMO→LUMO,LUMO+1 excitations, as documented by the accompanying electron-density change shown in Figure 11 (Figure S5) for PBE0 (M06 and CAM-B3LYP) results. Oscillator strengths of these two transitions are very low (Table S2), precluding observation in the spectrum. Other weak W(indole)→phen transitions were calculated around 380 nm. Two intense transitions from HOMO-2,3 to LUMO and LUMO+1 calculated at 350 (g1A) and 335 nm (i1A) give rise to the experimentally observed broad 300-400 nm shoulder. Calculated electron-density differences (Figure 11) demonstrate their respective predominant ReI(CO)3→phen MLCT and mixed ReI(imidazole)(CO)3→phen MLCT/LLCT characters. Both these transitions are excited by 355 and 400 nm laser pulses in the time-resolved spectral experiments. Another intense, predominantly 1CT, transition was calculated at 329 nm.
Figure 11.
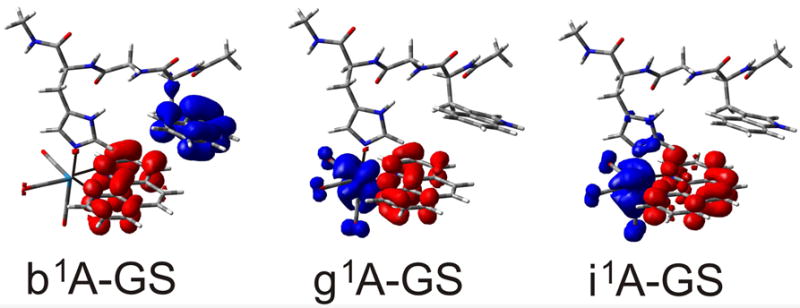
TDDFT (PBE0, CPCM-H2O) calculated electron density difference between the lowest W(indole)→phen 1CT state (left, b1A) and the two optically populated 1CT states (g1A and i1A, Table S2) and the [ReI(phen)(W)]+ ground state. Colors show regions where the electron density decreases (blue) and increases (red) upon excitation.
TDDDFT calculation at the ground-state geometry reveals two nearly degenerate triplet states: the charge-transfer state, 3CT, has major ReI→phen, and minor imidazole→phen, W(indole)→phen and π→π*(phen) contributions, whereas the charge-separated state, 3CS, has a W(indole)→phen character, 3[ReI(phen•−)(W•+)]+ (Figure 12, top). UKS (PBE0/CPCM-H2O) triplet-state structural optimization identifies the lowest relaxed triplet excited state of [ReI(phen)(W)]+ as 3CT, demonstrated by the spin-density distribution (Figure 12). Predicted ν(CO) shifts between the 3CT and ground and excited states of +42 (A”), +75 (A’(2)), and +8 (A’(1)) cm-1 agree well with the experimental values of +40, +94, and ≤+10 cm-1 (Figure S3). The unusually small A’(1) ν(CO) shift is caused by the very small CO electronic depopulation that is mainly restricted to the axial CO (Figure 12). The extent of ReI(CO)3→phen charge transfer in the 3CT state is limited by two effects: admixture of the ππ*(phen) intraligand excitation and partial charge transfer from the W122 indole ring. The similarity of ReI(dmp)(A=W,F,Y)AzM TRIR spectra (Figure 9) suggests that phenol and phenolate groups also donate electron density to dmp in the 1CT excited states of Re(dmp)(F)AzM and Re(dmp)(Y)AzM, respectively. UKS (M06/CPCM-H2O) predicts that 3CS of a W(indole)→phen character, 3[ReI(phen•−)(W•+)]+ (Figure 12), will be the lowest triplet, allowing us to optimize its structure and perform vibrational analysis. The 3CS A”+A’(2) ν(CO) vibrations (M06/H2O, Figure S4) are downshifted from ground-state values by -30 and -23 cm-1, respectively, because of the increased π electron density on the phen ligand. Accordingly, TRIR spectra show bands at ~1885 (A”+A’(2)) and ~2004 cm-1 (A’(1)), that is ~33 and 26 cm-1 lower than corresponding ground-state bands. The sensitivity of the electronic structure of the lowest triplet states to the computational details is in line with the experimentally determined energetic proximity of the ReI(dmp)(W122)AzCuI 3CT and 3CS states, ~0.028 eV.[9] The good match between experimental and calculated excited-state IR spectra demonstrates that UKS PBE0 and M06 calculations in water provide good models for the 3CT and 3CS states, respectively.
Figure 12.
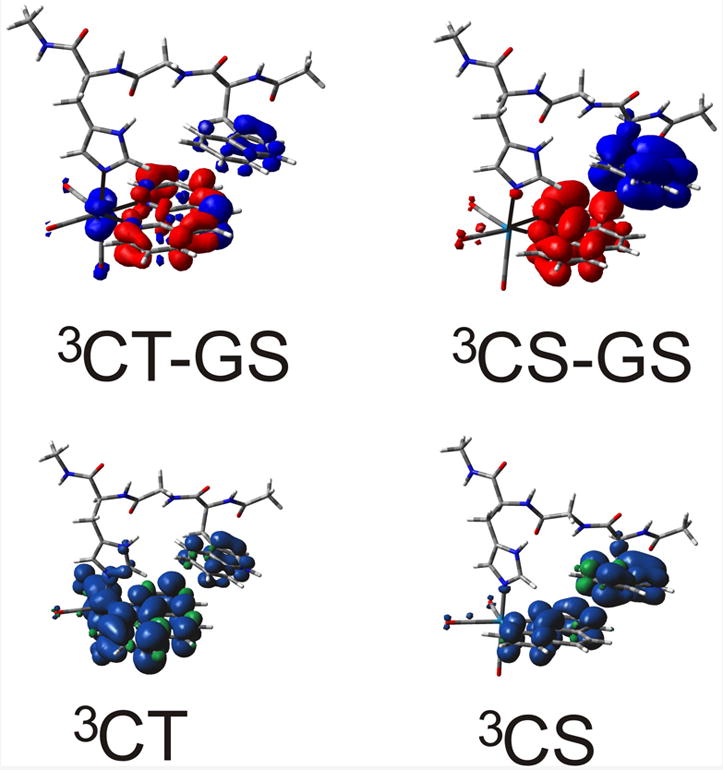
Top: Electron density differences between 3CT and 3CS states and the ground state at the ground-state geometry calculated by TD-DFT (CPCM-H2O). Bottom: spin density distributions in structurally optimized 3CT and 3CS states (DFT UKS CPCM-H2O). PBE0 and M06 functionals were used for the 3CT and 3CS calculations, respectively.
Discussion
The ReI(CO)3(dmp)(H124)(W122) unit of the azurin mutant emerges from this study as an electronically coupled active site that can be regarded as a single photoactive unit. The X-ray crystal structure (Figure 1) clearly demonstrates an interaction between the nearly parallel W(indole) and dmp rings that is strong enough to rotate the ReI(CO)3(dmp) label relative to its position in ReI(dmp)(K)AzCuII by ~90° and change the orientation of the H124 imidazole ligand relative to the ReI(CO)3(dmp) symmetry plane. DFT calculations and both ground- and excited-state IR spectra indicate that the intramolecular W(indole)-dmp interaction persists in solution. Similar interaction occurs between dmp and F122 (or Y122) in ReI(dmp)(F or Y)AzM. Although azurins, including Re(dmp)(W)AzCuII, form oligomers in solutions,[37] the kinetics data can be interpreted in terms of intramolecular ET and relaxation steps only. Intraprotein ET is much faster than ET across protein-protein interfaces in oligomers, especially when the proteins are bound by nonspecific forces, as indicated[37] by LILBID mass spectra. Intermolecular ET would not be competitive even if the indole-dmp-dmp-indole interaction found in Re(dmp)AzCuII dimers in crystals (Figure 2) were preserved in an oligomer core, as each dmp ligand is coupled to an indole of the same azurin molecule, being separated from that of the second molecule by another Re(dmp) unit.
Photoinduced charge separation producing the ReI(dmp•−)(W•+)AzM 3CS state involves several ET steps that occur on timescales ranging from femtoseconds to a few tens of ns (Scheme 1, Table 1). The ET reactivity can be understood in terms of the electronic structure, energetics and relaxation dynamics of electronic excited states of ReI(dmp)(W). Optical excitation populates 1CT excited states (ReII(dmp•−)(W), Figure 11) that undergo intersystem crossing with a time constant of ca. 110 fs,[16, 17, 53] producing a hot 3CT state. The ~110 fs 1CT lifetime allows for ultrafast exergonic W→ReII ET to the 1CS state, followed by fs intersystem crossing to 3CS. This pathway is responsible for sub-ps 3CS formation, observed by TRIR. (Direct optical excitation into W→dmp 1CS states is improbable because of the very low oscillator strengths of corresponding transitions: Table S2, Figure S2.) The 3CT state is initially “hot”: it is both vibrationally excited and in an unequilibrated solvent and protein environment.[15] Relaxation (complete in 1-2 ns, as follows from the dynamical shift of the excited-state A’(1) ν(CO) band) involves a multitude of structural movements optimizing electrostatic interactions between the excited Re-label, the peptide and solvent molecules.[15] Concomitantly with structural relaxation of the Re-site, the hot 3CT state undergoes W→ReII(dmp•−) ET to the 3CS state ReI(dmp•−)(W•+) in tens to hundreds of ps, slowing to ~1 ns upon 3CT relaxation. The relaxed 3CT state is the principal precursor of charge separation. Electronic interaction between W(indole) and dmp in the predominantly Re→dmp/ππ*(dmp) 3CT state is evident from calculated electron-density changes and excited-state spin-density distribution that partly extend over the W(indole) moiety (Figure 12). The 3CT to 3CS conversion can be viewed either as a W(indole)→dmp•−→ReII electron-density shift or a W→ReII ET mediated by dmp•− (and its ππ interaction with the indole). An alternative ET pathway through peptide bonds is less likely because of much longer length and negligible electronic involvement of peptide and imidazole orbitals in the 3CT state (Figures 10, 12). DFT calculations show that the relaxed 3CT and 3CS states are nearly isoenergetic. Accordingly, the kinetics analysis points to an equilibrium between these two states, with 3CS only 0.028 (0.012) eV below 3CT for CuI (CuII), whereas 3CS is 0.027 eV above 3CT for ZnII. The ReI(dmp•−)(W•+)AzM 3CS state decays to the ground state by dmp•−→W•+ charge recombination that takes place with a 30-60 ns time constant for CuII or CuI and ~160 ns for ZnII. This is a highly exergonic process (2.0-2.5 V) occurring in the Marcus inverted region. The ET and relaxation dynamics within ReI(dmp)(W) are similar for CuI and CuII, the equilibrium constant K being slightly larger for CuII (3) than CuI (1.6). ReI(dmp)(W)ZnII is distinctly different, since the 3CS state is formed only by ultrafast processes in a close-to-equilibrium ratio. W→ReII ET (3CT→3CS) is slightly endergonic (K ≅ 0.34), in contrast to the CuI and CuII energetics. The different ZnII azurin behavior could be attributable to more extensive oligomerization of ReI(dmp)(W)ZnII than ReI(dmp)(W)CuII, as indicated by longer rotation times, ca. 30 and 50 ns, respectively (see above). Oligomerization could shield the binding site and change its structure and energetics by intermolecular interactions. The energetic proximity of the 3CT and 3CS states contrasts with the ~0.4 V difference between the Re-label excited-state reduction potential (E’ ≅ +1.4 V vs. NHE)[28] and the indole oxidation potential (E’ ≅ 1.01 V)[54], suggesting that binding site energetics are strongly affected by the interaction between dmp indole groups and the protein environment.
The full potential of the ReI(dmp)(W) ET phototrigger is revealed by the dramatic acceleration[9] of long-range CuI→ReII ET in 3CT-excited ReI(dmp)(W)AzCuI. CuII formation is complete in a few tens of ns, whereas no reaction is found for analogous azurins with phenylalanine or tyrosine at position 122. In the long-range ET mechanism of ReI(dmp)(W)AzCuI (Scheme 1), the rapidly established 3CT / 3CS equilibrium feeds the productive CuI→W•+ ET step from a long-lived 3CT population, whereas 3CS dmp•−→W•+ charge recombination is energy-wasting, decreasing the reaction yield. Productive CuI→W•+ ET is remarkably fast (31 ns) over a 1.12 nm distance, likely because the indole group is electronically well coupled with the peptide. The efficiency of any light-harvesting or photocatalytic system based on this type of mechanism will increase upon increasing the inherent 3CT lifetime, slowing dmp•−→W•+ recombination and accelerating the final ET step.
The interaction between W(indole) and dmp is a prerequisite for rapid charge separation in ReI(dmp)(W) through the 3CT / 3CS equilibrium. Indeed, W→ReII ET is much slower in analogous systems without a direct indole-N,N contact. Photoinduced ET reactions in [ReI(pyridine-W)(CO)3(N,N)]+ and [ReI(imidazole-W)(CO)3(N,N)]+ (N,N =bpy, phen) occur with a time constant of ~30 ns in MeCN solutions, without any ultrafast kinetics component.[14, 51] Flash-quench-generated ReII(CO)3(phen)(H107) oxidizes W108 in Re(Q107H)(W48F/Y72F/H83Q/Y108W)AzZnII with a 360 ns time constant,[34] much slower than the similar reaction in 3CT-excited ReI(dmp)(W)AzM. The phen and W108 indole rings in these modified proteins are oriented away from each other, disfavoring any direct electronic interaction.
Phototriggering by the ReI(dmp)(W) unit in azurins is akin to the 30 ps primary electron transfer in DNA photolyase activation that occurs over ~1.5 nm, involving several ππ interactions: from the W382 indole group to an electronically excited flavin radical whose aromatic rings are partly overlapping 4.2 Å apart, followed by a sequence of ET steps through a “nanowire” of three π-π interacting tryptophans.[55-60] Ultrafast charge separation also is accomplished in a tight binding antibody protein pocket containing t-stilbene π-stacked to tryptophan. Stilbene photoexcitation produces a strongly luminescent 1[stilbene•−/W•+] charge-separated complex with biosensing functions.[61] This type of ππ interaction also can mediate ET at protein-protein interfaces: fast equilibration between oxidized Zn-porphyrin and a nearby tryptophane has been demonstrated to facilitate charge recombination following photoexcitation of a Zn-cytochrome c peroxidase:cytochrome c complex.[62, 63]
We suggest that the principle underlying ET acceleration in ReI(dmp)(W)AzM azurins, namely, ultrafast photoinduced charge separation between a π-stacked electron donor and acceptor, can guide the design and construction of more efficient light-energy harvesting systems. Rhenium carbonyl-diimine / tryptophan assemblies could be exploited in such constructions.
Supplementary Material
Acknowledgments
We thank Lucie Sokolová (J.W. Goethe University, Frankfurt am Main) for measuring and interpreting the solution LILBID mass spectra. Research at Caltech was supported by NSF Center for Chemical Innovation (Powering the Planet. CHE-0802907 and CHE-0947829) and by NIH (DK019038 to HBG, JRW). The crystallographic work was supported by NSF - CHE-0749997 (BRC). The TRIR and theoretical investigations were funded by the STFC Rutherford Appleton Laboratory, CMSD 43, Queen Mary University of London, European COST and ESF-DYNA programs, and Ministry of Education of the Czech Republic grants ME10124 and OC09043.
Footnotes
Supporting Information Available: Ns TRIR spectrum of ReI(dmp)(Y)AzZnII, DFT-calculated and experimental UV-vis absorption spectra of [ReI(phen)(W)]+ and ReI(dmp)(W)AzCuII, respectively, DFT-calculated IR spectra of the ground, 3CT, and 3CS states of [ReI(phen)(W)]+, 3CT, and 3CS electron density differences calculated with M06 and CAM-B3LYP functionals, comparison of calculated and experimental structural parameters of [ReI(phen)(W)]+ and ReI(dmp)(W)AzCuII, respectively, tables of TDDFT calculated vertical singlet and triplet electronic transitions of [ReI(phen)(W)]+.
Contributor Information
Jay R. Winkler, Email: winklerj@caltech.edu.
Harry B. Gray, Email: hbgray@caltech.edu.
Stanislav Záliš, Email: zalis@jh-inst.cas.cz.
Antonín Vlček, Jr., Email: a.vlcek@qmul.ac.uk.
References
- 1.Langen R, Chang I-J, Germanas JP, Richards JH, Winkler JR, Gray HB. Science. 1995;268:1733. doi: 10.1126/science.7792598. [DOI] [PubMed] [Google Scholar]
- 2.Crane BR, Di Bilio AJ, Winkler JR, Gray HB. J Am Chem Soc. 2001;123:11623. doi: 10.1021/ja0115870. [DOI] [PubMed] [Google Scholar]
- 3.Di Bilio AJ, Hill MG, Bonander N, Karlsson BG, Villahermosa RM, Malmström BG, Winkler JR, Gray HB. J Am Chem Soc. 1997;119:9921. [Google Scholar]
- 4.Skov LK, Pascher T, Winkler JR, Gray HB. J Am Chem Soc. 1998;120:1102. [Google Scholar]
- 5.Gray HB, Winkler JR. Chem Phys Lett. 2009;483:1. doi: 10.1016/j.cplett.2009.10.051. [DOI] [PMC free article] [PubMed] [Google Scholar]
- 6.Grădinaru C, Crane BR. J Phys Chem B. 2006;110:20073. doi: 10.1021/jp0644309. [DOI] [PubMed] [Google Scholar]
- 7.Skourtis SS, Balabin IA, Kawatsu T, Beratan DN. Proc Natl Acad Sci USA. 2005;102:3552–3557. doi: 10.1073/pnas.0409047102. [DOI] [PMC free article] [PubMed] [Google Scholar]
- 8.Regan JJ, Onuchic JN. Adv Chem Phys. 1999;107:497. [Google Scholar]
- 9.Shih C, Museth AK, Abrahamsson M, Blanco-Rodriguez AM, Di Bilio AJ, Sudhamsu J, Crane BR, Ronayne KL, Towrie M, Vlček A, Jr, Richards JH, Winkler JR, Gray HB. Science. 2008;320:1760. doi: 10.1126/science.1158241. [DOI] [PubMed] [Google Scholar]
- 10.The Pseudomonas aeruginosa azurin mutants under study have a histidine (H) at position 124 and either tryptophan (W), tyrosine (Y), or phenylalanine (F) at position 122 on the β strand extending from methionine-121 that is coordinated to the metal atom (M = CuI, CuII, or ZnII). All other tyrosines and tryptophans are replaced by phenylalanines, and the Re label ReI(CO)3(dmp) (dmp = 4,7-dimethyl-1,10-phenanthroline) is bound to the H124 imidazole. These azurins are denoted ReI(dmp)(A)AzM (A = W, Y, F). The symbol A also is used generically for an aromatic amino acid. Lysine (K) analogues used for comparison are denoted ReI(dmp)(K)AzCuII and ReI(phen)(K)AzCuII (phen = 1,10-phenanthroline).
- 11.Di Bilio AJ, Crane BR, Wehbi WA, Kiser CN, Abu-Omar MM, Carlos RM, Richards JH, Winkler JR, Gray HB. J Am Chem Soc. 2001;123:3181. doi: 10.1021/ja0043183. [DOI] [PubMed] [Google Scholar]
- 12.Towrie M, Grills DC, Dyer J, Weinstein JA, Matousek P, Barton R, Bailey PD, Subramaniam N, Kwok WM, Ma CS, Phillips D, Parker AW, George MW. Appl Spectrosc. 2003;57:367. doi: 10.1366/00037020360625899. [DOI] [PubMed] [Google Scholar]
- 13.Vlček A, Jr, Farrell IR, Liard DJ, Matousek P, Towrie M, Parker AW, Grills DC, George MW. J Chem Soc Dalton Trans. 2002:701. [Google Scholar]
- 14.Towrie M, Parker AW, Vlček A, Jr, Gabrielsson A, Blanco Rodriguez AM. Applied Spectroscopy. 2005;59:467. doi: 10.1366/0003702053641397. [DOI] [PubMed] [Google Scholar]
- 15.Blanco-Rodríguez AM, Busby M, Ronayne KL, Towrie M, Sýkora J, Hof M, Záliš S, Grădinaru C, Di Bilio AJ, Crane BR, Gray HB, Vlček A J. J Am Chem Soc. 2009;131:11788. doi: 10.1021/ja902744s. [DOI] [PubMed] [Google Scholar]
- 16.Cannizzo A, Blanco-Rodríguez AM, Nahhas A, Šebera J, Záliš S, Vlček A, Jr, Chergui M. J Am Chem Soc. 2008;130:8967. doi: 10.1021/ja710763w. [DOI] [PubMed] [Google Scholar]
- 17.El Nahhas A, Cannizzo A, van Mourik F, Blanco-Rodríguez AM, Záliš S, Vlček A, Jr, Chergui M. J Phys Chem A. 2010;114:6361. doi: 10.1021/jp101999m. [DOI] [PubMed] [Google Scholar]
- 18.Frisch MJ, Trucks GW, Schlegel HB, Scuseria GE, Robb MA, Cheeseman JR, Scalmani G, Barone V, Mennucci B, Petersson GA, Nakatsuji H, Caricato M, Li X, Hratchian HP, Izmaylov AF, Bloino J, Zheng G, Sonnenberg JL, Hada M, Ehara M, Toyota K, Fukuda R, Hasegawa J, Ishida M, Nakajima T, Honda Y, Kitao O, Nakai H, Vreven T, Montgomery JA, Jr, Peralta JE, Ogliaro F, Bearpark M, Heyd JJ, Brothers E, Kudin KN, Staroverov VN, Kobayashi R, Normand J, Raghavachari K, Rendell A, Burant JC, Iyengar SS, Tomasi J, Cossi M, Rega N, Millam JM, Klene M, Knox JE, Cross JB, Bakken V, Adamo C, Jaramillo J, Gomperts R, Stratmann RE, Yazyev O, Austin AJ, Cammi R, Pomelli C, Ochterski JW, Martin RL, Morokuma K, Zakrzewski VG, Voth GA, Salvador P, Dannenberg JJ, Dapprich S, Daniels AD, Farkas O, Foresman JB, Ortiz JV, Cioslowski J, Fox DJ. Gaussian 09, Revision A.02. Gaussian, Inc.; Wallingford CT: 2009. [Google Scholar]
- 19.Perdew JP, Burke K, Ernzerhof M. Phys Rev Lett. 1996;77:3865. doi: 10.1103/PhysRevLett.77.3865. [DOI] [PubMed] [Google Scholar]
- 20.Adamo C, Barone V. J Chem Phys. 1999;110:6158. [Google Scholar]
- 21.Zhao Y, Truhlar DG. Theor Chem Acc. 2008;120:215. [Google Scholar]
- 22.Yanai T, Tew DP, Handy NC. Chem Phys Lett. 2004;393:51. [Google Scholar]
- 23.Krishnan R, Binkley JS, Seeger R, Pople JA. J Chem Phys. 1980;72:650. [Google Scholar]
- 24.Woon DE, Dunning TH., Jr J Chem Phys. 1993;98:1358. [Google Scholar]
- 25.Andrae D, Häussermann U, Dolg M, Stoll H, Preuss H. Theor Chim Acta. 1990;77:123. [Google Scholar]
- 26.Cossi M, Rega N, Scalmani G, Barone V. J Comput Chem. 2003;24:669. doi: 10.1002/jcc.10189. [DOI] [PubMed] [Google Scholar]
- 27.Blanco-Rodríguez AM, Busby M, Grădinaru C, Crane BR, Di Bilio AJ, Matousek P, Towrie M, Leigh BS, Richards JH, Vlček A, Jr, Gray HB. J Am Chem Soc. 2006;128:4365. doi: 10.1021/ja057451+. [DOI] [PubMed] [Google Scholar]
- 28.Connick WB, Di Bilio AJ, Hill MG, Winkler JR, Gray HB. Inorg Chim Acta. 1995;240:169. [Google Scholar]
- 29.Lucia LA, Abboud K, Schanze KS. Inorg Chem. 1997;36:6224. [Google Scholar]
- 30.Busby M, Matousek P, Towrie M, Clark IP, Motevalli M, Hartl F, Vlček A., Jr Inorg Chem. 2004;43:4523. doi: 10.1021/ic049659m. [DOI] [PubMed] [Google Scholar]
- 31.Liard DJ, Busby M, Farrell IR, Matousek P, Towrie M, Vlček A., Jr J Phys Chem A. 2004;108:556. [Google Scholar]
- 32.Busby M, Gabrielsson A, Matousek P, Towrie M, Di Bilio AJ, Gray HB, Vlček A., Jr Inorg Chem. 2004;43:4994. doi: 10.1021/ic035471b. [DOI] [PubMed] [Google Scholar]
- 33.Wallace L, Woods C, Rillema DP. Inorg Chem. 1995;34:2875. [Google Scholar]
- 34.Miller JE, Gradinaru C, Crane BR, Di Bilio AJ, Wehbi WA, Un S, Winkler JR, Gray HB. J Am Chem Soc. 2003;125:14220. doi: 10.1021/ja037203i. [DOI] [PubMed] [Google Scholar]
- 35.Dattelbaum DM, Omberg KM, Schoonover JR, Martin RL, Meyer TJ. Inorg Chem. 2002;41:6071. doi: 10.1021/ic020400i. [DOI] [PubMed] [Google Scholar]
- 36.Bredenbeck J, Helbing J, Hamm P. J Am Chem Soc. 2004;126:990. doi: 10.1021/ja0380190. [DOI] [PubMed] [Google Scholar]
- 37.Sokolová L, Williamson H, Sýkora J, Hof M, Gray HB, Brutschy B, Vlček A., Jr doi: 10.1021/jp110460k. manuscript in preparation. [DOI] [PMC free article] [PubMed] [Google Scholar]
- 38.Dattelbaum DM, Omberg KM, Hay PJ, Gebhart NL, Martin RL, Schoonover JR, Meyer TJ. J Phys Chem A. 2004;108:3527. [Google Scholar]
- 39.George MW, Johnson FPA, Westwell JR, Hodges PM, Turner JJ. J Chem Soc Dalton Trans. 1993:2977. [Google Scholar]
- 40.Gamelin DR, George MW, Glyn P, Grevels F-W, Johnson FPA, Klotzbücher W, Morrison SL, Russell G, Schaffner K, Turner JJ. Inorg Chem. 1994;33:3246. [Google Scholar]
- 41.Vlček A., Jr Topics Organomet Chem. 2010;29:73. [Google Scholar]
- 42.Vlček A, Jr, Záliš S. Coord Chem Rev. 2007;251:258. [Google Scholar]
- 43.Liard DJ, Busby M, Matousek P, Towrie M, Vlček A., Jr J Phys Chem A. 2004;108:2363. [Google Scholar]
- 44.Hansen JE, Longworth JW, Fleming GR. Biochemistry. 1990;29:7329. doi: 10.1021/bi00483a024. [DOI] [PubMed] [Google Scholar]
- 45.Wolcan E, Alessandrini JL, Féliz MR. J Phys Chem B. 2005;109:22890. doi: 10.1021/jp053758j. [DOI] [PubMed] [Google Scholar]
- 46.Knight TE, McCusker JK. J Am Chem Soc. 2010;132:2208–2221. doi: 10.1021/ja907303t. [DOI] [PubMed] [Google Scholar]
- 47.Johnson FPA, George MW, Hartl F, Turner JJ. Organometallics. 1996;15:3374. [Google Scholar]
- 48.Gabrielsson A, Hartl F, Zhang H, Lindsay Smith JR, Towrie M, Vlček A, Jr, Perutz RN. J Am Chem Soc. 2006;128:4253. doi: 10.1021/ja0539802. [DOI] [PubMed] [Google Scholar]
- 49.Stor GJ, Hartl F, van Outersterp JWM, Stufkens DJ. Organometallics. 1995;14:1115. [Google Scholar]
- 50.Lewis JD, Towrie M, Moore JN. J Phys Chem A. 2008;112:3852. doi: 10.1021/jp711260d. [DOI] [PubMed] [Google Scholar]
- 51.Blanco-Rodríguez AM, Towrie M, Záliš S, Sýkora J, Vlček A., Jr manuscript in preparation. [Google Scholar]
- 52.Aubert C, Vos MH, Mathis P, Eker APM, Brettel K. Nature. 2000;405:586. doi: 10.1038/35014644. [DOI] [PubMed] [Google Scholar]
- 53.El Nahhas A, Consani C, Blanco-Rodríguez AM, Lancaster KM, Braem O, Cannizzo A, Towrie M, Clark IP, Záliš S, Chergui M, Vlček A., Jr Inorg Chem. 2011 doi: 10.1021/ic102324p. manuscript in preparation. [DOI] [PubMed] [Google Scholar]
- 54.Harriman A. J Phys Chem. 1987;91:6102. [Google Scholar]
- 55.Lukacs A, Eker APM, Byrdin M, Brettel K, Vos MH. J Am Chem Soc. 2008;130:14394. doi: 10.1021/ja805261m. [DOI] [PubMed] [Google Scholar]
- 56.Byrdin M, Eker APM, Vos MH, Brettel K. Proc Natl Acad Sci USA. 2003;100:8676–8681. doi: 10.1073/pnas.1531645100. [DOI] [PMC free article] [PubMed] [Google Scholar]
- 57.Byrdin M, Lukacs A, Thiagarajan V, Eker APM, Brettel K, Vos MH. J Phys Chem A. 2010;114:3207–3214. doi: 10.1021/jp9093589. [DOI] [PubMed] [Google Scholar]
- 58.Lukacs A, Eker APM, Byrdin M, Villette S, Pan J, Brettel K, Vos MH. J Phys Chem B. 2006;110:15654. doi: 10.1021/jp063686b. [DOI] [PubMed] [Google Scholar]
- 59.Tanaka F, Chosrowjan H, Taniguchi S, Mataga N, Sato K, Nishina Y, Kiyoshi Shiga K. J Phys Chem B. 2007;111:5694. doi: 10.1021/jp066450g. [DOI] [PubMed] [Google Scholar]
- 60.Park H-W, Kim S-T, Sancar A, Deisenhofer J. Science. 1995;268:1866. doi: 10.1126/science.7604260. [DOI] [PubMed] [Google Scholar]
- 61.Debler EW, Kaufmann GF, Meijler MM, Heine A, Mee JM, Pljevaljcic G, Di Bilio AJ, Schultz PG, Millar DP, Janda KD, Wilson IA, Gray HB, Lerner RA. Science. 2008;319:1232. doi: 10.1126/science.1153445. [DOI] [PubMed] [Google Scholar]
- 62.Seifert JL, Pfister TD, Nocek JM, Lu Y, Hoffman BM. J Am Chem Soc. 2005;127:5750. doi: 10.1021/ja042459p. [DOI] [PubMed] [Google Scholar]
- 63.Kang SA, Crane BR. Proc Natl Acad Sci USA. 2005;102:15465–15470. doi: 10.1073/pnas.0505176102. [DOI] [PMC free article] [PubMed] [Google Scholar]
Associated Data
This section collects any data citations, data availability statements, or supplementary materials included in this article.


