
Figure 11.
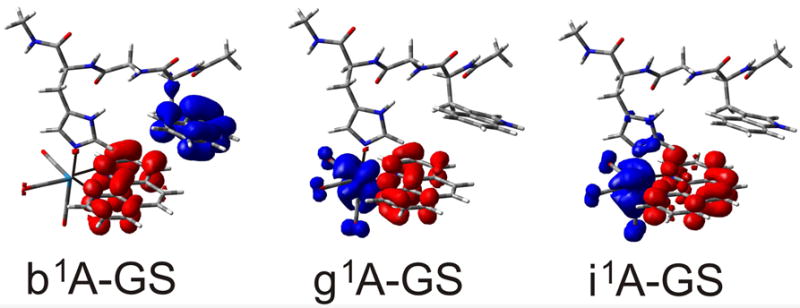
TDDFT (PBE0, CPCM-H2O) calculated electron density difference between the lowest W(indole)→phen 1CT state (left, b1A) and the two optically populated 1CT states (g1A and i1A, Table S2) and the [ReI(phen)(W)]+ ground state. Colors show regions where the electron density decreases (blue) and increases (red) upon excitation.