

Abstract
Objective
Anti-cyclic citrullinated peptide (anti-CCP) antibodies are strongly associated with increased risk of rheumatoid arthritis (RA). While the anti-CCP level is commonly dichotomized for clinical use, the best threshold for and utility of the titer as a continuous variable to predict development of RA are uncertain.
Methods
Using data from the Nurses’ Health Study and Nurses’ Health Study II longitudinal cohorts, we examined the sensitivity, specificity, and hazard of RA at various thresholds of the anti-CCP. Incident RA was confirmed using the Connective Tissue Disease Screening Questionnaire and medical record review in 93 women from among 62,437 participants with blood samples. Three controls per case were randomly chosen, matching on cohort, age, and menopausal status. Stored plasma was tested for anti-CCP antibodies with the second-generation Diastat™ ELISA. Five threshold values were assessed for sensitivity, specificity, and time to diagnosis of RA. Hazard of RA was assessed with conditional logistic regression models adjusting for smoking and reproductive factors.
Results
Using the suggested threshold of > 5 U/ml for anti-CCP positivity, specificity was 100%, but sensitivity was only 28%. A threshold of > 2 U/ml had a higher sensitivity (51%), and similar specificity (80%), with an odds ratio of 11.2 (95% confidence interval 4.7–26.9) for RA. Anti-CCP level as an ordinal variable was strongly associated with time to RA onset, with higher values predicting shorter time to RA onset.
Conclusion
A lower threshold for anti-CCP positivity was more sensitive in predicting RA development. Higher ranges of the level were informative in predicting time to RA onset.
Key Indexing Terms: RHEUMATOID ARTHRITIS, ANTI-CYCLIC CITRULLINATED PEPTIDE, STATISTICAL METHODS
Rheumatoid arthritis (RA) is a systemic autoimmune disease that affects approximately 1% of the world’s population. It is characterized by chronic and progressive joint inflammation and damage to the bones and cartilage that lead to decreased functional capacity and early mortality1. Early treatment with aggressive therapies slows progression of the disease and decreases cumulative joint damage2.
Antibodies to cyclic citrullinated peptides/proteins (anti-CCP), such as fibrinogen and vimentin, are present in the blood of 60%–80% of patients with RA and correlate with more severe, erosive disease3,4. Anti-CCP antibodies are also strongly associated with future risk of RA in asymptomatic individuals, with antibodies detected up to 10 years before diagnosis of RA5-7. The specificity of the test has been found to be close to 100% in patients with existing RA, with few false-positive results6,8,9. The sensitivity, on the other hand, ranges from 29% to 34%7 for preclinical RA, and sensitivity is about 60% for existing RA8. Since the positive predictive value (PPV) was only 5% in the general population6, its utility as a general screening tool is debatable. Rather than using anti-CCP as a single measure, there is increasing thought that it might be better considered in the context of other clinical symptoms, perhaps as part of a prediction rule to identify patients with undifferentiated arthritis likely to progress to RA10. Multiple studies have shown a PPV in pre-RA symptom onset of 69% for high-risk populations6,10,11. In addition, Rantapää-Dahlqvist, et al were able to show an increase in PPV from 80% to 91% in blood samples taken > 1.5 years before symptom onset in samples taken from patients with early RA7.
The performance characteristics for anti-CCP antibodies depend on the interpretation of a positive result using current assays for their detection. There are various manufacturers of anti-CCP assays in the US and Europe including Inova Diagnostics (San Diego, CA, USA) and Euro-diagnostics (Arnhem, The Netherlands), each determining their own threshold for positivity based on performance characteristics in their study populations. In this article we will be focusing solely on the second generation Diastat™ ELISA manufactured by Axis-Shield Diagnostics Limited (Dundee, UK). The manufacturers established a threshold using 200 samples from apparently healthy donors from the UK, Europe, and the US ranging in age from 18 to 72 years and 48% women, whose mean anti-CCP concentration was 0.6 ± 0.4 U/ml with a range of 0.05 to 3.8 U/ml. From this they suggested an assay threshold of > 5 U/ml for a positive test and report an overall sensitivity in their sample of 79% (88% in their US sample). However, the optimal threshold for situations such as in predicting future RA is uncertain, as mean and median values prior to RA may be different.
Although Rantapää-Dahlqvist, et al showed that anti-CCP levels and the relative frequency of a positive test increased closer to the start of symptoms in pre-RA patients, the relationship was flat until the < 1.5 years pre-RA diagnosis category7. It is unclear whether using the level as a continuous variable or in ordinal categories improves its prognostic ability. Lowering the threshold value to define a positive test will increase the sensitivity, but also increase the number of false positives. In our study, we examine the benefits and drawbacks of varying the threshold levels for determining a positive test, as well as the benefits of using the continuous level as a prognostic test. In addition, we look at the utility of using the anti-CCP level as a predictor of time until diagnosis of RA.
MATERIALS AND METHODS
Study population
The Nurses’ Health Study (NHS) is a prospective cohort that began in 1976, enrolling 121,701 female nurses between the ages of 30 and 55 years. It was followed by Nurses’ Health Study II (NHS II), which enrolled 116,686 female nurses between the ages of 25 and 42 years in 1989. Both cohorts were followed via biennial questionnaires (with > 90% followup) addressing information regarding diseases, lifestyle, and health practices. All participants were asked to provide blood samples (in 1989 for NHS and 1997 in NHS II); one-quarter of the participants consented. At the time of blood draw the women were between the ages of 43 and 68 for NHS and 33 and 50 for NHS II. All aspects of these studies were approved by Partners HealthCare Institutional Review Board.
Identification of RA
Data on behavioral and hormonal factors were collected biennially from 1976-2002 in NHS and 1989-2003 in NHS II. Incident RA cases between 1989-2002 and from 1997-2003 in NHS and NHS II, respectively, were identified using a 2-stage process: first, by self-report confirmed using the Connective Tissue Disease Screening Questionnaire12-14, and second, by a thorough medical record review by 2 board-certified rheumatologists trained in chart abstraction, each blinded to the other reviewer’s result. The charts were examined for the American College of Rheumatology (ACR) classification criteria for RA15, the date of first RA symptom, evidence of RA-specific medication treatment, and the treating physician’s diagnosis. The specificity of connective tissue disease detection using this method is very high, reducing misclassification of healthy subjects16. Discrepancies in diagnoses were discussed and resolved by reviewers to determine a consensus diagnosis. Definite RA was defined as subjects with 4 of the 7 ACR criteria for RA or reviewer consensus of definite RA. In addition, a small number of subjects (n = 5 cases) with 3 documented ACR criteria for RA, a diagnosis of RA by their physician, and reviewer consensus were included as having a diagnosis of RA.
Identifying controls
Three controls for each confirmed RA case were randomly chosen from subjects with stored blood, matching on cohort, birth month and year, and time of day, fasting status, menopausal status, and postmenopausal hormone use at blood draw. The control group excluded subjects with reports of systemic lupus erythematosus, psoriatic arthritis, ankylosing spondylitis, scleroderma, RA symptoms prior to blood draw, self-reported RA not confirmed by physician review, and cancer (except non-melanomatous skin cancer). No control developed RA or any other rheumatic disease during the 12-year followup period.
Anti-CCP testing
In the NHS cohort, blood was drawn from a subset of 32,826 in 1989, when participants were aged 43–68 years. In the NHS II cohort, blood was drawn from a subset of 29,613 participants starting in 1997 when participants were aged 51–76 years. Stored plasma was tested for anti-CCP antibodies with the second-generation Diastat ELISA in the same laboratory in 2004. Analysis was performed at the Clinical Immunology Laboratory at Brigham and Women’s Hospital. Study sample anti-CCP levels were reported in units from 0 to 100. Any level greater than 100 was reported as > 100 and analyzed as 101.
Additional variables
Data on cigarette smoking (in pack-years), parity, total duration of breastfeeding, menopausal status, and postmenopausal hormone use were selected from the questionnaire cycle prior to the date of RA diagnosis (or index date in controls). Although smoking and hormonal factors have not been shown to be associated with anti-CCP levels, it has been shown that smoking, parity, breastfeeding, and race are associated with the risk of RA17-19. Therefore, data were included for these potential confounders and RA risk factors, from questionnaires prior to RA diagnosis or matched date in controls. Smoking was analyzed as pack-years, defined as the product of packs smoked per day and the number of years smoked, on a continuous scale. Parity and breastfeeding were categorized as nulliparous, parous with no history of breastfeeding, parous with 1 year or less of breastfeeding, and parous with more than 1 year of breastfeeding. Race was categorized as Caucasian or other race, with > 95% of NHS and NHS II participants reporting their race to be Caucasian.
Statistical analysis
Means and standard deviations (SD) were calculated for continuous variables and cases and controls were compared using t tests. Frequencies were calculated for categorical variables and cases and controls were compared using chi-squared and Fisher’s exact test when appropriate. Median levels of anti-CCP in cases and controls were compared using Wilcoxon rank-sum test. Random quality control samples from 7 NHS donors, split into 5 samples each, were randomly interspersed with study samples. These samples were analyzed for agreement within each subject using the standard error (SE) for each 5 split sample set. All analyses were performed, first, stratified by cohort and then, if results were similar, with a combined cohort. Anti-CCP results did not follow a Gaussian distribution in the cases so both mean (± SD) and median (Q1–Q3) for anti-CCP level were calculated for RA cases and controls separately.
Anti-CCP level was first assessed as a continuous variable using a receiver-operating characteristic (ROC) curve method. Second, 5 threshold values were chosen, 2 based on the ROC curve, 2 based on the median among the controls plus 1 and 2 times the interquartile range (IQR), defined as the difference between Quartile 3 and Quartile 1, and finally 1 using the manufacturer suggested threshold value. Each model was assessed for sensitivity and specificity with respect to case status. Relationships between the anti-CCP antibody level drawn in 1989 (NHS) and in 1997 (NHS II) and odds of later developing RA were assessed using conditional logistic regression models, conditioning on the matching factors and further adjusting for smoking, reproductive factors, and race. A case-only analysis was performed assessing the relationship between anti-CCP level and time to diagnosis of RA, assessing the level as both a continuous variable and using varying thresholds of anti-CCP level and mean time to diagnosis of RA. All analyses were performed using SAS version 9.1 (SAS Institute, Cary, NC, USA).
RESULTS
A total of 93 cases of incident RA with blood draw preceding first RA symptoms were identified: 81 (87%) of the cases in NHS and 12 (13%) in NHS II. The characteristics of RA cases and matched controls are presented in Table 1. The mean age of the cases at blood draw was 54.6 ± 8.2 and the mean time to diagnosis following the blood draw was 5.6 ± 3.6 years (minimum-maximum: 0.3–12.0 yrs). Two hundred seventy-nine controls were matched to the cases and their mean age at blood draw was 54.6 ± 8.1 years. There were no differences observed among cases and controls for parity and breastfeeding (p = 0.19), smoking status (p = 0.47), or Caucasian race (p > 0.99).
Table 1.
Characteristics of cases and controls at time of blood draw.
| RA Cases, n = 93 | Matched Controls, n = 279 | p | |
|---|---|---|---|
| Nurses’ Health Survey cases, n (%) | 81 (87) | 243 (87) | > 0.99* |
| Age at blood draw, yrs, mean ± SD | 54.6 ± 8.2 | 54.6 ± 8.1 | 0.96** |
| Age at RA diagnosis, yrs, mean ± SD | 60.2 ± 9.7 | NA | NA |
| Time to RA diagnosis, yrs, mean ± SD | 5.6 ± 3.6 | NA | NA |
| Anti-CCP level, continuous (U/ml), median (min–max) | 3 (0–>100) | 2 (0–4) | < 0.0001† |
| Smoking and pack-yrs | 0.47* | ||
| Never smoker, n (%) | 44 (48) | 124 (45) | |
| Ever-smoker, < 11 pack-yrs | 15 (16) | 62 (22) | |
| Ever-smoker, ≥ 11 pack-yrs | 33 (36) | 92 (33) | |
| Pack-yrs for ever-smokers, mean ± SD | 20.3 ± 14.7 | 22.3 ± 19.8 | 0.46** |
| Parity and breastfeeding | |||
| Nulliparous | 4 (4) | 25 (9) | |
| Parous/no breastfeeding | 30 (32) | 69 (25) | |
| Parous/≤ 1 yr | 46 (49) | 130 (47) | |
| Parous/> 1 yr | 13 (14) | 55 (20) | |
| Caucasian, n (%) | 92 (99) | 275 (99) | > 0.99†† |
chi-square test of independence.
Wilcoxon rank-sum test.
2-sample t test.
Fisher’s exact test.
NA: not applicable.
Seven subjects, 5 anti-CCP-negative and 2 anti-CCP-positive, chosen for quality control analysis were split into 5 samples each. The results in the 5 anti-CCP-negative subjects (anti-CCP levels ≤ 5) showed individual SE ranging from 0.20 to 0.25. The results in the 2 anti-CCP-positive donors (anti-CCP levels > 5) showed a SE of 1.44 and 0.
Among controls only, the median (minimum-maximum) for the anti-CCP level was 2 (0–4) and the IQR was 1 unit. This was used to select 2 additional thresholds to define anti-CCP positivity, the median + 1 IQR (3.0) and the median + 2 IQR (4.0). An ROC curve was generated by plotting the sensitivity (y-axis) by 1 – specificity (x-axis) (Figure 1). Two threshold values to define anti-CCP positivity were chosen from a high point on the curve (anti-CCP = 1) and a lower point (anti-CCP = 2).
Figure 1.
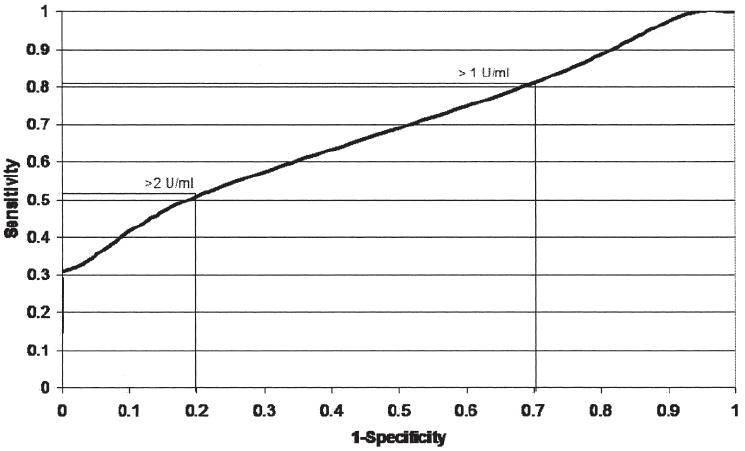
Receiver-operating characteristic (ROC) curve. Determination of anti-CCP threshold levels (> 1 and > 2 U/ml). Higher threshold levels (> 3, > 4, and > 5 U/ml) are all at the leftmost point of the ROC curve.
Results of independent analyses in the 2 cohorts were similar and all results are shown with combined data. We observed a strong relationship between anti-CCP antibody positivity and risk of developing RA (Table 2). Using the manufacturer’s recommended threshold of > 5 U/ml for positive, we had no positive controls and thus a specificity of 100%; however, the sensitivity was only 28%. In addition, since no controls have a positive anti-CCP at this cutoff, we are unable to calculate an odds ratio (OR). The sensitivity was increased to 81% with a lower threshold of > 1 U/ml, but specificity dropped to only 30%. Using a cutoff of > 2 U/ml, the sensitivity was 51% and specificity was 80%. In simple conditional logistic regression models, with a threshold for anti-CCP positivity of > 2 U/ml, the odds of incident RA were 10.6-times increased among the anti-CCP positive (95% CI 4.8–23.0). Further adjustment for smoking, reproductive factors, and race increased the OR to 11.2 (95% CI 4.7–26.9). Using a cutoff of > 3 (1 SD above mean in controls), the sensitivity was 32%, specificity was 97%, and adjusted OR of incident RA was 18.4 (95% CI 6.5–52.4).
Table 2.
Relative risks and predictive accuracy of 5 threshold levels of anti-CCP level.
| Level, U/ml | Anti-CCP+Cases | Anti-CCP+Controls | Odds Ratio Model 1* (95% CI) | Odds Ratio Model 2** (95% CI) | Sensitivity, % | Specificity, % |
|---|---|---|---|---|---|---|
| >1 | 75 (81) | 195 (72) | 2.6 (1.3–5.5) | 1.9 (0.9–4.3) | 81 | 30 |
| >2 | 47 (51) | 57 (20) | 10.6 (4.8–23.0) | 11.2 (4.7–26.9) | 51 | 80 |
| >3 | 30 (32) | 9 (3) | 16.7 (6.5–43.3) | 18.4 (6.5–52.4) | 32 | 97 |
| >4 | 28 (30) | 0 (0) | 30 | 100 | ||
| >5 | 26 (28) | 0 (0) | 28 | 100 |
Model 1: conditional logistic regression controlling for matching factors.
Model 2: Model 1 with additional adjustment for residual age, body mass index (continuous), smoking status/pack-years of smoking categories (never, ever/< 11 pack-yrs, ever/≥ 11 pack-yrs), breastfeeding categories (nulliparous, parous/no breastfeeding, parous/< 1 yr breastfeeding, and parous/≥ 1 yr breastfeeding), menopause status/postmenopausal hormone use at diagnosis, menses before 12 years old, regularity of periods, and Caucasian race.
Among 93 women who later developed RA, there was a significant relationship between the time between blood draw and RA diagnosis and continuous anti-CCP level, with a Spearman correlation coefficient of −0.288 (p = 0.005), indicating that higher anti-CCP levels are associated with shorter time to RA diagnosis (data not shown). Defining anti-CCP-positive as > 3 U/ml, we observed a statistically significant difference in mean time to RA, with 3.7 ± 3.0 years for anti-CCP-positive subjects and 6.6 ± 3.5 years for anti-CCP-negative subjects (p = 0.0002) (Table 3). Stratifying anti-CCP antibody level into 4 categories (≤ 3, 4–10, 11–100, and > 100 U/ml), a strong trend in the relationship to mean time to RA diagnosis was seen (6.6, 5.7, 3.2, and 2.3 yrs, respectively; p = 0.0005).
Table 3.
Time to diagnosis of RA by anti-CCP levels (U/ml).
| Group | Cases of RA, n | Mean Time to Diagnosis, yrs | Median (Q1–Q3) |
|---|---|---|---|
| Anti-CCP antibody, dichotomized grouping | |||
| ≤ 3 (negative) | 63 | 6.6 ± 3.5 | 7.0 (3.2–9.8) |
| > 3 (positive) | 30 | 3.7 ± 3.0 | 2.9 (1.2–5.3) |
| p* | 0.0002 | 0.0002 | |
| Anti-CCP antibody, ordinal grouping | |||
| ≤ 3 | 63 | 6.6 ± 3.5 | 7.0 (3.2–9.8) |
| 4–10 | 8 | 5.7 ± 3.4 | 6.2 (2.6–8.7) |
| 11–100 | 15 | 3.2 ± 2.7 | 2.8 (1.4–4.3) |
| >100 | 7 | 2.3 ± 2.2 | 1.4 (0.6–5.3) |
| p* | 0.0005 | ||
For mean time, using analysis of variance, for median, using Wilcoxon rank-sum test.
DISCUSSION
In these large prospective cohorts of women, we observed a clear relationship between preclinical anti-CCP level, as determined by the second-generation Diastat ELISA, and the risk of developing RA. Even with lower thresholds to define a positive anti-CCP level than the manufacturer’s recommendation, we saw strong associations with moderate predictive ability. In addition to the relationship with overall RA risk, there are also clear associations between preclinical anti-CCP level, both as an ordinal and a continuous biomarker, and time to RA diagnosis.
In our analysis, the high specificities of thresholds of > 2 U/ml or > 3 U/ml (specificities 80% and 97%, respectively) were similar to those in previous studies by Lee and Schur, Nielen, et al, Schellekens, et al, van der Helm-van Mil, et al, and by the manufacturer (Axis-Shield Diagnostics Limited)6,8-11. The manufacturer’s reported sensitivity of 79%–88% for a threshold of > 5 U/ml was much greater than the 29% sensitivity that we saw at that level. These differences may be due to lower sensitivity among preclinical RA in our study when compared to the manufacturer’s study, in which patients with existing RA were tested. Our sensitivity results are similar to those found in the preclinical RA cohorts of Nielen, et al (sensitivity = 29%)6 and Rantapää-Dahlqvist, et al, who report a sensitivity at least 1.5 years before symptom onset of 25%7. However, when measured among patients with early RA they report a sensitivity of 70%, which is similar to those reported by the manufacturer for RA. Thus, although sensitivity among preclinical RA is clearly lower than among existing RA we found that lower levels of anti-CCP, previously not thought to be significant, can still be useful if the goal is to increase sensitivity for detecting RA at a preclinical stage. For example, at CCP > 2 U/ml, the sensitivity increases to 51% with only a small decrease in specificity (80%).
In our case-only analysis, we found a strong correlation between increasing anti-CCP level as a continuous marker and shorter time to diagnosis of RA. This relationship was evident when the level was categorized into 2 categories, positive and negative, or 4 categories with the mean time to diagnosis of RA shortest in the groups with anti-CCP > 10 U/ml. These results suggest a relationship similar to that seen by Rantapää-Dahlqvist, et al, which showed an increased mean anti-CCP level the closer the blood draw was to the diagnosis of RA.
Strengths of our study include the prospective design of the data collection, which precludes recall bias, and the matched structure of the data, which adds to the power of the analysis. Information on exposures and covariates was obtained at multiple timepoints preceding the blood draw, allowing for cumulative measurement of exposures such as cigarette smoking. We were able to show that the relationship between anti-CCP level and risk of RA remains strong even after adjusting for hormonal and behavioral factors. Ours is also the first study to look at the benefits of using anti-CCP as a continuous marker for predicting future diagnosis of RA.
The annual incidence rate in this study is 30.8 per 100,000 person-years, which was substantially lower than rates reported by other studies20,21; however, this can be attributed to the “healthy volunteer” effect, where participants in studies tend to be healthier than the larger population.
One limitation of this analysis is that it applies directly only to CCP measured with the Diastat ELISA; however, our findings suggest that when doing clinical research with a control sample using alternate testing kits, it is worthwhile to investigate multiple thresholds for anti-CCP positivity. In addition, these assays were performed up to a CCP level of 100 U/ml. We did not do further dilutions above 100 U/ml and thus we cannot assess values above 100 U/ml. Further, we were unable to assess the influence of matching factors such as age, menopausal status, and postmenopausal hormone use on the relationship between anti-CCP and RA because of the matched structure of our data. Participants in both NHS and NHS II are well educated and mostly Caucasian, and although it is not likely that biologic relationships among these women differ from those among women in the greater population, these findings should be replicated in more diverse cohorts. Another limitation is the lack of consecutive anti-CCP measures in the same subject, precluding an analysis of the predictive value of changing levels over time. Also, an important consideration is that anti-CCP-positive “controls” may have developed RA after 2003. However, incident rates of RA decrease in the 7th and 8th decade of life and it is unlikely there were many new cases.
We observed a clear relationship between anti-CCP level and future diagnosis of RA not only with the dichotomous (positive vs negative) biomarker, but also with a continuous biomarker for predicting short time to diagnosis. In the case of the Diastat ELISA, we suggest using a threshold of > 2 U/ml to balance sensitivity and specificity in research studies involving RA prediction. In general, researchers should examine the most appropriate threshold, depending on whether their goal is to maximize sensitivity or specificity, and considering the distribution of levels in an appropriate control population. For clinicians, lower values of anti-CCP levels should be regarded as a probable sign of preclinical RA, not disregarded as uninformative. This information could be used as an additional tool for clinicians in determining course of action in treating the earliest potential symptoms of RA, especially in high-risk populations.
Acknowledgments
Supported by an Arthritis Investigator Award from the Arthritis Foundation/American College of Rheumatology, a Katherine Swan Ginsburg Memorial Award, National Institutes of Health (NIH) K12 HD051959, R01 AR49880, K24 AR0524-01 and K23 AR050607-01, and The Gosden-Robinson Early Arthritis Center, New York, New York.
Contributor Information
LORI B. CHIBNIK, Boston University, Division of Rheumatology, Immunology, and Allergy, Section of Clinical Sciences, Brigham and Women’s Hospital.
LISA A. MANDL, Division of Rheumatology, Hospital for Special Surgery, Cornell Weill Medical College.
KAREN H. COSTENBADER, Division of Rheumatology, Immunology, and Allergy, Section of Clinical Sciences, and Channing Laboratory, Department of Medicine, Brigham and Women’s Hospital, Harvard Medical School.
PETER H. SCHUR, Division of Rheumatology, Immunology, and Allergy, Section of Clinical Sciences, Brigham and Women’s Hospital, Harvard Medical School.
ELIZABETH W. KARLSON, Division of Rheumatology, Immunology, and Allergy, Section of Clinical Sciences, and Channing Laboratory, Department of Medicine, Brigham and Women’s Hospital, Harvard Medical School.
References
- 1.Pincus T, Callahan LF, Sale WG, Brooks AL, Payne LE, Vaughn WK. Severe functional declines, work disability, and increased mortality in seventy-five rheumatoid arthritis patients studied over nine years. Arthritis Rheum. 1984;27:864–72. doi: 10.1002/art.1780270805. [DOI] [PubMed] [Google Scholar]
- 2.Smolen JS, Han C, van der Heijde D, et al. Infliximab treatment maintains employability in patients with early rheumatoid arthritis. Arthritis Rheum. 2006;54:716–22. doi: 10.1002/art.21661. [DOI] [PubMed] [Google Scholar]
- 3.Mewar D, Coote A, Moore DJ, et al. Independent associations of anti-cyclic citrullinated peptide antibodies and rheumatoid factor with radiographic severity of rheumatoid arthritis. Arthritis Res Ther. 2006;8:R128. doi: 10.1186/ar2017. [DOI] [PMC free article] [PubMed] [Google Scholar]
- 4.Pedersen M, Jacobsen S, Klarlund M, et al. Environmental risk factors differ between rheumatoid arthritis with and without autoantibodies against cyclic citrullinated peptides. Arthritis Res Ther. 2006;8:R133. doi: 10.1186/ar2022. [DOI] [PMC free article] [PubMed] [Google Scholar]
- 5.Berglin E, Padyukov L, Sundin U, et al. A combination of autoantibodies to cyclic citrullinated peptide (CCP) and HLA-DRB1 locus antigens is strongly associated with future onset of rheumatoid arthritis. Arthritis Res Ther. 2004;6:R303–8. doi: 10.1186/ar1187. [DOI] [PMC free article] [PubMed] [Google Scholar]
- 6.Nielen MM, van Schaardenburg D, Reesink HW, et al. Specific autoantibodies precede the symptoms of rheumatoid arthritis: a study of serial measurements in blood donors. Arthritis Rheum. 2004;50:380–6. doi: 10.1002/art.20018. [DOI] [PubMed] [Google Scholar]
- 7.Rantapaa-Dahlqvist S, de Jong BA, Berglin E, et al. Antibodies against cyclic citrullinated peptide and IgA rheumatoid factor predict the development of rheumatoid arthritis. Arthritis Rheum. 2003;48:2741–9. doi: 10.1002/art.11223. [DOI] [PubMed] [Google Scholar]
- 8.Lee DM, Schur PH. Clinical utility of the anti-CCP assay in patients with rheumatic diseases. Ann Rheum Dis. 2003;62:870–4. doi: 10.1136/ard.62.9.870. [DOI] [PMC free article] [PubMed] [Google Scholar]
- 9.Schellekens GA, Visser H, de Jong BA, et al. The diagnostic properties of rheumatoid arthritis antibodies recognizing a cyclic citrullinated peptide. Arthritis Rheum. 2000;43:155–63. doi: 10.1002/1529-0131(200001)43:1<155::AID-ANR20>3.0.CO;2-3. [DOI] [PubMed] [Google Scholar]
- 10.van der Helm-van Mil AH, le Cessie S, van Dongen H, Breedveld FC, Toes RE, Huizinga TW. A prediction rule for disease outcome in patients with recent-onset undifferentiated arthritis: how to guide individual treatment decisions. Arthritis Rheum. 2007;56:433–40. doi: 10.1002/art.22380. [DOI] [PubMed] [Google Scholar]
- 11.van der Helm-van Mil AH, Verpoort KN, le Cessie S, Huizinga TW, de Vries RR, Toes RE. The HLA-DRB1 shared epitope alleles differ in the interaction with smoking and predisposition to antibodies to cyclic citrullinated peptide. Arthritis Rheum. 2007;56:425–32. doi: 10.1002/art.22373. [DOI] [PubMed] [Google Scholar]
- 12.Karlson EW, Sanchez-Guerrero J, Wright EA, et al. A connective tissue disease screening questionnaire for population studies. Ann Epidemiol. 1995;5:297–302. doi: 10.1016/1047-2797(94)00096-c. [DOI] [PubMed] [Google Scholar]
- 13.Karlson EW, McAlindon TE, Costenbader KH, et al. High sensitivity, specificity and predictive value of the connective tissue disease questionnaire (CSQ) among urban African-American women [abstract] Arthritis Rheum. 2003;48(Suppl):S186. doi: 10.1191/0961203305lu2227oa. [DOI] [PubMed] [Google Scholar]
- 14.Karlson EW, Lee IM, Cook NR, Manson JE, Buring JE, Hennekens CH. Comparison of self-reported diagnosis of connective tissue disease with medical records in female health professionals: the Women’s Health Cohort Study. Am J Epidemiol. 1999;150:652–60. doi: 10.1093/oxfordjournals.aje.a010064. [DOI] [PubMed] [Google Scholar]
- 15.Arnett FC, Edworthy SM, Bloch DA, et al. The American Rheumatism Association 1987 revised criteria for the classification of rheumatoid arthritis. Arthritis Rheum. 1988;31:315–24. doi: 10.1002/art.1780310302. [DOI] [PubMed] [Google Scholar]
- 16.Liang MH, Meenan RF, Cathcart ES, Schur PH. A screening strategy for population studies in systemic lupus erythematosus. Series design. Arthritis Rheum. 1980;23:153–7. doi: 10.1002/art.1780230204. [DOI] [PubMed] [Google Scholar]
- 17.Costenbader KH, Feskanich D, Mandl LA, Karlson EW. Smoking intensity, duration, and cessation, and the risk of rheumatoid arthritis in women. Am J Med. 2006;119:503 e1–9. doi: 10.1016/j.amjmed.2005.09.053. [DOI] [PubMed] [Google Scholar]
- 18.Jorgensen C, Picot MC, Bologna C, Sany J. Oral contraception, parity, breast feeding, and severity of rheumatoid arthritis. Ann Rheum Dis. 1996;55:94–8. doi: 10.1136/ard.55.2.94. [DOI] [PMC free article] [PubMed] [Google Scholar]
- 19.Karlson EW, Mandl LA, Hankinson SE, Grodstein F. Do breast-feeding and other reproductive factors influence future risk of rheumatoid arthritis? Results from the Nurses’ Health Study. Arthritis Rheum. 2004;50:3458–67. doi: 10.1002/art.20621. [DOI] [PubMed] [Google Scholar]
- 20.Gabriel SE, Crowson CS, O’Fallon WM. The epidemiology of rheumatoid arthritis in Rochester, Minnesota, 1955-1985. Arthritis Rheum. 1999;42:415–20. doi: 10.1002/1529-0131(199904)42:3<415::AID-ANR4>3.0.CO;2-Z. [DOI] [PubMed] [Google Scholar]
- 21.Linos A, Worthington JW, O’Fallon WM, Kurland LT. The epidemiology of rheumatoid arthritis in Rochester, Minnesota: a study of incidence, prevalence, and mortality. Am J Epidemiol. 1980;111:87–98. doi: 10.1093/oxfordjournals.aje.a112878. [DOI] [PubMed] [Google Scholar]