

Abstract
Recent developments in genome-wide transcript monitoring have led to a rapid accumulation of data from gene expression studies. Such projects highlight the need for methods to predict the molecular basis of transcriptional coregulation. A microarray project identified the 420 yeast transcripts whose synthesis displays cell cycle-dependent periodicity. We present here a statistical technique we developed to identify the sequence elements that may be responsible for this cell cycle regulation. Because most gene regulatory sites contain a short string of highly conserved nucleotides, any such strings that are involved in gene regulation will occur frequently in the upstream regions of the genes that they regulate, and rarely in the upstream regions of other genes. Our strategy therefore utilizes statistical procedures to identify short oligomers, five or six nucleotides in length, that are over-represented in upstream regions of genes whose expression peaks at the same phase of the cell cycle. We report, with a high level of confidence, that 9 hexamers and 12 pentamers are over-represented in the upstream regions of genes whose expression peaks at the early G1, late G1, S, G2, or M phase of the cell cycle. Some of these sequence elements show a preference for a particular orientation, and others, through a separate statistical test, for a particular position upstream of the ATG start codon. The finding that the majority of the statistically significant sequence elements are located in late G1 upstream regions correlates with other experiments that identified the late G1/early S boundary as a vital cell cycle control point. Our results highlight the importance of MCB, an element implicated previously in late G1/early S gene regulation, as most of the late G1 oligomers contain the MCB sequence or variations thereof. It is striking that most MCB-like sequences localize to a specific region upstream of the ATG start codon. Additional sequences that we have identified may be important for regulation at other phases of the cell cycle.
[A companion website to this manuscript is available from http://www.ncbi.nlm.nih.gov/CBBresearch/Landsman/Cell_cycle_data]
The recent surge in the availability of complete genome sequences, as well as the development of technologies such as DNA microarrays, is ushering in a new era in the analysis of gene regulation. The yeast Saccharomyces cerevisiae, whose genome is the first to be fully sequenced from a eukaryote, is ideal for these studies. A number of groups have begun to merge the previously gathered wealth of biochemical information about yeast with its newly published complete genome sequence. One way to analyze gene expression is to scan the genome for the consensus-binding sequence of a known transcription factor to predict additional genes that may be regulated by that factor. This method has been used to look for Gcn4p-binding sites (Schuldiner et al. 1998) and stress-response elements (Moskvina et al. 1998; Treger et al. 1998). Another strategy focuses on the identification of upstream gene regulatory sites in groups of coregulated genes. Van Helden et al. (1998) and Brazma et al. (1998) looked at groups of coregulated genes to find over-represented oligonucleotide sequences. Both groups detected new candidate regulatory sites, as well as sites that had already been characterized. Brazma et al. (1998) also identified sequence patterns that occur more frequently in promoter regions than in other regions of the genome.
The availability of the complete yeast genome sequence has also facilitated whole genome expression analyses in which the expression levels of the ∼6200 yeast genes are assayed in different conditions. Recent studies have identified the genes that are expressed during growth on rich and minimal medium (Wodicka et al. 1997), during the diauxic shift from anaerobic to aerobic metabolism (DeRisi et al. 1997), and when the transcriptional corepressor Tup1p is deleted or the transcriptional activator Yap1p is overexpressed (DeRisi et al. 1997). The role of key components of the transcriptional machinery on the population of yeast genes was assessed by Holstege et al. (1998). Chu et al. (1998) assayed genes induced during sporulation in yeast. Roth et al. (1998) measured transcript abundance in the galactose response, heat shock, and mating type regulation systems, and took the further step of using a modified Gibbs sampling strategy to identify sequences that may be involved in the gene regulation. Cho et al. (1998) identified 420 genes whose mRNA expression exhibits cell cycle periodicity. They classified the genes by whether their expression peaked in the early G1, late G1, S, G2, or M phase of the cell cycle. This analysis paves the way for a new type of experiment—a computational prediction of the sequence elements involved in cell cycle regulation. A preliminary analysis of these elements was described previously (Cho et al. 1998). In this manuscript, we present a more detailed interpretation.
We have developed a statistical technique to predict short sequence elements (i.e., oligomers) that may be involved in the expression of groups of coregulated genes. Our strategy is to look for pentamers and hexamers that are over-represented among the upstream regions of genes whose expression peaks at a particular phase of the cell cycle. We have identified 9 hexamers and 12 pentamers that may play a role in cell cycle regulation. Some of these oligomers may function in an orientation-dependent manner; the function of others may be dependent on their position within the promoter. The highest scoring hexamer to come out of this study, by all criteria, is the previously characterized sequence element MCB, which is known to control the expression of genes expressed in late G1 (McIntosh 1993). Thus, this method is able to select biologically relevant sequence elements, and we predict that the other elements we identified also play roles in cell cycle regulation.
A companion website to this manuscript is available from http://www.ncbi.nlm.nih.gov/CBBresearch/Landsman/Cell_cycle_data. This site includes the upstream sequence of each of the cell cycle-regulated yeast genes, electronic versions of Tables 1–4 with links from the oligomer to the names of the genes that contain the oligomer, and the 50–100 top scoring oligomers for each analysis, including some sequences that are not statistically significant.
Table 1.
Position-Independent Hexamers (Over-Represented Hexamers)
| A. Hexamers and/or reverse complements |
| B. Hexamers |
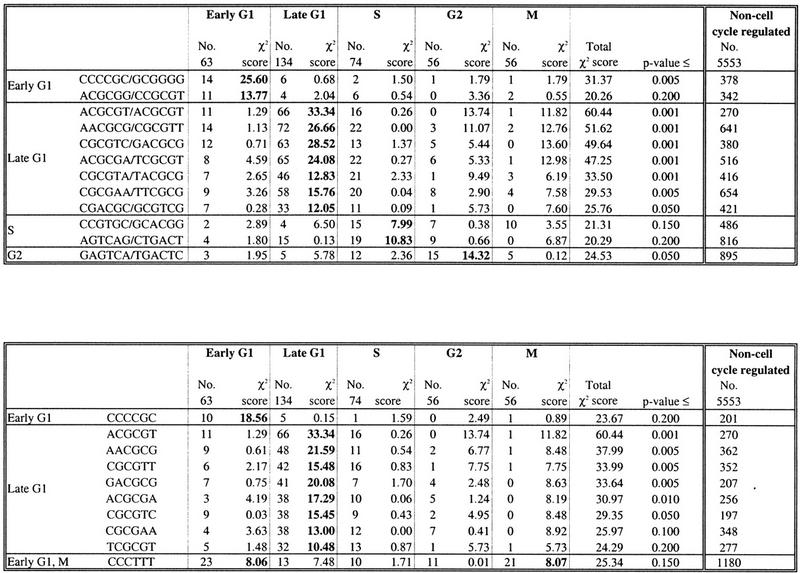 |
The number of upstream regions in each of the five sets of cell cycle-regulated genes containing one or more copies of a hexamer was counted. The counts are indicated in the column labeled “No.” The contribution to the χ2 score made by each of the data sets is shown, along with the total value of the χ2 score. The data set(s) that make the greatest contribution to χ2 are indicated in boldface type. P values for each χ2 score were calculated from a Monte Carlo simulation. The final column shows the number of upstream regions of the non-cell cycle-regulated genes containing one or more copies of each hexamer. These counts are shown for illustrative purposes only; the numbers were not included in the χ2 calculation.
Table 4.
Position-Dependent Pentamers (Clustered Pentamers)
| A. Pentamers and/or reverse complements |
| B. Pentamers |
 |
We performed a Kolmogorov–Smirnov test on each pentamer listed in Table 2. Shown here are those pentamers whose P value from this test is ≤0.05. The data set on which we performed the test is listed in the left column. We also counted the number of upstream regions in that data set that contain one or more copies of the pentamer over the 50-nucleotide intervals shown. The interval(s) with the highest numbers is in boldface type. Intervals are measured by the distance upstream of the ATG start codon.
RESULTS
Strategy for Finding Novel Candidate Regulatory Elements
Our goal, in general, is to identify novel regulatory elements in upstream regions of coexpressed yeast genes. In this specific case, we apply our method to genes that may be involved in the cell cycle-dependent regulation of transcription. Cho et al. (1998) have identified those genes whose transcription exhibits cell cycle-dependent periodicity, and have furthermore classified the genes into five sets, those expressed during the early G1 (63 genes), late G1 (134 genes), S (74 genes), G2 (56 genes), and M (56 genes) phases of the cell cycle. Our hypothesis is that sequence elements that are found more frequently (i.e., over-represented) in the upstream regions of genes expressed during one phase of the cell cycle, as compared with genes expressed during other phases of the cell cycle, may play a role in gene expression during that phase. As many transcription factors bind to short, highly conserved stretches of DNA, our analysis centers on short oligomers of length five or six, pentamers or hexamers. We limited our search to the sequence 600 nucleotides upstream of the translation start site of each gene, as most yeast regulatory elements are found within this region (Struhl 1995). Many yeast regulatory elements are analogous to mammalian enhancer sequences, and function in both orientations and at variable distances upstream of the transcription start site (Struhl 1995; Kunzler et al. 1996). Thus, we searched for oligomers whose representation is statistically significant, independent of their position and orientation. However, in higher eukaryotes, some regulatory elements act only when placed in certain locations or orientations with respect to the transcription start site (see, for example, Godambe et al. 1995; Nolan et al. 1996; Pfaff and Taylor 1998). To cover all biologically relevant possibilities, we also searched for potential orientation- and position-dependent elements, whose distribution is statistically significant on the basis of the strand or location in which the element is found.
Position-Independent Elements
The first analysis was to identify candidate elements important for cell cycle regulation in a position-independent manner. The statistical procedure is illustrated in Figure 1 with two oligomers, ACGCGT and GATGTA. Details are presented in Methods. The height of the white bar in each graph indicates the number of genes in each of the five cell cycle-regulated data sets. The number of genes whose upstream regions contain one or more copy of the sequence element is shown in purple. Pink squares indicate the number of upstream regions in that data set that would be expected to contain the sequence element, if the element were distributed evenly among the upstream regions of all of the cell cycle-regulated genes. Figure 1A illustrates that there are more ACGCGT elements in late G1 than are expected, and fewer in G2 and M. This observation is confirmed by the score for each data set (light blue), which is close to 0 in early G1 and S, in which the observed number of elements is similar to the expected number, and higher in late G1, G2, and M, in which the observed and expected numbers differ. Conversely, the observed number of GATGTA elements in each of the five data sets is similar to the expected number, so the score for each data set is close to 0 (Fig. 1B). Therefore, this hexamer is not over- or under-represented in any of the five phases.
Figure 1.
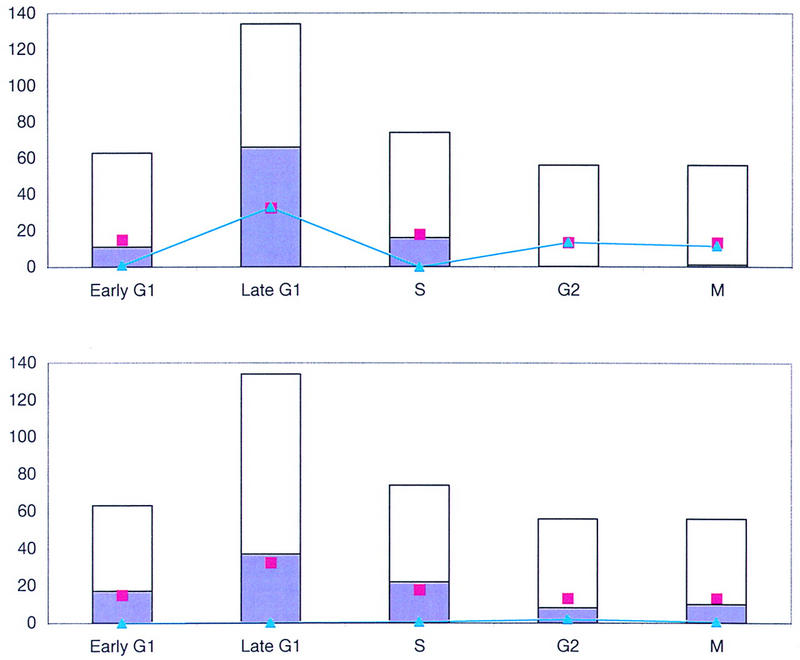
Test for hexamers over-represented in a position-independent manner. (A) Over-represented in late G1: ACGCGT. The height of the white bar represents the number of genes in each of the five cell cycle-regulated data sets. The purple shading indicates the number of upstream regions in that data set that contain one or more copy of the oligomer. The number of upstream regions expected to contain that sequence element, if the element were evenly distributed among all five data sets, is marked with the pink box. The blue line indicates the contribution that each data set makes to the χ2 score. (B) Not over-represented in any phase: GATGTA. Ninety-four cell cycle yeast upstream regions contain one or more copy of the sequence ACGCGT, and a different set of 94 contain one or more copy of the element GATGTA. However, these elements are distributed differently among the five data sets. The element ACGCGT, which has a χ2 score of 60.4, is over-represented in late G1—the observed number of elements (purple) is greater than the expected number (pink). It is also under-represented in G2 and M, as the observed number is less than the expected number. The score in those three phases (blue) is thus higher than it is in early G1 and S. The element GATGTA, which has a χ2 score of 4.9, is not significantly over- or under-represented in any data set.
In Table 1 we present a list of predicted position-independent regulatory elements. The P value associated with each element provides an estimate of the probability with which a score of that magnitude occurs by chance alone. Although we list all elements with P ≤ 0.2, (i.e., those whose score has a ≤20% chance of occurring by chance), we are most confident in those with P ≤ 0.05. Twelve elements that could function on either strand, assayed by the presence of a hexamer and/or its reverse complement on one strand, have P ≤ 0.2 (Table 1A). The distribution of an additional 10 hexamers on one strand also has P ≤ 0.2 (Table 1B). However, only one of these hexamers, CCCTTT, represents a new element; the other nine were also identified in the search for hexamers and/or their reverse complements.
The statistical significance is made on the basis of the sum of the scores across all five data sets, and provides a measure of whether the hexamer is randomly distributed among the five sets of upstream regions. However, it does not identify in which data set the hexamer is over- or under-represented. For each sequence in Table 1, we present the number of upstream regions in each phase in which it occurs, as well as the contribution that the data set makes to the final score. We have also included the number of upstream regions of non-cell cycle-regulated genes in which each oligomer occurs. This number is supplied for reference purposes only; it was not included in any calculations. We classify a hexamer as being over-represented in a particular phase on the basis of the data set that provides the highest contribution to the final score (bold in Table 1). For example, the element defined by the hexamer CCCCGC and its reverse complement GCGGGG, has a total score of 31.37 (Table 1). Its over-representation in early G1 contributes 25.60 units to the score. Some scores are also inflated by under-representation. For example, the sequence ACGCGT has a total score of 60.44. Late G1, in which it is over-represented, contributes 33.34 units to the score, whereas G2 and M, in which it is under-represented, contribute 13.74 and 11.82 units to the score, respectively. The distribution of some hexamers suggests that they may be important in more than one phase. For example, the M and early G1 upstream regions contribute equally to the final score of the hexamer CCCTTT.
This method provides us with nine oligomers in which we have high confidence (P ≤ 0.05), one in early G1, seven from late G1, and one from G2. With lower confidence (P ≤ 0.2) we present an additional four oligomers, one in early G1, two in S, and one in both early G1 and M. In late G1, the highest scoring hexamer is the well-characterized palindrome ACGCGT, also known as the MluI cell cycle box (MCB), which is involved in the transcriptional regulation of genes at the late G1/S boundary (McIntosh 1993). It is notable that all of the hexamers that are over-represented in late G1 contain some variation of the sequence ACGCGT. Thus, the seven late G1 hexamers listed in Table 1 may not be independent, but rather, variants or parts of the same regulatory site.
Position-Dependent Elements I: Elements Over-Represented in Defined Intervals
Preliminary analysis of the top scoring hexamer from the previous analysis, ACGCGT, the MCB element, showed that most copies of this sequence reside within the interval 100–200 nucleotides upstream of the ATG start codon. Thus, our next step was to calculate whether any other oligomers are over-represented in a particular interval within one of the data sets. For statistical reasons discussed in Methods, we were unable to search for hexamers in this analysis; we instead turned to pentamers. The method is similar to that which we used to identify position-independent elements, except that in this experiment, we identified sequences that are over-represented in a single 99-nucleotide interval within a data set, not in the data set as a whole. Figure 2 illustrates the method, with the pentamer ACGCG as an example. The number of genes in each data set is indicated by the height of the white bar. Purple shading denotes the number of genes in each data set whose upstream region contains one or more copy of the sequence element in the 99-nucleotide interval. Pink squares indicate the number of upstream regions in that interval that would be expected to contain the sequence element, if the element were distributed evenly among all intervals in all data sets. The pentamer ACGCG occurs more frequently than expected in the interval −104 to −202 of late G1, and, to a lesser extent, in the interval −104 to −202 of S. Thus, its score (light blue) in those intervals is higher than it is in the other intervals.
Figure 2.
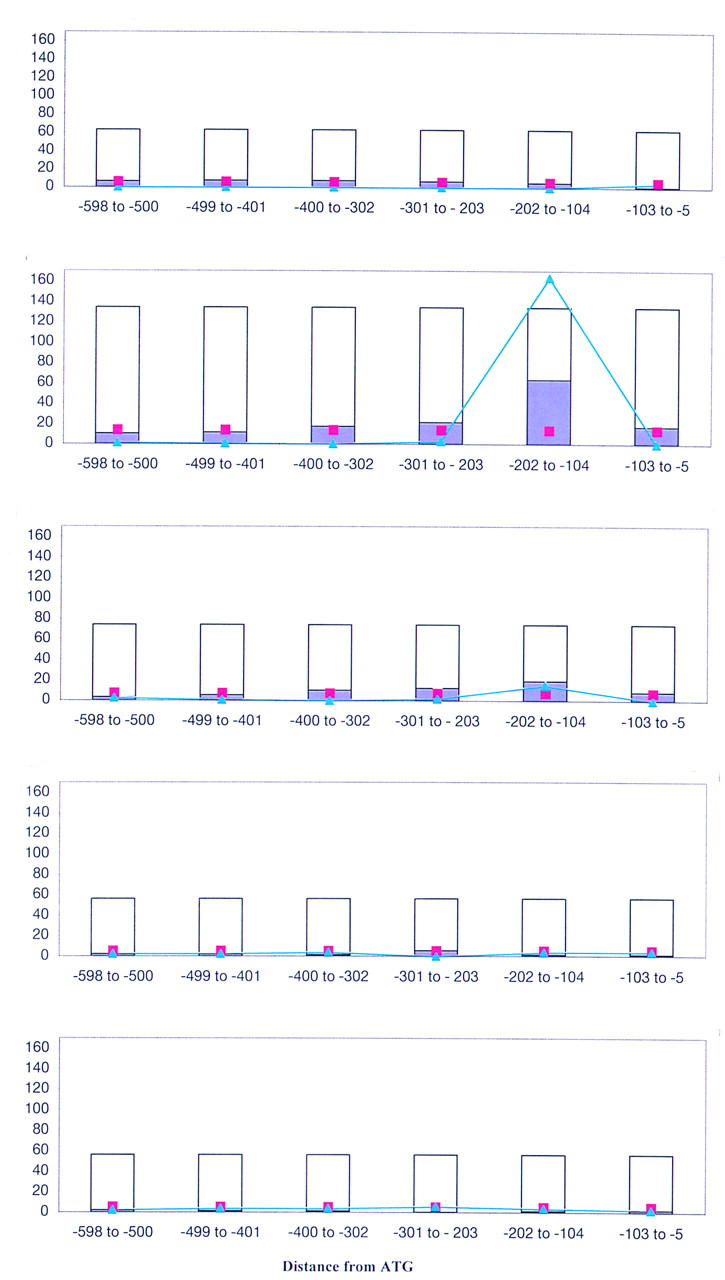
Test for pentamers over-represented in a position-dependent manner. (A) Early G1: ACGCG. The height of the white bar represents the number of genes in each interval in each data set. The purple shading indicates the number of upstream regions in that interval that contain one or more copy of the sequence element. The number of upstream regions expected to contain that sequence element, if the element were evenly distributed among all intervals in all data sets, is marked with the pink box. The blue line indicates the contribution that each interval makes to the χ2 score. (B) The pentamer ACGCG is over-represented in late G1 upstream regions in the interval −104 to −202 nucleotides upstream of the ATG start codon—the observed number of elements (purple) is greater than the expected number (pink). (C) It is somewhat over-represented in the same interval in S. The total χ2 score for ACGCG is 239.8. (D) G1: ACGCG; (E) M: ACGCG.
Table 2 is a list of all statistically significant position-depenent pentamers. With P ≤ 0.05, we find five pentamers and/or their reverse complements over-represented in late G1 in the interval −104 to −202 from the ATG start codon, one in M in the interval −203 to −301, and one in G2 from −401 to −499 and late G1 from −5 to −103 (Table 2A). We also find 13 individual pentamers with a P ≤ 0.05 (Table 2B); 8 of these pentamers represent one or both strands of the elements listed in Table 2A, whereas one is a new oligomer for early G1, two for late G1, one for S, and one for multiple sets. If we raise the threshold to P ≤ 0.2, we add in four additional pentamers in early G1 and late G1, three in S, and one in many data sets. Eight of the pentamers identified by this method are contained within hexamers identified above and may not represent novel regulatory sites. Once again, the highest scoring pentamers are contained within the MCB element (ACGCGT) and variations of that sequence (Table 2A).
Table 2.
Position-Dependent Pentamers (Over-Represented in 99 Nucleotide Intervals)
| A. χ2 scores of pentamers and/or reverse complements |
| B. χ2 scores of pentamers |
 |
The number of upstream regions containing one or more copies of a pentamer was counted over intervals of 99 nucleotides in each of the five sets of cell cycle-regulated genes. The interval, measured in nucleotides from the ATG start codon, is indicated at the top. The χ2 contribution made by each of the 30 populations is shown, along with the total value of χ2. The population(s) that make the greatest contribution to χ2 are indicated in boldface type.
(EG) Early G1; (LG) late G1; (S) S; (G2) G2; (M) M.
P-values for each χ2 value were calculated from a Monte Carlo simulation.
Position-Dependent Elements II: Clustered Within a Set of Upstream Regions
The experiment described above identifies oligomers that are over-represented in one or more 99-nucleotide intervals within the upstream regions of one or more of the five sets of cell cycle-regulated genes. However, it does not identify those elements that exhibit a preference for a specific location within one set of upstream regions. The details of this procedure are presented in Methods, and the basic concept is illustrated in Figure 3. The hexamers ACGCGT and CGACGC are both over-represented in late G1 (Table 1). Their positioning along all late G1 upstream regions is shown in the figure. The light blue lines indicate the number of times that the element is found at each position upstream of the ATG start codon across all late G1 genes. We calculated the normalized, cumulative number of occurrences of each oligomer along the late G1 upstream regions (light pink histogram), and compared it with the cumulative number of occurrences of a hypothetical, completely uniformly positioned sequence (dark pink line). The hexamer ACGCGT is observed less frequently than the hypothetical sequence from position ∼−600 to −125, whereas the hexamer CGACGC behaves similarly to the hypothetical sequence. The statistic (not illustrated) confirms that ACGCGT is clustered within late G1 upstream regions, whereas CGACGC is not. We observe empirically that ACGCGT is clustered between ∼−100 and −200 from the ATG start codon, whereas the element CGACGC is fairly evenly positioned (light blue lines).
Figure 3.
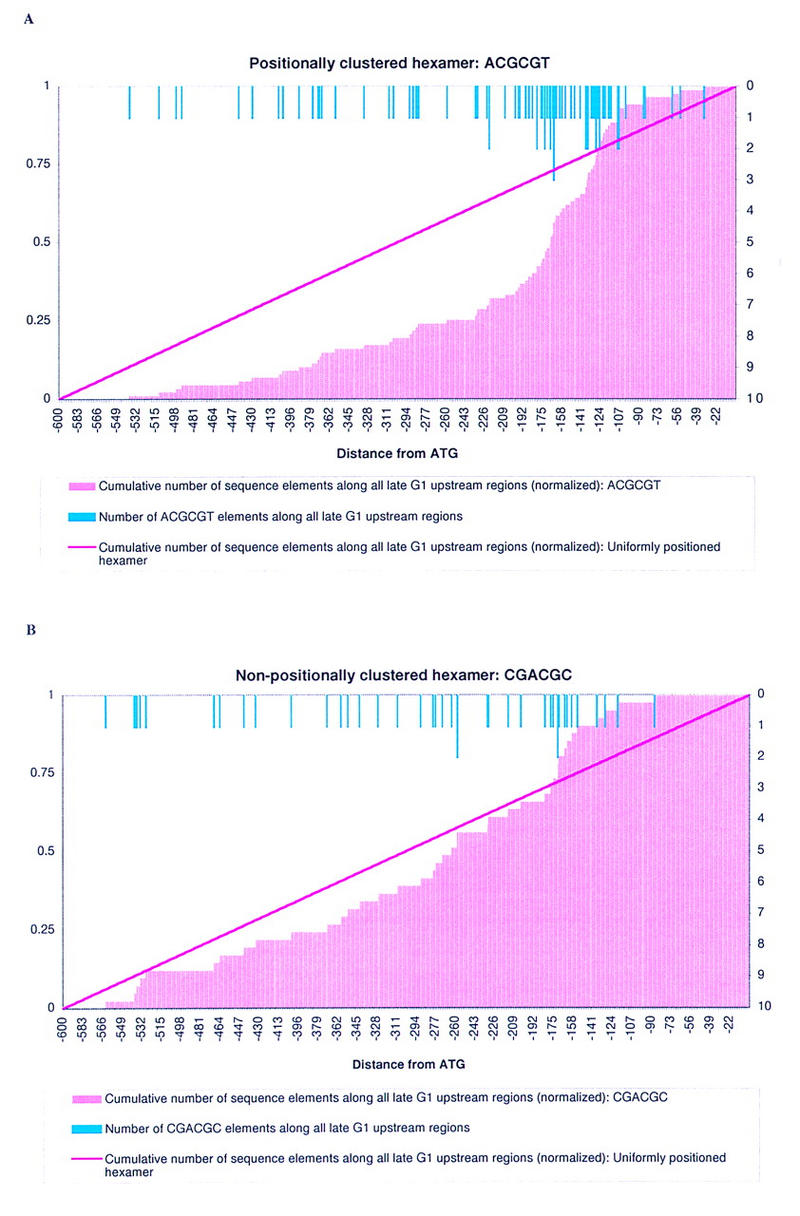
Test for clustered pentamers or hexamers. The light blue lines at the top represents the position of the sequence element along all upstream regions in a given data set—in this case, late G1. The scale for these blue lines is along the right axis; the scale for all other lines is along the left axis. The pink histogram is a cumulative representation of the light blue lines, i.e., it shows the (normalized) cumulative number of oligomers present at that position. The dark pink line is the expected (normalized) cumulative number of sequence elements at that position, if the element is not clustered along the upstream region. Both elements ACGCGT and CGACGC are over-represented in late G1 (Table 1). The two overlapping pentamers that make up ACGCGT, ACGCG, and CGCGT are both over-represented in late G1 in the interval from −104 to −202 nucleotides upstream of the ATG start codon (Table 2). One of the two pentamers that makes up CGACGC, GACGC, is also over-represented in late G1 in the interval from −104 to −202 nucleotides upstream of the ATG start codon (Table 2). However, although the 87 ACGCGT hexamers are clustered along late G1 upstream regions according to the statistic used here, the 41 CGACGC hexamers are not clustered. Empirically, the ACGCGT hexamers are clustered between ∼−100 and −200 nucleotides upstream of the ATG start codon.
We repeated this test to determine whether any of the other hexamers and pentamers identified above (Tables 1 and 2) are clustered in a particular location within the group of upstream regions in which they were shown to be over-represented. Tables 3 and 4 show the hexamers and pentamers, respectively, whose positioning within a set of upstream regions is statistically significant. Because of space constraints, we do not list the number of elements present at each position in the 600-nucleotide upstream region. Rather, for illustrative purposes, we have tabulated the total number of elements found in 50-nucleotide intervals in a particular data set. The total number of elements found in this method is different from the that presented in Tables 1 and 2; in Tables 1 and 2, the number of upstream regions containing one or more copy of an oligomer are counted, whereas in Tables 3 and 4, each occurrence of an element is counted separately (see Methods).
Table 3.
Position-Dependent Hexamers (Clustered Hexamers)
| A. Hexamers and/or reverse complements |
| B. Hexamers |
 |
We performed a Kolmogorov–Smirnov test on each hexamer listed in Table 1. Shown here are those hexamers whose P-value from this test is ≤0.05. The data set on which we performed the test is listed in the left column. We also counted the number of upstream regions in that data set that contain one or more copies of the hexamer over the 50-nucleotide intervals shown. The interval(s) with the highest numbers is in bold. Intervals are measured by the distance from the ATG start codon.
We find that a total of six hex- amers and/or their reverse complements are clustered among a set of upstream regions (Table 3A). An additional five individual hexamers are also clustered, but these do not represent new binding sites (Table 3B). All clustered hexamers are from late G1, and all show a preference for the interval −101 to −200 from the ATG start codon. Seven pentamers and/or their reverse complements are clustered, as are twelve individual pentamers (Table 4). Four of the late G1 pentamers also tend to be located between −101 and −200. Pentamers assessed in other data sets do not show such an overwhelming preference for one location.
DISCUSSION
Using high-density oligonucleotide arrays, Cho et al. (1998) identified 420 transcripts, of the 6220 ORFs in the S. cerevisiae genome, whose expression is cell cycle regulated. They further divided these transcripts into those whose expression peaks during the early G1, late G1, S, G2, or M phase of the cell cycle. We have developed a statistical method to scan upstream regions for short oligomers that may be involved in the regulation of coexpressed genes. These elements can be position- and orientation-independent or dependent. We have applied this technique to the transcripts identified by Cho et al. (1998) and have produced a list of elements, some new, some identified previously, which are likely responsible for the coordinate regulation of genes during the yeast cell cycle. Although the oligomers themselves may not represent the complete protein-binding sites, they will serve as excellent starting points for future studies of longer, more complex, regulatory sites.
Table 5 presents a composite list of the elements that may be important for cell cycle-dependent transcriptional regulation in yeast. The statistically significant elements with P ≤ 0.05 are marked with an asterisk; unmarked sequences have P ≤ 0.2. To make it easier to identify the potential regulatory sites, we have grouped together pairs of sequences that are reverse complements. We list the pentamers and hexamers separately, even though many may be part of the same binding site, because some pentamers are contained within two or more different hexamers. A total of nine hexamers have P ≤ 0.05, and another four have P ≤ 0.2. Twelve pentamers have P ≤ 0.05; six of these elements are contained within a hexamer. Another 12 pentamers have P ≤ 0.2.
Table 5.
Summary
| A. Hexamers | |||||||||||||||||
| Phase | Hexamer | Aligns with MCB at positions | Contains pentamer | Clustered | |||||||||||||
|---|---|---|---|---|---|---|---|---|---|---|---|---|---|---|---|---|---|
| 4/6 | 5/6 | ||||||||||||||||
| Early | |||||||||||||||||
| G1 | *C | C | C | C | G | C | / | G | C | G | G | G | G | ||||
| C | C | C | C | G | C | ||||||||||||
| A | C | G | C | G | G | / | C | C | G | C | G | T | Y | Y | Y | ||
| Late | |||||||||||||||||
| G1 | *A | C | G | C | G | T | / | A | C | G | C | G | T | Y | Y | Y | Y |
| *A | C | G | C | G | T | Y | Y | Y | Y | ||||||||
| *A | A | C | G | C | G | / | C | G | C | G | T | T | Y | Y | Y | Y | |
| *A | A | C | G | C | G | Y | Y | Y | Y | ||||||||
| *C | G | C | G | T | T | Y | Y | Y | Y | ||||||||
| *C | G | C | G | T | C | / | G | A | C | G | C | G | Y | Y | Y | Y | |
| *G | A | C | G | C | G | Y | Y | Y | Y | ||||||||
| *C | G | C | G | T | C | Y | Y | Y | |||||||||
| *A | C | G | C | G | A | / | T | C | G | C | G | T | Y | Y | Y | Y | |
| *A | C | G | C | G | A | Y | Y | Y | Y | ||||||||
| T | C | G | C | G | T | Y | Y | Y | |||||||||
| *C | G | C | G | T | A | / | T | A | C | G | C | G | Y | Y | Y | Y | |
| *C | G | C | G | A | A | / | T | T | C | G | C | G | Y | Y | Y | ||
| C | G | C | G | A | A | Y | Y | ||||||||||
| *C | G | A | C | G | C | / | G | C | G | T | C | G | Y | Y | |||
| S | C | C | G | T | G | C | / | G | C | A | C | G | G | ||||
| A | G | T | C | A | G | / | C | T | G | A | C | T | |||||
| G2 | *G | A | G | T | C | A | / | T | G | A | C | T | C | ||||
| Early | |||||||||||||||||
| G1, M | C | C | C | T | T | T | Y | ||||||||||
| B. Pentamers | |||||||||||||||||
| Phase | Pentamer | Aligns with MCB at 4/5 positions | Contained within hexamer | Clustered | |||||||||||||
| Early | |||||||||||||||||
| G1 | A | T | A | T | A | / | T | A | T | A | T | Y | |||||
| A | T | A | T | A | Y | ||||||||||||
| G | G | C | C | A | / | T | G | G | C | C | Y | ||||||
| C | C | G | C | G | / | C | G | C | G | G | Y | Y | |||||
| *C | C | C | T | T | Y | ||||||||||||
| T | A | T | A | A | Y | ||||||||||||
| Late | |||||||||||||||||
| G1 | *A | C | G | C | G | / | C | G | C | G | T | Y | Y | Y | |||
| *A | C | G | C | G | Y | Y | Y | ||||||||||
| *C | G | C | G | T | Y | Y | Y | ||||||||||
| *C | G | C | G | A | / | T | C | G | C | G | Y | Y | Y | ||||
| *C | G | C | G | A | Y | Y | Y | ||||||||||
| *T | C | G | C | G | Y | Y | |||||||||||
| *G | A | C | G | C | / | G | C | G | T | C | Y | Y | |||||
| *G | A | C | G | C | Y | Y | |||||||||||
| *G | C | G | T | C | Y | Y | |||||||||||
| *A | A | C | G | C | / | G | C | G | T | T | Y | Y | Y | ||||
| *G | C | G | T | T | Y | Y | Y | ||||||||||
| *A | A | C | G | C | Y | Y | Y | ||||||||||
| *G | C | G | A | A | / | T | T | C | G | C | Y | Y | |||||
| G | C | G | T | A | / | T | A | C | G | C | Y | Y | |||||
| C | G | A | A | A | / | T | T | T | C | G | |||||||
| *A | T | A | A | A | Y | ||||||||||||
| *A | A | T | A | A | Y | ||||||||||||
| T | A | A | C | A | |||||||||||||
| T | A | A | T | A | Y | ||||||||||||
| S | G | C | C | A | C | / | G | T | G | G | C | ||||||
| *A | A | C | A | A | Y | ||||||||||||
| G | T | T | G | G | |||||||||||||
| A | A | A | C | A | Y | ||||||||||||
| M | *A | A | C | C | C | / | G | G | G | T | T | ||||||
| G2, | |||||||||||||||||
| Late G1 | *C | A | G | C | C | / | G | G | C | T | G | Y | |||||
| Many | G | C | C | G | C | / | G | C | G | G | C | ||||||
| *A | C | A | A | A | |||||||||||||
The hexamers listed in Table 5 have a statistically significant distribution independent of their position within an upstream region. Thus, these elements could act at any location within the upstream region. However, we have found that six of them are clustered in a particular region within the set of upstream regions in which they are over-represented (Table 3). This positioning may be important for their function. The pentamers, which were identified as being over-represented in a particular 99-nucleotide upstream interval, are likely to be part of binding sites that function in a position-dependent manner. Furthermore, within a group of coregulated upstream regions, some of the pentamers are clustered in a specific region (Table 4). It is not surprising that only a subset of the position-dependent pentamers is also clustered. The method identifies position-dependent pentamers by counting the number of upstream regions that contain one or more copies of the element; the clustering portion of the method counts all occurrences of the element.
One result of our study is that many of the sequence elements likely function in an orientation-independent manner, that is, they could act when placed on either DNA strand. The over-representation of some orientation-independent elements is due to the number of upstream regions that contain either the oligomer or its reverse complement on one strand, such as GAGTCA/TGACTC in G2 (Table 1A). In other orientation-independent elements, the sequence and its reverse complement are both individually over-represented, such as the pair AACGCG and CGCGTT in late G1 (Table 1B). In contrast, elements in which only one of the two elements is statistically significant, such as CCCTT in early G1, may function in an orientation-dependent fashion, with the sequence CCCTT being on the coding strand (Table 1B).
An important validation of our method is the fact that one of the oligomers on our list has been identified previously as being involved in cell cycle-dependent gene regulation. The transcription factor complex MBF, a heterodimeric complex composed of Mbp1p and Swi6p, binds to the consensus sequence ACGCGT, the MCB (for review, see McIntosh 1993; Koch and Nasmyth 1994). It has been shown that this sequence is present upstream of many genes involved in DNA synthesis and repair that are regulated at the late G1/early S transition (for review, see McIntosh 1993). This palindromic sequence is the highest scoring hexamer by our methods, and our analysis supports the idea that it functions during late G1 (Table 1). The element occurs in 49% of late G1-upstream regions, and, in 65% of these upstream regions, it is located between −101 and −200 from the start codon. It is also present in 22% of the upstream regions from S phase. Furthermore, 29% of the late G1 upstream regions that contain the MCB element contain two or more copies of it (not shown). This result correlates with the experimental observations that increasing the number of MCB sequences in a gene upstream region leads to a higher rate of transcription of the gene (McIntosh 1993).
It is striking that the highest scoring elements are all variants of the MCB sequence, ACGCGT, are all over-represented in late G1, and, to some extent, in S, and most are located between 100 and 200 nucleotides upstream of the ATG start codon. Table 5 documents the amount of similarity that the elements share with MCB. All seven of the late G1 hexamers with a P ≤ 0.05 are identical to MCB at four of six positions, and five are identical at five of six positions. Of the seven late G1 pentamers with P ≤ 0.05, four overlap with MCB at four of five positions. Furthermore, all of the MCB-like pentamers were identified because they are over-represented in the interval between −202 and −104 (Table 2), and all of the MCB-like pentamers and hexamers are clustered in the same region (Tables 3 and 4). MCB and the related sequences are thus different from other yeast upstream-activating sequences, as most elements function at variable distances from the mRNA start site (Struhl 1995; Kunzler et al. 1996). The positioning of the MCB-like sequences is likely important for their function.
Some elements, such as AACGCG and CGCGTC clearly overlap with MCB, but the sequence ACGCGA may represent a novel binding site. Although it is tempting to create a longer MCB-like consensus sequence by combining overlapping sequences, this procedure is not sound. The heptamers AACGCGA/TCGCGTT, AACGCGT/ACGCGTT, and ACGCGAA/TTCGCGT can be formed by combining two hexamers listed in Table 1. The over-representation of these heptamers in late G1 upstream regions is statistically significant (not shown). However, the distribution of the heptamers, ACGCGTA/TACGCGT, GACGCGA/TCGCGTC, and TACGCGA/TCGCGTA, also created by merging hexamers from Table 1, is not statistically significant. Thus, it is likely that the sequence context of the pentamers and hexamers plays a role in protein binding. Two sequence elements that activate transcription at the G1/S boundary are SCB (CACGAAA), which is recognized by the Swi4p–Swi6p complex, and MCB, recognized by a Mbp1p–Swi6p complex. The yeast CLN1 upstream region contains three MCB-like sequence elements, ACGCGT, TCGCGA, and CCGCGT. Surprisingly, these elements are bound by Swi4p–Swi6p, not the typical MCB-binding complex of Mbp1p–Swi6p (Partridge et al. 1997). Thus, the MCB-like elements may be part of longer sequences that interact with Mbp1p–Swi6p, Swi4p–Swi6p, or even a novel combination of factors. We plan to analyze the sequences flanking the MCB and MCB-like elements in the future to better classify particular subclasses of binding sites.
One of the major cell cycle control checkpoints in yeast, called Start, occurs during late G1 phase (for review, see Lew et al. 1997). Thus, it is interesting that we find a larger collection of statistically significant sequences upstream of late G1 genes than upstream of other cell cycle-regulated genes. Two-thirds of the elements that may be important for cell cycle control are over-represented in late G1, and all but two of the late G1 elements share sequence similarity, and are over-represented or clustered in the region 100 to 200 nucleotides upstream of the ATG start codon. This finding leads us to speculate that control of transcription during late G1, around the time of Start, is especially important to the cell. However, transcription during other phases may be controlled by a wide range of activities, including the regulation of mRNA stability, which do not necessarily require upstream sequence elements.
Some of the pentamers and hexamers that we have identified are also contained within sequences shown previously to be important for transcription in yeast. As a reference for transcriptionally active yeast sequences, we used the 312 yeast protein-binding sites listed in the TRANSFAC database, version 3.5 (Heinemeyer et al. 1999). Of the 21 hexamers and pentamers with P ≤ 0.05 (Table 5), 17 are contained within one or more TRANSFAC-binding sites. These 119 TRANSFAC entries represent the binding sites for 23 binding factors (Table 6). Two of these binding factor entries, T01094 and T01120, are for MCB, the late G1 transcription factor described above. Another entry, T00096, is for the binding factor SBF, a late G1-specific transcription factor (Koch and Nasmyth 1994). However, this factor binds at least two similar sites, and the one that contains the pentamers and hexamers is not the one cited as the consensus in the literature. A third factor, T00798, is TBP, the TATA-binding protein (Hahn et al. 1989). The pentamers that overlap with the TBP-binding site, ATAAA, AATAA, and ACAAA are over-represented in the interval from −5 to −103 (Table 2), the region in which TBP is active (Struhl 1995; Kunzler et al. 1996). These pentamers could be a part either of the TBP-binding site, or of a different site.
Table 6.
Overlap of Hexamers and Pentamers with Yeast TRANSFAC Entries
 |
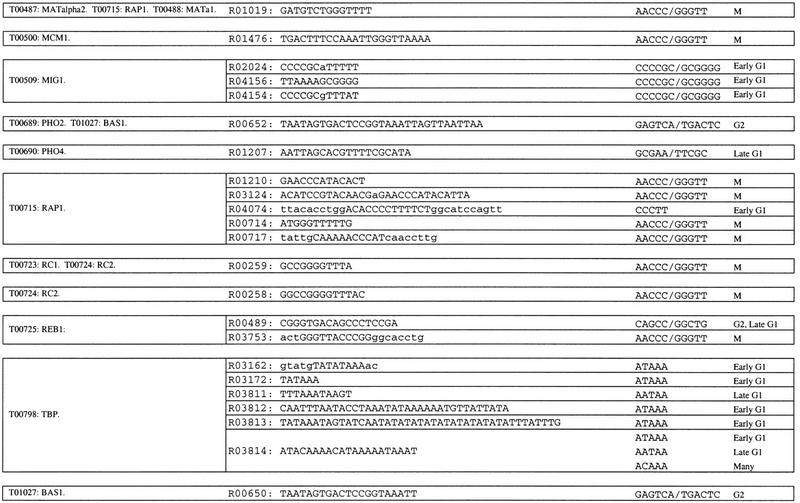 |
Hexamers and pentamers from Tables 1 and 2 with P ≤ 0.05 were compared to the yeast binding site entries in TRANSFAC v. 3.5. All binding sites that contain one or more of the hexamers or pentamers are listed. The binding sites are grouped together by the factors that bind to them, according to the TRANSFAC database.
This method clearly identifies sequence elements that are over-represented in one of the five sets of cell cycle-regulated upstream regions. However, elements that are evenly distributed among the five data sets will not be highlighted. The SCB element, which has the consensus sequence CACGAAA, was identified previously as a regulatory sequence located upstream of genes transcribed in late G1 and early S. SCB is bound by the SBF transcription factor, a complex of Swi4p and Swi6p (for review, see Koch and Nasmyth 1994). Because the two hexamers that compose SCB, CACGAA and ACGAAA, are evenly distributed among all cell cycle-regulated upstream regions, neither is statistically significant by our analysis. A pentamer, CGAAA, that is part of SCB is over-represented in late G1 in the interval −104 to −202, but with P ≤ 0.15. However, CACGAAA may be part of a longer sequence that serves as the SBF-binding site. This longer, yet unidentified sequence may be over-represented in late G1 upstream regions. Some of the late G1 oligomers that we have identified in this study may also be contained within this longer binding sequence.
A second analysis of cell cycle-regulated yeast genes was recently performed by Spellman et al. (1998). These researchers used different technology and methods from those described in Cho et al. (1998), and identified ∼800 genes that are cell cycle regulated. Although this set of 800 genes includes only 304 of the 420 identified by Cho et al. (1998), the cell cycle periodicity described by Cho et al. (1998) has been confirmed in separate clustering experiments (Tamayo et al. 1999). Spellman et al. (1998) searched for potential regulatory elements among groups of coregulated genes by a Gibbs sampling strategy, a different statistical procedure from that used here. They describe ∼15 motifs, some known, some novel, that are found upstream of clusters of coregulated genes. They also identified the MCB site, ACGCGT, upstream of a set of genes whose expression peaks in G1. In the same group of genes, their strategy identified SCB, another late G1 element. One of our late G1 pentamers, GCGAA, is part of a motif they identified in the histone cluster. And the pentamer AACAA that we identified in S phase is part of a regulatory site they predict for their MCM cluster. Other sites do not overlap with those we identified. The discrepancies between our results and those of Spellman et al. (1998) are not surprising. Most important, because of the techniques used to analyze the gene expression data, the lists of coregulated genes are not the same. Furthermore, it appears that many of the motifs they describe are extended consensus sequences for previously identified regulatory binding sites, whereas our analysis is performed with no pre-existing knowledge of the sites. We are currently applying our statistical methods to the coregulated genes described in Spellman et al. (1998), and plan a detailed comparison with the results presented here.
The sequence elements that we have identified are responsible for much of the cell cycle regulation described by Cho et al. (1998). When the elements are analyzed independently, it is clear that none is solely responsible for transcription at a specific time during the cell cycle. The highest scoring element, ACGCGT (MCB), is present in 49% of late G1 upstream regions; the hexamers with P ≤ 0.05 over-represented in early G1 and G2 are found in only 22% and 27% of their respective upstream regions. These frequencies are in agreement with those found by Chu et al. (1998), who looked for sequence elements controlling sporulation in yeast. However, previous work on cell cycle regulation in yeast suggests that more than one sequence element may be responsible for transcription at the same phase (e.g., SCB and MCB both regulate late G1 mRNA expression). Thus, we counted the number of upstream regions that had either one of the statistically significant hexamers (P ≤ 0.05), at any position, or one of the significant pentamers, in the interval specified in Table 2. The results are as follows: 35% of early G1 upstream regions contain one or more of the predicted elements, as do 98% of late G1 upstream regions, 45% of S upstream regions, 27% of G2 upstream regions, and 25% of M upstream regions. Thus, our work predicts that a variety of elements can be responsible for transcription at each phase of the cell cycle. However, other mechanisms, such as differential mRNA stability, may also play a role. We anticipate that the oligomers described here will be used by researchers studying yeast cell cycle gene regulation as a basis for further investigation.
METHODS
Creating a Database of Cell Cycle-Regulated Yeast Upstream Regions
We have created a database of all yeast upstream region sequences (T.G. Wolfsberg and D. Landsman, unpubl.) after extracting information present in YPD (Hodges et al. 1999) and MIPS (Mewes et al. 1999) as of February, 1997. This database contains the sequence 600 nucleotides upstream of each ATG start codon. We identified all ORFs that were annotated in both yeast databases. We then extracted the sequence 600 nucleotides upstream of each of these ORFs from the MIPS version of the yeast genome sequence. All upstream region sequences are oriented in the direction in which transcription occurs, with the start of the sequence at −600 and the end of the sequence at −1 with respect to the ATG start codon.
Cho et al. (1998) have carried out a comprehensive analysis of cell cycle-regulated transcription in yeast. We used the results of their work to create five data sets that contain the upstream region sequences of genes whose transcription is induced in one phase of the cell cycle. The data sets are defined as follows: early G1; 63 upstream regions; late G1; 134 upstream regions; S; 74 upstream regions; G2; 56 upstream regions; M; 56 upstream regions.
Assessing Nonrandom Representation of Short Sequences Within the Cell Cycle-Regulated Yeast Upstream Regions
Our search for oligomers responsible for cell cycle-dependent regulation was made on the basis of the following hypothesis. If a short sequence is responsible for gene regulation in a specific phase of the cell cycle, it should be over-represented among the corresponding upstream regions, relative to other cell cycle-regulated upstream regions. Moreover, any short subsequences contained in it should also be over-represented. As a hypothetical example, if the sequence element AGGCATTC were responsible for gene regulation specifically in late G1, it should be over-represented in late G1 upstream regions, relative to upstream regions specific to the other cell cycle phases. Moreover, AGGCATTC is composed of three shorter hexamers, AGGCAT, GGCATT, and GCATTC, they also should be similarly over-represented in late G1 upstream regions.
Thus, we were interested in identifying short DNA oligomers that are over-represented in upstream regions specific to a particular phase of the cell cycle, relative to other cell cycle-regulated upstream regions. We therefore wished to apply statistical tests for this over-representation. Most available statistical tests, for example, Gibbs sampling, representation ratios, z-scores, etc., assume a statistical parent population in which random DNA bases are generated by a Markov model, or perhaps independently. The model becomes part of what is being tested statistically, which is undesirable. We therefore developed a statistical test whose parent population represents real DNA, so that in principle, before the experiments were performed, samples from the parent population were possible experimental outcomes.
Our actual data set consisted of 383 cell cycle-regulated upstream regions (nucleotides −1 to −600), divided into five classes corresponding to early G1 (63 genes), late G1 (134 genes), S (74 genes), G2 (56 genes), and M (56 genes). If only these numbers are known, before the experimental results classify these 383-upstream regions, every classification into early G1 (63 genes), late G1 (134 genes), S (74 genes), G2 (56 genes), and M (56 genes) is equally likely. The random classifications are the natural parent population for our problem. To sample the parent population, we used Monte Carlo random sampling to create 1000 mock data sets by classifying the 383-upstream regions into the five classes at random. The 1000 mock data sets were an adequate sample for the over-representation tests described next.
Statistical Tests for Orientation-Dependent, Position-Independent Over-Representation
If an oligomer within an upstream region can regulate regardless of its specific position but only in a particular orientation, we call it orientation dependent, position independent. We can test all DNA oligomers of a fixed length for orientation-dependent, position-independent over-representation as follows. (For orientation independence, etc., see below.) Because the over-representation is orientation dependent, each oligomer is considered different from its reverse complement from the other DNA strand (e.g., ACGCGA separately from TCGCGT).
First, in the real data set, count the number of upstream regions in each class that contained the oligomer. (Note: not all upstream regions contain the oligomer, and multiple appearances in the same upstream region are counted only once.) To rank oligomers by non random representation in the five classes, calculate a χ2 score for each oligomer. The χ2 score is defined as
 |
where oi, the observed value, is the number of upstream regions in class i that contain the oligomer, and ei, the expected value, is the number of upstream regions in class i expected to contain the oligomer if the upstream regions had been classified at random.
The χ2 score for each oligomer can then be used to rank the oligomers for over-representation. On one hand, oligomers that are represented in each class according to the expectation have a small χ2 score (i.e., they are randomly represented). On the other hand, oligomers that are over-represented in a class should have a large χ2 score. Over-representation in one class is logically equivalent to under-representation in some other classes. Accordingly, the ith term in the χ2 score for a particular oligomer indicates whether class i deviates from the oligomer’s expected representation; it does not distinguish directly whether the oligomer was over-represented or under-represented. Once statistical significance has been established, however, over-represented classes for an oligomer are easily determined by selecting +he largest terms with oi > ei in the χ2 score.
Each oligomer has now been assigned a χ2 score corresponding to the real data set, so a statistical significance from the 1000 mock data sets can then be calculated as follows. In each mock data set, calculate the χ2 score for each oligomer as above. Find the largest χ2 score from each of the 1000 mock data sets, and then sort these 1000 numbers. For any particular P value, find the 1000 × Pth largest χ2 score among these 1000 numbers. For the standard P = 0.05, for example, find the fiftieth largest (to avoid missing biologically interesting oligomers, we also used P = 0.2, corresponding to the two-hundredth largest). This cutoff has a direct interpretation: For any oligomer, a χ2 score larger than the cutoff occurs only 5% of the time in a random data set. The cutoff therefore provides a statistical test at the P = 0.05 level of significance. This statistical test automatically accounts for multiple testing, as it must, because all oligomers of a fixed length have been tested.
Under the random classification of the mock data sets, the χ2 score for each oligomer approximately follows a χ2 distribution with (D = 4 = 5 − 1) degrees of freedom, as long as the expected number in each class satisfies ei ≥ 5. Thus, of two oligomers, if one is overall more frequent within cell cycle-regulated upstream regions (i.e., in the aggregate of all five classes), the two χ2 scores have the same distribution in the absence of any systematic over-representation. Thus, in examining over-representation, the χ2 score has a very desirable feature: It is insensitive to the overall frequency of the corresponding oligomer.
As mentioned above, under the assumption that the expected number in each class satisfies ei ≥ 5, the χ2 score for individual oligomers follows a χ2 distribution with D = 4 degrees of freedom. By the Bonferroni inequality, because there are N = 4l oligomers of length l, each with a χ2 score, the maximum χ2 score satisfies P(max χ2 ≥ x) ≤ N P(χ2 ≥ x). The right side P(χ2 ≥ x) is a standard χ2 tail probability and is available from a function built into Microsoft Excel. Our results indicate that the simple approximation P(max χ2 ≥ x) ≈ N P(χ2 ≥ x) holds for probabilities up to ∼P = 0.05. Above P = 0.05, however, P(max χ2 ≥ x) and N P(χ2 ≥ x) diverge as they become larger, making the P values from the χ2 statistical test too conservative. Thus, in the absence of any theoretical reassurance, the stringent estimation of P(max χ2 ≥ x) does require the mock data sets.
Recall that frequency insensitivity requires every class to have an expected number ei ≥ 5. This restriction places an upper limit on the choice of the length l of the oligomers. The oligomers should not be so long that they appear infrequently (ei < 5) in five classes of 383 upstream regions, each of length 600. On the other hand, they should not be so short that they appear in almost every upstream region of length 600. Because 600 ≤ 4l ≤ 383 × 600/5, giving 5 ≤ l ≤ 6. We considered using pentamers (l = 5) instead of hexamers (l = 6), but upstream regions of length 600 contain too large a fraction of the 45 = 1024 possible pentamers. Thus, theory indicates orientation-dependent, position-independent over-representation can be tested with hexamers, and we did so. There are N = 46 = 4096 hexamers.
The theoretical considerations above were borne out empirically by testing with pentamers and heptamers, which proved less effective than hexamers (data not shown). Additionally, it is interesting to note that many statistical surveys on DNA have been made on the basis of hexamers. Hutchinson (1996) used hexamer distributions to predict the location of upstream region and nonpromoter sequences in vertebrate DNA sequences. Fujibuchi and Kanehisa (1997) used a hexamer search as a basis for discriminating upstream regions of housekeeping genes from those of tissue-specific ones. Recently, van Helden et al. (1998) identified potential regulatory oligomers from groups of coregulated yeast genes using the theory of over-represented hexamers.
Many variants on our test are feasible. For example, we considered sampling our 1000 mock data sets from a sixth class, a control consisting of upstream regions that are not cell cycle regulated. We also considered adding an extra term in the χ2 score to correspond to this sixth class. No feasible variant on the test described above, however, produced significant differences from the results presented.
Statistical Tests for Orientation-Independent, Position-Independent Over-Representation
If an oligomer within an upstream region can regulate, regardless of its position and orientation, we call it orientation-independent, position-independent. Because the over-representation is now orientation independent, each oligomer is considered the same as its reverse complement from the other DNA strand (e.g., ACGCGA is now the same as TCGCGT). For reasons similar to those given above, we tested orientation-independent, position-independent over-representation with hexamers (l = 6). Because of palindromes, there are N = 1/2 (46 + 43) = 2080 distinct pairs of hexamers and reverse complements. For a given pair, we now count upstream regions that contain either member of the pair. Otherwise, all statistical calculations were carried out as described above for orientation-dependent, position-independent over-representation.
Statistical Tests for Orientation-Dependent, Position-Dependent Over-Representation
If an oligomer within an upstream region can regulate, but only in a particular position and particular orientation, we call it orientation dependent, position dependent. Because the over representation is now orientation dependent, each oligomer is considered different from its reverse complement from the other DNA strand (e.g., ACGCG is different from CGCGT). For the same theoretical reasons that led to hexamers (l = 6) above, this analysis was done with pentamers (l = 5). There are N = 45 = 1024 pentamers.
To detect orientation-dependent, position-dependent over-representation, we divided each upstream region into six nonoverlapping subsequences, numbered with respect to the ATG start codon: −1 to −103, −104 to −202, −203 to −301, −302 to −400, −401 to −499, and −500 to −598. This division should increase statistical power when searching for position-dependent upstream region elements, although it does suffer from inevitable difficulties with edge effects at the ends of the subsequences. Conceptually, for the purposes of statistical testing, each of the 6 subsequences is a set of 99 pentamers. The upstream region subsequences therefore give 383 × 6 = 2298 different sets of pentamers, falling into 5 × 6 = 30 different classes with respect to cell cycle regulation and position.
The statistical computations were carried out as described above for orientation-dependent, position-independent over-representation, with the following exceptions. To sample the parent population, we created the 1000 mock data sets by reclassifying the 2298 different sets of pentamers at random into the 30 different classes. The corresponding χ2 score had 30 terms and d = 29 degrees of freedom. In the Bonferroni inequality, N = 45 = 1024.
Statistical Tests for Orientation-Independent, Position-Dependent Over-Representation
If an oligomer within an upstream region can regulate, regardless of its orientation but only in a particular position, we call it orientation independent, position dependent. Because the over-representation is now orientation independent, each oligomer is considered the same as its reverse complement from the other DNA strand (e.g., ACGCG is now the same as CGCGT). For reasons given above, we tested orientation-independent, position-dependent over-representation with pentamers (l = 5). Because pentamers cannot have reverse complement palindromes, there are N = 1/2 (45) = 512 distinct pairs of pentamers and reverse complements. For a given pair, we now count upstream regions that contain either member of the pair.
Otherwise, to detect orientation-independent, position-dependent over-representation, we proceeded as described above for orientation-dependent, position-dependent over-representation, with upstream region subsequences representing 383 × 6 = 2298 different sets of pentamers, falling into 5 × 6 = 30 different classes with respect to cell cycle regulation and position. We created the 1000 mock data sets by reclassifying the 2298 different sets of pentamers at random into the 30 different classes. The corresponding χ2 score had 30 terms and d = 29 degrees of freedom. In the Bonferroni inequality, N = 45 = 512.
The Kolmogorov-Smirnov Test for Assessing Nonuniform Position
We were also interested in determining and/or confirming the position dependence of any of the over-represented oligomers identified above, even if the position dependence was not apparent with the χ2 score. The null hypothesis here is that if the oligomer has no position dependence, it will be uniformly positioned along the upstream region. There is a standard method to assess the uniformity of oligomer placement. We performed this analysis only if an oligomer had been statistically significant with P ≤ 0.2 under the previous tests, and we tested its position dependence only in the upstream regions in which it was over-represented. To perform the Kolmogorov-Smirnov test, at each position from −1 to −600, we counted the number of occurrences of the oligomer. We then converted this to a cumulative score at each position giving the number of counts at the position or prior to it. The cumulative scores were then normalized by dividing by the total number of counts. The normalized cumulative score was then compared with the expected cumulative score corresponding to a uniform distribution of that oligomer across the range −1 to −600. Thus, we calculated
 |
where F0(X) is the theoretical cumulative distribution, and SN(X) is the cumulative distribution of the observed values. The statistical significance of D was determined by first calculating it from a formula (Kendall and Stuart 1979), and then multiplying the resulting number by the number of independent Kolmogorov-Smirnov tests performed (55 in this analysis) to account for multiple testing. The test detects when an oligomer deviates from uniform random placement. However, it does not indicate which are the intervals of over- or under-representation.
Acknowledgments
We thank Jo McEntyre and Francis Ouellette for a critical reading of the manuscript.
The publication costs of this article were defrayed in part by payment of page charges. This article must therefore be hereby marked “advertisement” in accordance with 18 USC section 1734 solely to indicate this fact.
Footnotes
E-MAIL landsman@ncbi.nlm.nih.gov; FAX (301)435-7794.
REFERENCES
- Brazma A, Jonassen I, Vilo J, Ukkonen E. Predicting gene regulatory elements in silico on a genomic scale. Genome Res. 1998;8:1202–1215. doi: 10.1101/gr.8.11.1202. [DOI] [PMC free article] [PubMed] [Google Scholar]
- Cho RJ, Campbell MJ, Winzeler EA, Steinmetz L, Conway A, Wodicka L, Wolfsberg TG, Gabrielian AE, Landsman D, Lockhart DJ, Davis RW. A genome-wide transcriptional analysis of the mitotic cell cycle. Mol Cell. 1998;2:65–73. doi: 10.1016/s1097-2765(00)80114-8. [DOI] [PubMed] [Google Scholar]
- Chu S, DeRisi J, Eisen M, Mulholland J, Botstein D, Brown PO, Herskowitz I. The transcriptional program of sporulation in budding yeast. Science. 1998;282:699–705. doi: 10.1126/science.282.5389.699. [DOI] [PubMed] [Google Scholar]
- DeRisi JL, Iyer VR, Brown PO. Exploring the metabolic and genetic control of gene expression on a genomic scale. Science. 1997;278:680–686. doi: 10.1126/science.278.5338.680. [DOI] [PubMed] [Google Scholar]
- Fujibuchi W, Kanehisa M. Prediction of gene expression specificity by promoter sequence patterns. DNA Res. 1997;4:81–90. doi: 10.1093/dnares/4.2.81. [DOI] [PubMed] [Google Scholar]
- Godambe SA, Chaplin DD, Takova T, Read LM, Bellone CJ. A novel cis-acting element required for lipopolysaccharide-induced transcription of the murine interleukin-1 beta gene. Mol Cell Biol. 1995;15:112–119. doi: 10.1128/mcb.15.1.112. [DOI] [PMC free article] [PubMed] [Google Scholar]
- Hahn S, Buratowski S, Sharp PA, Guarente L. Yeast TATA-binding protein TFIID binds to TATA elements with both consensus and nonconsensus DNA sequences. Proc Natl Acad Sci. 1989;86:5718–5722. doi: 10.1073/pnas.86.15.5718. [DOI] [PMC free article] [PubMed] [Google Scholar]
- Heinemeyer T, Chen X, Karas H, Kel AE, Kel OV, Liebich I, Meinhardt T, Reuter I, Schacherer F, Wingender E. Expanding the TRANSFAC database towards an expert system of regulatory molecular mechanisms. Nucleic Acids Res. 1999;27:318–322. doi: 10.1093/nar/27.1.318. [DOI] [PMC free article] [PubMed] [Google Scholar]
- Hodges PE, McKee AHZ, Davis BP, Payne WE, Garrels JI. The yeast proteome database (YPD): A model for the organization and presentation of genome-wide functional data. Nucleic Acids Res. 1999;27:69–73. doi: 10.1093/nar/27.1.69. [DOI] [PMC free article] [PubMed] [Google Scholar]
- Holstege FC, Jennings EG, Wyrick JJ, Lee TI, Hengartner CJ, Green MR, Golub TR, Lander ES, Young RA. Dissecting the regulatory circuitry of a eukaryotic genome. Cell. 1998;95:717–728. doi: 10.1016/s0092-8674(00)81641-4. [DOI] [PubMed] [Google Scholar]
- Hutchinson GB. The prediction of vertebrate promoter regions using differential hexamer frequency analysis. Comput Appl Biosci. 1996;12:391–398. doi: 10.1093/bioinformatics/12.5.391. [DOI] [PubMed] [Google Scholar]
- Kendall M, Stuart A. The advanced theory of statistics. London, UK: Griffin; 1979. [Google Scholar]
- Koch C, Nasmyth K. Cell cycle regulated transcription in yeast. Curr Opin Cell Biol. 1994;6:451–459. doi: 10.1016/0955-0674(94)90039-6. [DOI] [PubMed] [Google Scholar]
- Kunzler M, Springer C, Braus GH. The transcriptional apparatus required for mRNA encoding genes in the yeast Saccharomyces cerevisiae emerges from a jigsaw puzzle of transcription factors. FEMS Microbiol Rev. 1996;19:117–136. doi: 10.1111/j.1574-6976.1996.tb00256.x. [DOI] [PubMed] [Google Scholar]
- Lew DJ, Weinert T, Pringle JR. Cell cycle control in Saccharomyces cerevisiae. In: Pringle JR, Broach JR, Jones EW, editors. The molecular and cellular biology of the yeast Saccharomyces. Vol. 3. Cold Spring Harbor, NY: Cold Spring Harbor Laboratory Press; 1997. pp. 607–695. [Google Scholar]
- McIntosh EM. MCB elements and the regulation of DNA replication genes in yeast. Curr Genet. 1993;24:185–192. doi: 10.1007/BF00351790. [DOI] [PubMed] [Google Scholar]
- Mewes HW, Heumann K, Kaps A, Mayer K, Pfeiffer F, Stocker S, Frishman D. MIPS: A database for genomes and protein sequences. Nucleic Acids Res. 1999;27:44–48. doi: 10.1093/nar/27.1.44. [DOI] [PMC free article] [PubMed] [Google Scholar]
- Moskvina E, Schuller C, Maurer CT, Mager WH, Ruis H. A search in the genome of Saccharomyces cerevisiae for genes regulated via stress response elements. Yeast. 1998;14:1041–1050. doi: 10.1002/(SICI)1097-0061(199808)14:11<1041::AID-YEA296>3.0.CO;2-4. [DOI] [PubMed] [Google Scholar]
- Nolan EM, Cheung TC, Burton DW, Deftos LJ. Transcriptional regulation of the human chromogranin A gene by its 5′ distal regulatory element: Novel effects of orientation, structure, flanking sequences, and position on expression. Mol Cell Endocrinol. 1996;124:51–62. doi: 10.1016/s0303-7207(96)03927-5. [DOI] [PubMed] [Google Scholar]
- Partridge JF, Mikesell GE, Breeden LL. Cell cycle-dependent transcription of CLN1 involves swi4 binding to MCB- like elements. J Biol Chem. 1997;272:9071–9077. doi: 10.1074/jbc.272.14.9071. [DOI] [PubMed] [Google Scholar]
- Pfaff SL, Taylor WL. Xenopus TFIIIA gene transcription is dependent on cis-element positioning and chromatin structure. Mol Cell Biol. 1998;18:3811–3818. doi: 10.1128/mcb.18.7.3811. [DOI] [PMC free article] [PubMed] [Google Scholar]
- Roth FP, Hughes JD, Estep PW, Church GM. Finding DNA regulatory motifs within unaligned noncoding sequences clustered by whole-genome mRNA quantitation. Nat Biotechnol. 1998;16:939–945. doi: 10.1038/nbt1098-939. [DOI] [PubMed] [Google Scholar]
- Schuldiner O, Yanover C, Benvenisty N. Computer analysis of the entire budding yeast genome for putative targets of the GCN4 transcription factor. Curr Genet. 1998;33:16–20. doi: 10.1007/s002940050303. [DOI] [PubMed] [Google Scholar]
- Spellman PT, Sherlock G, Zhang MQ, Iyer VR, Anders K, Eisen MB, Brown PO, Botstein D, Futcher B. Comprehensive identification of cell cycle-regulated genes of the yeast Saccharomyces cerevisiae by microarray hybridization. Mol Biol Cell. 1998;9:3273–3297. doi: 10.1091/mbc.9.12.3273. [DOI] [PMC free article] [PubMed] [Google Scholar]
- Struhl K. Yeast transcriptional regulatory mechanisms. Annu Rev Genet. 1995;29:651–674. doi: 10.1146/annurev.ge.29.120195.003251. [DOI] [PubMed] [Google Scholar]
- Tamayo P, Slonim D, Mesirov J, Zhu Q, Kitareewan S, Dmitrovsky E, Lander ES, Golub TR. Interpreting patterns of gene expression with self-organizing maps: Methods and application to hematopoietic differentiation. Proc Natl Acad Sci. 1999;96:2907–2912. doi: 10.1073/pnas.96.6.2907. [DOI] [PMC free article] [PubMed] [Google Scholar]
- Treger JM, Schmitt AP, Simon JR, McEntee K. Transcriptional factor mutations reveal regulatory complexities of heat shock and newly identified stress genes in Saccharomyces cerevisiae. J Biol Chem. 1998;273:26875–26879. doi: 10.1074/jbc.273.41.26875. [DOI] [PubMed] [Google Scholar]
- van Helden J, Andre B, Collado-Vides J. Extracting regulatory sites from the upstream region of yeast genes by computational analysis of oligonucleotide frequencies. J Mol Biol. 1998;281:827–842. doi: 10.1006/jmbi.1998.1947. [DOI] [PubMed] [Google Scholar]
- Wodicka L, Dong H, Mittmann M, Ho MH, Lockhart DJ. Genome-wide expression monitoring in Saccharomyces cerevisiae. Nat Biotechnol. 1997;15:1359–1367. doi: 10.1038/nbt1297-1359. [DOI] [PubMed] [Google Scholar]