

Abstract
The rice blast fungus Magnaporthe grisea is a highly destructive plant pathogen and one of the most important for studying various aspects of host-plant interactions. It has been widely adopted as a model organism because it is ideally suited for genetic and biological studies. To facilitate map-based cloning, chromosome walking, and genome organization studies of M. grisea, a complete physical map of chromosome 7 was constructed using a large-insert (130 kb) bacterial artificial chromosome (BAC) library. Using 147 chromosome 7-specific single-copy BAC clones and 20 RFLP markers on chromosome 7, 625 BAC clones were identified by hybridization. BAC clones were digested with HindIII, and fragments were size separated on analytical agarose gels to create DNA fingerprints. Hybridization contigs were constructed using a random cost algorithm, whereas fingerprinting contigs were constructed using the software package FPC. Results from both methods were generally in agreement, but numerous anomalies were observed. The combined data produced five robust anchored contigs after gap closure by chromosomal walking. The genetic and physical maps agreed closely. The final physical map was estimated to cover >95% of the 4.2 Mb of chromosome 7. Based on the contig maps, a minimum BAC tile containing 42 BAC clones was created, and organization of repetitive elements and expressed genes of the chromosome was investigated.
Rice (Oryza sativa) is the food staple of one half of the world’s population. Therefore, diseases of rice are of special concern. The rice blast fungus Magnaporthe grisea is one of the most devastating diseases of rice everywhere this cereal is grown (Ou 1985). All aerial parts of the plant can be infected; however, yield losses are most severe when the fungus infects and kills the stem below the developing grain head (panicle). Periodically, the disease is responsible for severe regional food shortages causing considerable human suffering.
The fungus is a haploid, heterothallic Ascomycete (Rossman et al. 1990), and highly fertile laboratory strains have been developed (Valent et al. 1986; Kolmer and Ellingboe 1988; Chao and Ellingboe 1991). It has a relatively small genome size ranging from 40 Mb to 50 Mb, which allows for easy separation of almost all of its 7 chromosomes by pulsed-field electrophoresis (Romao and Hamer 1992; Skinner et al. 1993; Sweigard et al. 1993). Several laboratories have been involved in the creation of an integrated linkage map, which contains in excess of 200 markers (Nitta et al. 1997). The genome contains several classes of repetitive DNA, including LINE, SINE, and retrotransposon elements (Romao and Hamer 1992; Nitta et al. 1997). The rice blast fungus is readily amenable to genetic and molecular genetic manipulation. These features have provided opportunities for intensive investigations of host and cultivar specificity, insight into the mechanisms regulating the formation of specialized infection cells, appressoria, and other aspects of the pathogenic process. In combination with the ability to manipulate rice, this system has become one of the most important models for studying host–pathogen interactions (Valent and Chumley 1991; Dean 1997; Zhu et al. 1997). To date, several genes controlling the infection process, signal transduction pathways, and recognition of host plants have been identified; however, the vast majority of important genes remain to be discovered (Talbot et al. 1993; Kang et al. 1994; Mitchell and Dean 1995; Sweigard et al. 1995; Xu and Hamer 1996; Zhu et al. 1996; Choi and Dean 1997; Liu and Dean 1997).
A crucial aspect for continued rapid progress in the molecular dissection of the rice blast fungus is the generation of a comprehensive physical map. A complete physical map will greatly facilitate cloning genes by various methods, such as complementation, chromosome walking, screening, or negative genetic selection with an increased success rate of at least threefold (Balding and Torney 1997; Prade et al. 1997). The compression of a redundant physical map to a minimum set of overlapping clones (tiling path) would also provide the basis for anchoring and ordering ESTs. Moreover, the minimum tiling path will provide the framework for sequencing the whole genome of rice blast. Previously, a large-insert (130 kb) bacterial artificial chromosome (BAC) library was constructed using the rice-infecting strain 70-15 (Zhu et al. 1997). This library provides deep coverage (>25 genome equivalents), which is suitable for construction of contig maps and sequence ready contigs of the M. grisea genome.
For constructing physical maps using large-insert libraries, two methods commonly used are hybridization and fingerprinting (Coulson et al. 1988; Sulston et al. 1988; Wang et al. 1994; Marra et al. 1997; Tait et al. 1997). Although these approaches have considerable merit, each has a number of potential deficiencies. Examples of the various pitfalls are presented in the Discussion in relation to our data. Here, we report a robust physical map of chromosome 7 of M. grisea using both hybridization and fingerprinting data. The combined data produced five anchored contigs covering >95% of the 4.2-Mb chromosome. The genetic and physical maps were collinear throughout the entire chromosome. A minimum tiling path containing 42 BAC clones was distilled from the physical maps and used to begin an analysis of the structure and organization of the chromosome. The results revealed that the repetitive elements are not distributed randomly along the chromosome; instead, they tended to be clustered away from the central region. On the other hand, the distribution of genes expressed during both infection and vegetative stages appeared to be more randomly distributed across the entire chromosome.
RESULTS
Strategy to Construct Physical Maps
Our first goal was to reconstruct a contig map of chromosome 7 using BAC clones from our BAC library. Using nonoverlapping single-copy DNA as probes, the colony blot hybridization method would allow the identification of region-specific and bridging clones to close the gaps between the probes, resulting in the construction of hybridization contigs. Thus two nonoverlapping BAC clones in a single-copy chromosome region can be physically linked by common bridging clones. However, in regions populated extensively with repetitive DNA, it is difficult to identify single-copy DNA as hybridization probes, and as such, identifying bridging BAC clones to seal the gaps is more limited. To a considerable extent, the BAC DNA fingerprinting method can overcome this problem because contig assembly is based on shared restriction fragments of BAC clones.
Thus, the strategy devised involved hybridization with chromosome 7-specific BAC clones containing single-copy DNA, hybridization with 20 RFLP markers on chromosome 7, the fingerprinting of all chromosome 7-specific BAC clones identified by hybridization, and contig assembly based on both hybridization and fingerprinting analysis.
Identification of Chromosome 7-Specific BAC Clones
Because repetitive elements can cause significant problems in contig assembly using colony blot hybridization data, a single-copy sublibrary was required. To identify BAC clones containing single-copy DNA, total genomic DNA of strain 70-15 was labeled and used as a probe to hybridize to the arrayed library. Half of the BAC library, equivalent to ∼12× genome coverage, was used. Based on hybridization intensity, 47% (2137 BAC clones) of the clones were considered as containing “single-copy” DNA and rearrayed on to new filters.
Intact chromosomes were separated using a CHEF gel system followed by recovery of chromosome 7 DNA and DNA of the remaining 6 chromosomes. 32P-Labeled DNA probes from chromosome 7 and the pooled remaining chromosomes were sequentially hybridized to the single-copy DNA filters (data not shown). Because chromosomes 7 and 6 migrated closely on the CHEF gel, DNA from chromosome 6 was also used as a probe to hybridize to the same filters. By comparing the three different sets of hybridization data, 147 BAC clones containing single-copy DNA were determined to be chromosome 7 specific. To verify specificity to chromosome 7, several clones were randomly picked from the pool of 147 and probed against CHEF gel-separated chromosomes from M. grisea. All hybridized exclusively to chromosome 7 (data not shown).
Contig Assembly Using Random Cost Algorithm
To identify additional chromosome 7-specific BAC clones, a hybridization without replacement strategy was used (Prade et al. 1997). In the first round of hybridization, six random BAC clones were chosen as probes from the pool of 147 BACs to hybridize to the 12-fold genome coverage library. In the second round, six other random BAC clones were picked from those that were not identified by the previous six BAC probes in the single-copy pool. This procedure was reiterated until all the clones in the pool of 147 BACs were either used as probes or identified by other BAC probes. This resulted in 55 hybridization experiments identifying 585 BAC clones. To achieve maximum coverage, both ends of the 55 BAC clones used were labeled and combined in the same hybridization experiment. On average, each BAC probe identified 24 colonies per hybridization experiment, matching the 12-fold coverage in the library. All chromosome 7 RFLP markers (Nitta et al. 1997) except two telomere markers were used to identify additional BAC clones on chromosome 7. Nineteen of 20 RFLP markers identified 305 BAC clones with an average of 16 per probe; however, marker CH5-58H did not hybridize to any BAC clones even after three repeated colony hybridizations to the library filters with 12-fold coverage. This probe did hybridize strongly to a HindIII fragment on a genomic Southern blot of strain 70-15. When CH5-58H was used to hybridize against the entire BAC library (24-fold coverage), one positively hybridizing BAC clone 15C20 was identified. Fifteen of the 20 RFLP markers did not identify new BAC clones in the 12-fold genome coverage library other than the 585 BAC clones identified previously. The five other markers found an additional 40 BAC clones, thus resulting in a total of 625 chromosome 7-specific BAC clones. As a result of the hybridization experiments, a probe versus hit binary data matrix was generated, in which the BAC clones identified by probes (referred as hits) were arrayed in rows and the probes in columns.
Using a random cost algorithm to analyze the binary matrix resulted in nine contigs with an estimated mean contig size of 467 kb (assuming entire chromosome covered = 4200 kb/9 contigs). The largest contig contained 100 BAC clones, whereas the smallest contained only 13 BAC clones. After redundant clones were removed from contigs to construct the compressed contig map, the physical distance of each contig was estimated based on the average insert size of BAC clones as shown in Figure 1. Assuming 50% overlap between the two adjacent BAC clones in the compressed hybridization contig map (Prade et al. 1997), the total physical length of chromosome 7 was estimated to be ∼4.7 Mb. This is considerably larger than estimated physical length of 4.2 Mb based on CHEF gel analysis by this and other studies (Skinner et al. 1993; Talbot et al. 1993; Orbach et al. 1996). We found subsequently, as described in the section on map construction by combined methods, that two of these contigs covering ∼600 kb were derived from chromosome 6, which accounts for the size overestimate.
Figure 1.
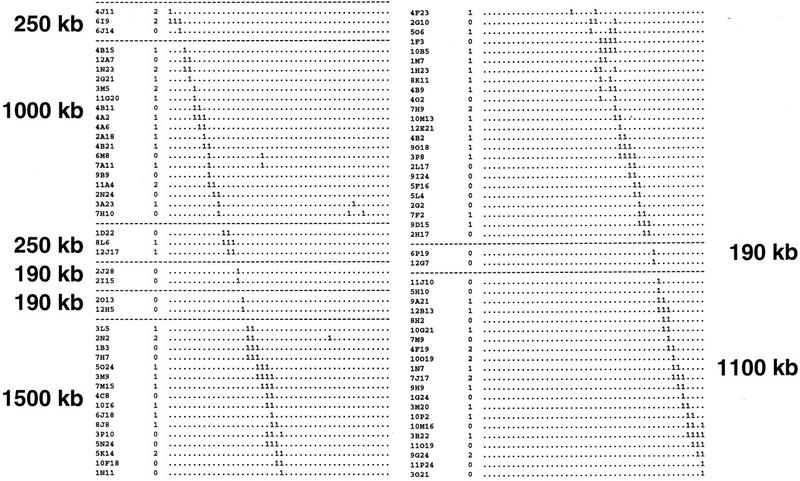
Hybridization contigs. Clone names are given in the margin of the map in their inferred order in the contigs. Probes are assigned to columns. The number of differences in the digital call numbers between BAC clone and the next neighboring BAC clone (the pairwise Hamming distance d, which counts the number of differences between two clones in their digital call numbers or fingerprints) is also given in the margin next to the clone name. The broken horizontal lines indicate the borders of contigs. The estimated size of each contig is shown. Due to space limitations, most of the redundant clones were removed from each contig.
Assembling groups of clones into large contigs is based on identifying common bridging clones identified by neighboring probe clones. Arratia et al. (1991) pointed out that two or more bridging clones should support a link in the hybridization contig maps to avoid false joins due to experimental problems, such as repetitive sequences (Wang et al. 1994). Thirty-one out of 81 links (38%) in our data were supported only by a single clone, with the remaining links supported by more than three bridging clones on average. In regions where genetic markers were localized, only about half of the hybridization contigs were collinear with the genetic data. Furthermore, BAC clones identified by the same probe were often assigned to different contigs. At this point, we felt an independent method for verification was necessary.
Contig Assembly by DNA Fingerprinting
To clarify the physical relationship between BAC clones in the hybridization contigs, all 625 BAC clones were subjected to complete HindIII digestion. After the BAC digests were separated on analytical agarose gels (Methods) followed by staining with SYBR Gold, gel pictures were taken, saved as TIFF files, and transferred to a UNIX workstation. Because 48 samples were run on a single gel with DNA markers in every fifth lane (i.e., Fig. 2), 13 gel files were created. Restriction bands were called using the Image software (Methods). Bands <1 kb were ignored because they were rather diffuse and accounted for <1% of the total length of the BAC inserts. The resulting band files, which contained the relative mobilities of all the restriction fragments derived from the 625 BAC clones, were then transformed into a format used by the FPC software.
Figure 2.
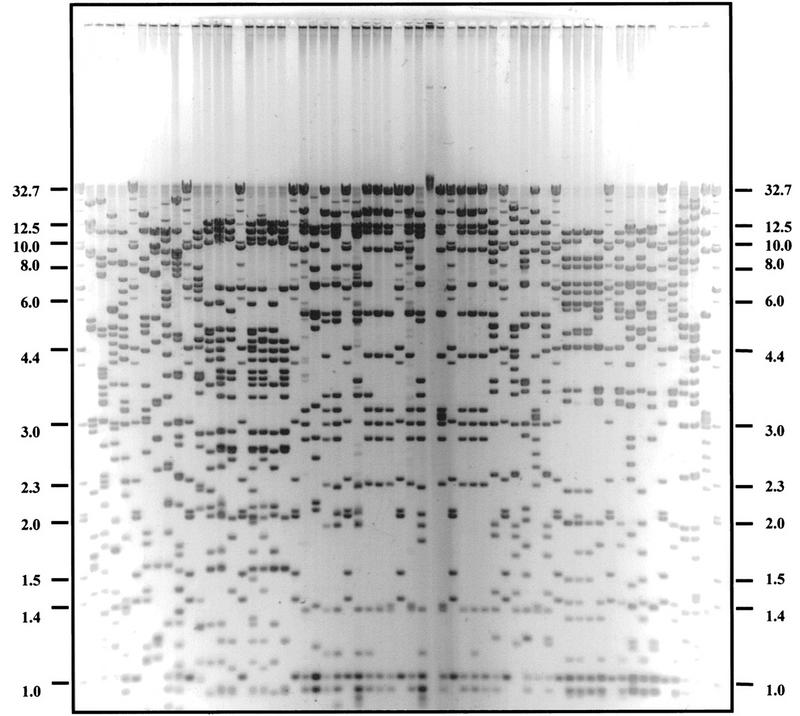
An analytical agarose gel picture of BAC DNA fingerprinting. Gel was stained with SYBR gold and image acquired. Molecular masses of marker lane bands (kb) shown in every fifth lane, from the top, are 32.7, 23.1, 19.0, 15.3, 12.5, 10.0, 9.4, 8.0, 7.0, 6.6, 6.0, 4.4, 4.0, 3.0, 2.3, 2.0, 1.6, 1.4, and 1.0.
Contig assembly was repeated at various cutoff values with a constant tolerance value of 7. At a cutoff value of 10−9, 22 FPC contigs with at least six BAC clones and 30 contigs with less than six BAC clones were obtained. One hundred and eleven BAC clones were not assigned to contigs. When a more stringent cutoff value of 10−10 was used, contig 1 split into two separate contigs. On the other hand, three contigs that were distinct at a cutoff value of 10−9 combined at a cutoff value of 10−8. Because the clone comparison algorithm combined the tolerance with cutoff parameters and the number of matching bands with the number of bands in each clone, we refined the parameters until the algorithm produced results that were consistent with visual inspection of the fingerprints. At a cutoff value of 10−8, the largest contig contained 384 BAC clones, whereas at a cutoff value of 10−9, the largest contig contained only 90 BAC clones. We determined that it was impractical to visually analyze a contig containing >100 clones, so the cutoff value of 10−9 was chosen as our standard. The orders of BAC clones in each FPC contig were refined individually using the consensus band (CB) algorithm (Soderlund et al. 1997). The new orders were then inspected by viewing the fingerprints of the BACs. Final changes were made manually to correct any minor errors. The results showed that 5 of 20 RFLP markers were assigned to five separate contigs, whereas the remainder of the markers were assigned to groups of two or more to the remaining contigs.
Although FPC provided satisfactory contig assembly, the results showed some anomalies. At a cutoff value of 10−9, 111 BAC clones were not assigned to any contigs (singletons). In some cases the order of BAC clones in a contig could not be definitively determined because more than one possible order for contig assembly was inferred. This was largely due to inconsistencies in band calling or partial digestion. Only 4% of BAC fingerprints were considered unscorable. FPC contigs were generally collinear with the genetic data with one exception. RFLP markers CH3-85H and A14C9 were both assigned to FPC contig 1 at a cutoff of 10−9, although this contig split at a lower cutoff value (see below). In addition, BAC clones hybridizing to the same BAC probe were sometimes not assigned to an FPC contig and left as singletons.
Physical Map Construction by Combined Methods and Gap Closure
Because the results indicated that contig assembly using either the hybridization data or fingerprinting data alone exhibited significant deficiencies, the two approaches were combined. When the lists of BAC clones identified by both BAC and RFLP probes were inspected for contig assignment by hybridization and FPC, it was found that 31 of 55 BAC probes generated robust contigs. An FPC contig is defined as robust if it includes the majority of BAC clones identified by at least one particular hybridization probe. All RFLP markers were in robust contigs except RFLP marker CH5-58H, which identified only one BAC clone. The remaining 24 BAC probes identified BAC clones that were assigned to three or more FPC contigs. Those probes and the corresponding clones identified by hybridization (264 clones) were eliminated from further analysis. The remaining 360 BAC clones were assigned to 13 contigs, 9 of which were anchored by the 19 genetic markers (Fig. 3). Eight of the nine anchored contigs were in close agreement with hybridization contigs. However, genetic markers CH3-85H and A14C9 were both located in FPC contig 1 at a cutoff of 10−9, although this was not supported by either the genetic map or hybridization results. When the cutoff value was decreased to 10−10 (i.e., a more stringent condition) using the CB algorithm to refine this contig, a split resulted creating contigs 1A and 1B as was anticipated. Thus, it was reasonable to believe that a false join occurred in the FPC contig 1. Because contig 1 was the first and largest contig assembled by FPC, the program might not assign BAC clones into contigs precisely. As suggested by Soderlund (Soderlund et al. 1997), running the CB algorithm on individual FPC contigs is essential.
Figure 3.

Comparison between hybridization contigs and FPC contigs. (Open bars) The hybridization contigs; (shaded bars) the FPC contigs. The horizontal lines indicate the positions of the genetic markers on chromosome 7 listed from top to bottom, excluding TEL13 and TEL14. RFLP markers are identified by numbers (see Fig. 4 for RFLP marker names—number is given in parentheses). Note that FPC contig anchored by RFLP markers 14 and 20 split under more stringent analysis conditions as indicated by the thick line. Arrows indicate merging of contigs under low-stringent analysis conditions.
When the cutoff value was increased to 10−8, contig 1A merged with contig 6. Furthermore, two of the four unanchored contigs merged with the anchored ones as indicated by arrows in Figure 3. After careful examination of the fingerprints of the clones in the merged regions and the results from chromosome walking, the merges were accepted. As shown in Figure 3, all anchored contigs with more than one RFLP marker were collinear with the genetic map. At this point, two unanchored robust contigs, 240 and 380 kb in length, remained. To determine whether they belonged to chromosome 7, BAC clones randomly picked from both contigs were hybridized to M. grisea chromosomes separated on a CHEF gel. The results showed that both of them should be assigned to chromosome 6 (data not shown). This result was not unexpected because the length of the physical map would have exceeded the previous estimate (Skinner et al. 1993; Talbot et al. 1993) of the size of chromosome 7 by 500 kb and the close proximity of chromosome 7 to chromosome 6 was observed on CHEF gels. The removal of these two contigs resulted in the nine robust contigs for chromosome 7 with eight gaps remaining.
To seal gaps between adjacent contigs, both ends of the outermost BAC clones of each contig were labeled to conduct chromosome walking in the entire BAC library. The fingerprints of identified BAC clones that bridged gaps were further evaluated to confirm the gap closure. This resulted in the closure of four of the eight gaps. The only BAC clone 15C20 identified by RFLP marker CH5-58H was linked through two BAC clones to one end of the contig in which RFLP marker A14C9 was located, indicating that the coverage of this region was far below average. Because of the presence of repetitive elements in the end clones, four gaps could not be sealed by chromosome walking. The final map is shown in Figure 4. Except for two telomere markers, we physically mapped 20 RFLP markers to five contigs covering >95% of the chromosome. Because the two smallest contigs contain only single markers, their orientations remained unresolved.
Figure 4.
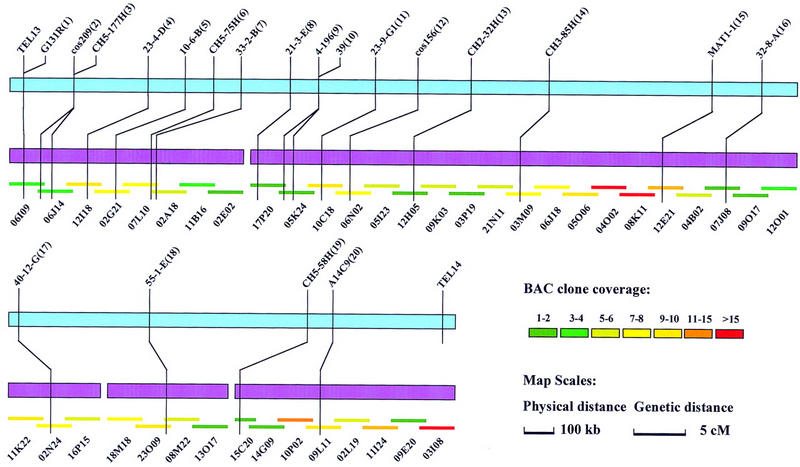
In vitro reconstruction of chromosome 7. After the elimination of 24 probes and 264 hits, hybridization and FPC, and genetic data were in excellent agreement. Eight anchored contigs were merged by chromosome walking into five contigs (purple bars), which covers ∼4.1 Mb of the 4.2-Mb chromosome. The genetic map, shown as the blue bar, is contiguous between the top right and bottom left. The comparison of genetic and physical distance revealed an average value of 41 kb/cM. Ratios varied from 19 to 180 kb/cM. After removal of redundant BAC clones from all the contigs, a minimum tiling path was created as indicated by short overlapping colored lines. The name of each clone is indicated beneath. The interval between each BAC clone is ∼100 kb with ∼30 kb of overlap. The color scale indicates the depth of BAC clone coverage for each region. The coverage ranges from 1 to 24 clones per 100 kb with an average of 7 clones.
Organization of Chromosome 7
To facilitate efficient complementation, chromosome walking, screening, negative genetic selection, and other studies (Balding and Torney 1997; Prade et al. 1997), we deduced a compressed physical map, or minimum tiling path of BAC clones from the physical map. This resulted in the creation of a BAC minimum tile of chromosome 7 containing 42 BAC clones, in which each BAC clone was separated from the next one by ∼100 kb with ∼30 kb of overlap (Fig. 4). Therefore, the final physical map of chromosome 7 containing 20 RFLP markers spanned >4.1 Mb (>95% of the chromosome). Detailed contig maps can be retrieved from our web site: www.genome.clemson.edu. A comparison of genetic and physical distance revealed an average value of 41 kb/cM, which is very close to results obtained in previous studies (Skinner et al. 1993; Sweigard et al. 1993; Nitta et al. 1997). Comparison of genetic versus physical maps (Fig. 4) revealed that at the region near the telomere (i.e., markers G131R and cos209), the ratio between physical and genetic distance was only 19 kb/cM. This elevated recombination activity is expected at the telomere regions. In contrast, the ratio was increased to 180 kb/cM between markers MAT1-1 and CH3-85H.
As a result of the construction of BAC minimum tile of chromosome 7, the depth of coverage of BAC clones along the chromosome was also revealed (Fig. 4). Coverage ranged from 1 to 24 clones per 100 kb with an average of 7 clones per 100 kb, indicating that the clone coverage along chromosome 7 is far from random. Twenty-three of the 42 regions had a lower coverage than the average, and all the gaps were located in those areas. The total number of BAC clones in the five contigs was 289.
To study the distribution of repetitive elements on chromosome 7, 32P-labeled total genomic DNA was used as probe to hybridize against HindIII digested BAC minimum tile (Fig. 5). The results showed that the distribution of repeat DNA was not random because some regions were void of repeats, whereas others contained much repetitive DNA. To further dissect the distribution of individual repetitive elements, the minimum tile blot was rehybridized to five characterized repetitive fragments including the retrotransposon MAGGY (Farman et al. 1996), the invert repeat transposons Pot2 (Kachroo et al. 1994) and MGR586 (Hamer et al. 1989), the Mg-SINE element (Kachroo et al. 1995), and POR6 (Zhu and Zhu 1993). To identify locations of genes expressed at different developmental stages, cDNA probes made from infection and vegetative stages were used to hybridize to the BAC minimum tile. The numbers of HindIII fragments that hybridized to different probes were counted, and the results were summarized in Figure 6. As shown in Figure 6, some regions, including positions 2, 8, 16–18, 20–22, 26, 28, and 40 were found to contain no repetitive elements. It is noteworthy that certain repetitive elements tended to cluster. For example, 28 of 62 HindIII fragments hybridized to POR6 were also identified by MAGGY (data not shown). The distribution of expressed genes was relatively uniform along the chromosome, although certain regions were rich for repetitive elements and expressed genes, such as positions 3, 4, 7, 13, and 27. In some regions (positions 2, 8, 17, 26, and 40) where no repeated DNA was detected, fairly high numbers of HindIII fragments hybridized to cDNA probes from both infection and vegetative stages. Five BAC clones, 12I18, 11B16, 17P20, 05I23, and 12O01, at positions 3, 7, 9, 13, and 27 were found to be rich for genes expressed in both stages.
Figure 5.


BAC minimum tile of chromosome 7. In this minimum tile, each BAC clone overlaps ∼30 kb with the adjacent BAC clones determined by calculating the number of shared HindIII fragments. (A) HindIII restriction digest profile of BAC clones in the minimum tile. (B) The hybridization result of the minimum tile using total labeled genomic DNA from strain 70-15 as a probe.
Figure 6.
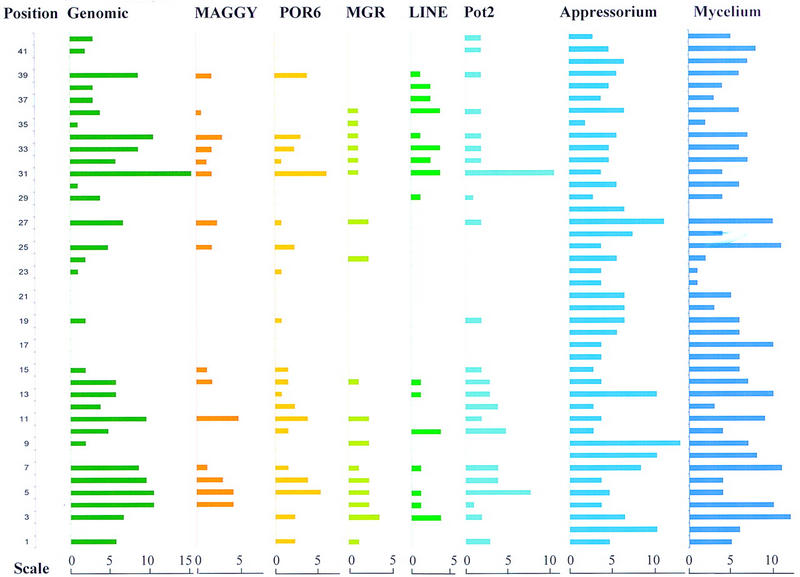
Distribution of repetitive elements and genes expressed during infection and vegetative stages. The HindIII digested BAC minimum tile was hybridized sequentially to cDNA probes from infection and vegetative stages and five previously identified repetitive elements. Genomic indicates total genomic DNA used as probe. The length of bar for each BAC clone represents the number of HindIII fragments hybridizing to each probe as shown by the scale bars. Position indicates the physical position in 100-kb intervals of each BAC clone along the chromosome. The names of BAC clones indicated by position are shown in Fig. 4 from left to right.
DISCUSSION
We have successfully constructed a physical map covering >95% of chromosome 7 of M. grisea by combining two distinct contig assembly approaches, hybridization and fingerprinting. Because chromosome 7 is the smallest chromosome and can be relatively easily separated on CHEF gels, the construction of its physical map was launched as a pilot project toward the completion of a whole physical map of the entire genome.
Hybridization and fingerprinting methods, applied individually, exhibited significant deficiencies in contig assembly. In the hybridization experiments, the intensity of the BAC clones identified by a probe often varied greatly. The variation was thought to be due largely to the degree of overlap between probe and target, or less often due to poor colony growth on the filters. However, weak hybridization signals may have resulted from hybridization to BAC clones containing nonidentical, but similar, DNA. Furthermore, if a fragment within a probe was repeated at different loci, it could also mislead the contig assembly process. Differences in hybridization intensities and repeated DNA fragment could not be accommodated by the random cost program. Instead of analyzing linear hybridization data, the algorithm was often faced with three- or even four-point branches during the contig assembling process. Due to the lack of sensitivity to hybridization intensity, the algorithm used a random process potentially creating false contigs at branching points. Another piece of evidence to support our argument is the overestimation of the physical length of the chromosome based on the hybridization contigs. As described in Results, two robust contigs were found to belong to chromosome 6. Interestingly, the physical distance covered by these two contigs was ∼600 kb, about the extent of the overestimate calculated from the hybridization data. Because one of these contigs was buried in one of the large hybridization contigs, it would have been next to impossible to recognize the error without the FPC analysis. The presence of repetitive elements represents a serious problem for hybridization contig assembly; however, we found that they did not cause obvious problems in FPC analysis. MAGGY is the most abundant and largest repeated element identified in Magnaporthe. The genome of 70-15 contains several hundred copies, five being the most copies found in a BAC clone in chromosome 7. The element itself is ∼5 kb and contains three internal HindIII sites generating internal fragments ∼900 and ∼1000 bp in length and two border fragments of varying size (Nitta et al. 1997). These internal fragments were not scored because they were below our cutoff of 1 kb and thus did not interfere with FPC analysis. In addition, in a 130-kb BAC clone, the unique HindIII fragments bordering the MAGGY elements can be easily identified by hybridization and can provide useful bridging profiles to help assemble regions of BAC clones rich in repetitive elements.
FPC analysis had its own problems, and several anomalies were found. Some BAC clones identified by the same probe were assigned to different FPC contigs or could not be assigned to any contigs (referred as singletons). At the cutoff value of 10−9, 111 BAC clones remained as singletons. This was largely due to partial digestion or contamination during the sample handling. Others remained singletons because they did not share sufficient numbers of overlapping fragments with BAC clones in existing contigs to be incorporated by FPC. Because we were using a 12× genome coverage library, loss of these singletons from the analysis was unlikely to have a major impact on overall contig assembly. It was found that the cutoff value significantly affected the size of the largest contig. For example, the number of clones contained in the largest contig was 384, 90, and 46 at cutoff values of 10−8, 10−9, and 10−10, respectively. The number of singletons exhibited a similar sensitivity to the parameters of the program. Although the CB algorithm allowed us to refine the order of BAC clones within an FPC contig, manual interaction was still required to make the final judgment call in most cases. Without any further information to judge how stringently the data should be processed, it was difficult to assemble a reliable and complete physical map of chromosome 7 using the fingerprinting data alone.
By combining results from both approaches, we were able to rapidly identify those deficiencies and successfully eliminate them. In addition, we were greatly assisted in the contig assembly process by the existence of a dense linkage map (Nitta et al. 1997). During the hybridization and FPC analyses, 24 probes were found to produce most of the anomalies; however, all RFLP markers except one generated robust contigs. These 24 probes may have contained repetitive elements making it necessary to eliminate all clones identified by these probes from further analysis. Although this measure also removed clones belonging to chromosome 7, we were unable to easily identify which clones were legitimate and which were not.
We also learned a valuable lesson during the course of physical map construction. When RFLP marker 21-3-E was first used to identify BAC clones, it hybridized to most of the same BAC clones identified by another RFLP marker, 55-1-E. However, the two markers are >50 cM apart and separated by nine markers used in this study (Fig. 4). We initially interpreted this result as a possible chromosome inversion. Based on this hypothesis, we expected markers 21-3-E and 55-1-E to be very closely linked or to cosegregate in a cross between strain 70-15, from which the BAC library was constructed, and strain 2539. However, linkage analysis showed that they were ∼40 cM apart in a 61-individual F1 population (data not shown). To further investigate this, DNA from the two RFLP markers was reprepared from new clones. This time, marker 21-3-E identified BAC clones in a solid FPC contig containing the expected neighboring RFLP markers 39 and 4-196. Thus, based on our experiences, whenever possible and practical, two or more independent approaches including genetic analysis should be used to obtain reliable and robust results. By applying this principle, we were able to construct with confidence a physical map of a 4.2-Mb chromosome.
A minimum tile containing 42 BAC clones was also determined based on their physical positions in the contigs. Because, on average, ∼25 HindIII bands (>1 kb) were produced by a BAC clone, the distance between two adjacent BAC clones was estimated based on the number of shared bands. Based on the minimum tile, distributions of repetitive DNA and genes were investigated. As found in previous studies in M. grisea (Nitta et al. 1997) and other organisms, such as Aspergillus nidulans (Prade et al. 1997) and Caenorhabditis elegans (The C. elegans Sequencing Consortium 1998), repetitive elements tended to cluster on chromosome 7. It is also noteworthy that in some regions genes and repetitive DNA tended to cluster as well. Because the majority of the repeated DNA belong to transposon-like elements, it is possible that gene-rich regions are more vulnerable to insertion by active transposons during the course of evolution.
As a direct result of the success of this study, the entire BAC library is being fingerprinted and assembled into contigs. The contigs will be anchored to chromosomes by hybridization to all the available genetic markers. ESTs will also be used as hybridization probes to assist with physical map assembly. This will simultaneously map the ESTs. In addition, the end sequences of the BAC clones are being obtained. Because the sequence data will represent ∼18% of the genome, it is expected to reveal a large number of the ∼10,000 genes in the M. grisea genome. The end sequences will act as sequence tag connectors (STCs) and when coupled with the assembled contigs will provide a sequence-ready framework and a physical layout of the organization of a considerable number of genes across the entire genome.
METHODS
DNA Probes and BAC Library
RFLP markers on chromosome 7 were kindly provided by S.A. Leong, University of Wisconsin (Nitta et al. 1997). Markers used in this study are listed as follows: G131R, cos209, CH5-177H, 23-4-D, 10-6-B, CH5-75H, 33-2-B, 21-3-E, 4-196, 39, 23-9-G1, cos156, CH2-32H, CH3-85H, MAT1-1, 32-8-A, 40-12-G, 55-1-E, CH5-58H, and A14C9. The mating-type gene MAT1-1 was PCR amplified from strain 70-15 based on the primers described by Kang et al. (1994). Plasmid clones of Pot2, MAGGY, and MGR586 were kindly provided from Dr. S. Leong. POR6 clones were a gift from Dr. L.-H. Zhu (Zhu and Zhu 1993). A Mg-SINE element was identified in a cDNA clone in our EST project (W. Choi and R.A. Dean, unpubl.). The BAC library of M. grisea was described previously (Zhu et al. 1997).
Preparation of DNA and cDNA
High-molecular-weight DNA from strain 70-15 was isolated according to Orbach et al. (1996). The final concentration of protoplasts imbedded in 1% low-melting-point (LMP) agarose (Bio-Rad) was 1 × 10⁹/ml.
DNA from BAC clones was prepared manually or by an AutoGen 740 robot (AutoGen, Inc.). The manual miniprep of BAC DNA was described previously (Shizuya et al. 1992). In brief, 5 ml of LB broth (Sigma) containing 12.5 mg/ml of chloroamphenicol (Sigma) was inoculated with a single BAC clone followed by growth at 37°C with agitation at 250 rpm for 20 hr. BAC DNA was extracted according to an alkaline lysis method described by Woo et al. (1994). Alternatively, BAC DNA was also prepared using an AutoGen 740 robot according to the manufacturers’ instructions. All DNA was dissolved in 30 μl of 1 mm Tris-HCl buffer (pH 8.0).
RNA was prepared from appressoria and mycelia from the rice-infecting strain 70-15 (Zhu et al. 1996). To prepare appressorium stage cDNA, total RNA was extracted after 4 hr of inoculation of conidia on an inducible hydrophobic surface. At this time, 5%–10% of the conidia were producing appressoria. For mycelium RNA, conidia were inoculated into liquid complete media and allowed to grow for 3 days. RNA was then extracted using standard methods (Sambrook et al. 1989). cDNA used as hybridization probes was prepared using a cDNA synthesis kit from Stratagene.
PFGE
Pulsed-field gel electrophoresis (PFGE) was performed using 0.7% SeaKem LE agarose gels (FMC) in 0.5 × TBE at 14°C using a CHEF-DRII system (Bio-Rad). Switching intervals used were 90 min for 5 days, then 60 min for 2 days, at 1.2 V/cm.
Unidirectional End-Labeling
BAC ends were labeled by the unidirectional PCR method as described previously (Zhu et al. 1997). The two primers used were BACL (5′-TCGACCTGCAGGCATGC-3′) and BACR (5′-GACACTATAGAATACTCAAG-3′). Unidirectional PCR was performed in a 50-μl volume containing reaction buffer (Epicenter), 100 μm each nucleotide (except dCTP; 1 μm), 20 μCi of [α-32P]dCTP (3000 Ci/mmole), 2.5 mm Mg2+, 2 μm primer BACL or BACR, 100 ng of BAC DNA, and 1 unit of Tfl polymerase (Epicenter). Following 5 min at 94°C, 35 cycles of 94°C for 1 min, 52°C for 1 min, and 72°C for 5 min were performed. Reaction products were purified by Sephadex G-50 (Sigma) chromatography and used as probes.
Identification of Chromosome 7-Specific Single-Copy BAC Clones
To identify BAC clones containing only single- or low-copy DNA fragments, total genomic DNA from 70-15 was labeled with [α-32P]dCTP using a random labeling approach (Amersham) and hybridized against colony filters containing 4508 clones (represents >12-fold genome coverage). Those colonies giving visible hybridization signals were considered as containing repeated DNA and were removed from the library. BAC clones (numbering 2137) identified as containing single-copy DNA were rearrayed onto new filters using a BioMek2000 automated workstation (Beckman) (Zhu et al. 1997). To obtain chromosome 7-specific BAC clones, chromosome 7 DNA was separated from the others on a CHEF gel, excised, and recovered with GeneClean (Bio 101), labeled with [α-32P]dCTP (Amersham), and hybridized against the new set of filters. The same filters were then stripped and hybridized to radiolabeled DNA from the remaining chromosomes isolated with the above method.
Restriction Enzyme Digestion
Individual restriction digests consisted of 3.5 μl of ddH2O, 1 μl of 10× buffer E, 1 μl of 10× BSA, 0.5 μl of HindIII (80 U/μl; Promega), and 4 μl of DNA. Restriction digestion was conducted at 37°C for at least 10 hr. After digestion, a brief spin collected the DNA in the bottom of the tube, and 1 μl of 10× loading dye (0.25% bromophenol blue, 0.25% xylene cyanol FF, and 15% Ficoll; Sambrook et al. 1989) was added. Digested BAC DNA was stored at −20°C prior to agarose gel electrophoresis.
Agarose Gel Electrophoresis and Data Collection
Agarose gel electrophoresis was conducted as described by Marra et al. (1997) with some modifications. SeaKem LE agarose (FMC) was used to prepare 1% gels in 1× TAE. For each gel, 150 ml of molten agarose was poured into a 20×25 cm UV transparent tray (Life Technology) resulting in a gel thickness of ∼3.5 mm. A custom-made comb formed 61 wells with the following dimensions: 2 mm wide × 1 mm thick × 3 mm deep. After the comb was removed from the solidified gel, the gel was placed into the electrophoresis unit connected to a buffer recirculating system at 16°C and allowed to cool for at least 30 min prior to sample loading. The buffer was recirculated and chilled in a water bath through 25 feet of Tygon tubing (Tygon LFL 6429-17). In the first and every fifth well thereafter, 1 μl of a standard marker DNA sample was loaded. Marker DNA was a mixture of Hi-Lo DNA marker (Minnesota Molecular) and λ DNA restriction digests in the following proportions: 10 μl of Hi-Lo DNA marker, 5 μl of λ/HindIII (0.1 μg/μl), 1 μl of λ/StuI (0.1 μg/μl), 1 μl of λ/SalI (0.1 μg/μl), 2 μl of 10× loading dye, and 27 μl of H2O. Four microliters of the restriction digestion/loading dye mixture of each sample was loaded into the remaining wells. Samples were separated in Model Horizon 20-25 (Life Technologies) at 90 V for 10 hr at 16°C.
After electrophoresis, the gel was removed to a plastic tray containing 100 ml of a 1:10,000 dilution of SYBR Gold (Molecular Probes) in 1× TAE (pH 8.0) and agitated for 40 min. After staining, a gel picture was taken on a UV box using Polaroid F55 film (Polaroid). The gel images were then scanned on a ScanJet 4C (Hewlett Packard) at 600 dpi and saved as TIFF files. Alternatively, gel images were captured on a Fluor-S MultiImager (Bio-Rad). TIFF files were transferred to a UNIX workstation for band calling and contig assembly.
Computer Analysis
For hybridization experiments, positively hybridizing BAC clones (“hits”) identified by each probe were scored, and a binary matrix of probes versus hits was created. The data matrix was processed using a random cost algorithm program on a UNIX system to create hybridization contigs as described by Wang et al. (1994).
To identify the restriction bands in BAC DNA fingerprints, gel images saved as TIFF files were analyzed by the program Image 3.3 (Sulston et al. 1988, 1989). Bands <1 kb were ignored in the band calling process. A specific marker file was generated to normalize the mobilities of all restriction bands. Band calling data were collected and transferred to the program FPC 3.2 to perform automated contig assembly. Both Image and FPC were downloaded from http://www.sanger.ac.uk/Software (Soderlund et al. 1997). The two major parameters used in FPC contig assembly are tolerance and cutoff values. The term tolerance refers to the relative mobility window size. For example, when tolerance is set at 7, two restriction fragments are considered equivalent if the relative mobilities are within (7 × 0.01) × (average width of two bands) (FPC V3; User’s Manual). The cutoff refers to the Sulston score; the probability that the matching bands are a coincidence. The condition for a noncoincidental overlap between two clones becomes more stringent as the cutoff parameter is lowered. In our FPC analysis, a fixed tolerance of 7 was used based on preliminary investigation, and contig assemblies were performed at different cutoff values ranging from 10−7 to 10−9. To fine-map large contigs created at the cutoff value of either 10−8 or 10−9, the CB algorithm (Soderlund et al. 1997) was used to test the orders of BAC clones in individual contigs with decreased cutoff value of 10−10.
Organization of Repetitive Elements and Expressed Genes
To create a minimum tiling path of chromosome 7, redundant BAC clones were removed from the physical map. The length of the overlapping regions was determined to be ∼30 kb based on the number of shared restriction fragments [i.e. (6 shared fragments/25 fragments in total) × 130 kb = ∼30 kb]. This resulted in the construction of a BAC minimum tile containing 42 BAC clones covering >95% of the chromosome. The 42 BAC clones were digested with HindIII to completion, and DNA was separated on analytical agarose gels, followed by Southern transfer onto nylon membranes. The membranes were hybridized individually with 32P-labeled total genomic DNA, POR6, Mg-SINE, MGR586, MAGGY, Pot2 probes, and two cDNA probes synthesized from appressoria and mycelia. The numbers of HindIII fragments of the 42 BAC clones in the minimum tile hybridized to each probe were recorded.
Acknowledgments
Special thanks are extended to members of the laboratory for helpful discussion during the course of this work. Marco Marra and John McPherson are thanked for their advice and assistance establishing the fingerprinting protocols. Jonathan Arnold is thanked for providing the random cost algorithm program. This is technical contribution No. 4393 of the South Carolina Agricultural Experiment Station. This research was supported in part by National Science Foundation grants IBN951308 and DBI9724557 and Clemson University.
The publication costs of this article were defrayed in part by payment of page charges. This article must therefore be hereby marked “advertisement” in accordance with 18 USC section 1734 solely to indicate this fact.
Footnotes
E-MAIL rdean@clemson.edu; FAX (864) 656-0274.
REFERENCES
- Arratia R, Lander ES, Tavare S, Waterman MS. Genomic mapping by anchoring random clones: A mathematical analysis. Genomics. 1991;11:806–827. doi: 10.1016/0888-7543(91)90004-x. [DOI] [PubMed] [Google Scholar]
- Balding DJ, Torney DC. The design of pooling experiments for screening a clone map. Fungal Genet Biol. 1997;21(3):302–307. doi: 10.1006/fgbi.1997.0985. [DOI] [PubMed] [Google Scholar]
- The C. elegans Sequencing Consortium. Genome sequencing of the nematode C. elegans: A platform for investigating biology. Science. 1998;282:2018–2021. doi: 10.1126/science.282.5396.2012. [DOI] [PubMed] [Google Scholar]
- Chao CT, Ellingboe AH. Selection for mating competence in Magnaporthe grisea pathogenic to rice. Can J Bot. 1991;69:2130–2134. [Google Scholar]
- Choi W-B, Dean RA. The adenylate cyclase gene MAC1 of Magnaporthe grisea controls appressorium formation and other aspects of growth and development. Plant Cell. 1997;9:1973–1983. doi: 10.1105/tpc.9.11.1973. [DOI] [PMC free article] [PubMed] [Google Scholar]
- Coulson A, Waterson R, Kiff J, Sulston J, Kohara Y. Genome linking of yeast artificial chromosomes. Nature. 1988;335:184–186. doi: 10.1038/335184a0. [DOI] [PubMed] [Google Scholar]
- Dean RA. Signal pathways and appressorium morphogenesis. Annu Rev Phytopathol. 1997;35:211–234. doi: 10.1146/annurev.phyto.35.1.211. [DOI] [PubMed] [Google Scholar]
- Farman ML, Tosa Y, Nitta N, Leong SA. MAGGY, a retrotransposon in the genome of the rice blast fungus Magnaporthe grisea. Mol & Gen Genet. 1996;251(6):665–674. doi: 10.1007/BF02174115. [DOI] [PubMed] [Google Scholar]
- Hamer JE, Farrell L, Orbach MJ, Valent BJ, Chumley FG. Host species-specific conservation of a family of repeated DNA sequences in the genome of a fungal plant pathogen. Proc Natl Acad Sci. 1989;86(24):9981–9985. doi: 10.1073/pnas.86.24.9981. [DOI] [PMC free article] [PubMed] [Google Scholar]
- Kachroo P, Leong SA, Chattoo BB. Pot2, an inverted repeat transposon from the rice blast fungus Magnaporthe grisea. Mol & Gen Genet. 1994;245(3):339–348. doi: 10.1007/BF00290114. [DOI] [PubMed] [Google Scholar]
- ————— Mg-SINE: A short interspersed nuclear element from the rice blast fungus, Magnaporthe grisea. Proc Natl Acad Sci. 1995;92(24):11125–11129. doi: 10.1073/pnas.92.24.11125. [DOI] [PMC free article] [PubMed] [Google Scholar]
- Kang S, Sweigard JA, Valent B. Isolation of the mating-type genes of the phytopathogenic fungus Magnaporthe grisea using genomic subtraction. Genetics. 1994;138:289–296. doi: 10.1093/genetics/138.2.289. [DOI] [PMC free article] [PubMed] [Google Scholar]
- ————— The PWL host specificity gene family in the blast fungus Magnaporthe grisea. Mol Plant Microbe Interact. 1995b;8(6):939–948. doi: 10.1094/mpmi-8-0939. [DOI] [PubMed] [Google Scholar]
- Kolmer JA, Ellingboe AH. Genetic relationship between fertility and pathogenicity and virulence in rice blast fungus Magnaporthe grisea. Can J Bot. 1988;66:981–987. [Google Scholar]
- Liu S, Dean RA. G protein α subunit genes control growth, development and pathogenicity of Magnaporthe grisea. Mol Plant Microbe Interact. 1997;10:1075–1086. doi: 10.1094/MPMI.1997.10.9.1075. [DOI] [PubMed] [Google Scholar]
- Marra M, Kubcaba TA, Dietrich NL, Green ED, Brownstein B, Wilson RK, McDonald KM, Hillier LW, McPherson JD, Waterston RH. High throughput fingerprint analysis of large-insert clones: Contig construction and selection of clones for DNA sequencing. Genome Res. 1997;7:1072–1084. doi: 10.1101/gr.7.11.1072. [DOI] [PMC free article] [PubMed] [Google Scholar]
- Mitchell TK, Dean RA. The cAMP-dependent protein kinase catalytic subunit is required for appressorium formation and pathogenicity by the rice blast fungus Magnaporthe grisea. Plant Cell. 1995;7:1869–1878. doi: 10.1105/tpc.7.11.1869. [DOI] [PMC free article] [PubMed] [Google Scholar]
- Nitta N, Farman M, Leong SA. Genomic organization of Magnaporthe grisea: Integration of genetic maps, clustering of transposable elements and identification of genome duplications and rearrangements. Theor Appl Genet. 1997;95:20–32. [Google Scholar]
- Orbach MJ, Chumley FG, Valent B. Electrophoretic karyotype of Magnaporthe grisea pathogens of diverse grasses. Mol Plant Microbe Interact. 1996;9:261–271. [Google Scholar]
- Ou SH. Rice diseases. 2nd ed. Kew, Surrey, UK: Commonwealth Mycological Institute; 1985. [Google Scholar]
- Prade RA, Griffith J, Kochut K, Arnold J, Timberlake WE. In vitro reconstruction of Aspergillus (=Emericella,) nidulans genome. Proc Natl Acad Sci. 1997;94:14564–14569. doi: 10.1073/pnas.94.26.14564. [DOI] [PMC free article] [PubMed] [Google Scholar]
- Romao J, Hamer JE. Genetic organization of a repeated DNA sequence family in the rice blast fungus. Proc Natl Acad Sci. 1992;89:5316–5320. doi: 10.1073/pnas.89.12.5316. [DOI] [PMC free article] [PubMed] [Google Scholar]
- Rossman AY, Howard RJ, Valent B. Pyricularia oryzea, the correct name for the rice blast disease fungus. Mycologia. 1990;82:509–512. [Google Scholar]
- Sambrook J, Fritsch EF, Maniatis T. Molecular Cloning: A Laboratory Manual. 2nd ed. Cold Spring Harbor, NY: Cold Spring Harbor Laboratory Press; 1989. [Google Scholar]
- Shizuya H, Birren B, Kim U-J, Mancino V, Slepak T, Tachiiri Y, Simon M. Cloning and stable maintenance of 300-kilobase-pair fragments of human DNA in Escherichia coli using an F-factor-based vector. Proc Natl Acad Sci. 1992;89:8794–8797. doi: 10.1073/pnas.89.18.8794. [DOI] [PMC free article] [PubMed] [Google Scholar]
- Skinner DJ, Budde AD, Farman ML, Smith JR, Leung H, Leong S. Genome organization of Magnaporthe grisea: Genetic map, electrophoretic karyotype, and occurrence of repeated DNAs. Theor Appl Genet. 1993;87:545–557. doi: 10.1007/BF00221877. [DOI] [PubMed] [Google Scholar]
- Soderlund C, Longden I, Mott R. FPC: A system for building contigs from restriction fingerprinted clones. Comput Appl Biosci. 1997;13:523–526. doi: 10.1093/bioinformatics/13.5.523. [DOI] [PubMed] [Google Scholar]
- Sulston J, Mallett F, Staden R, Durbin R, Horsnell T, Coulson A. Software for genome mapping by fingerprinting techniques. Comput Appl Biosci. 1988;4:125–132. doi: 10.1093/bioinformatics/4.1.125. [DOI] [PubMed] [Google Scholar]
- Sulston J, Mallett F, Durbin R, Horsnell T. Image analysis of restriction enzyme fingerprints autoradiograms. Comput Appl Biosci. 1989;5:101–106. doi: 10.1093/bioinformatics/5.2.101. [DOI] [PubMed] [Google Scholar]
- Sweigard JA, Valent B, Orbach MJ, Walter AM, Rafalski A, Chumley FG. Genetic map of the rice blast fungus. In: O’Brien SJ, editor. Magnaporthe grisea. Genetic Maps. Cold Spring Harbor, NY: Cold Spring Harbor Laboratory Press; 1993. pp. 3.112–3.117. [Google Scholar]
- Sweigard JA, Carroll AM, Kang S, Farrall L, Chumley FG, Valent B. Identification, cloning, and characterization of PWL2, a gene for host species specificity in the rice blast fungus. Plant Cell. 1995;7(8):1221–1233. doi: 10.1105/tpc.7.8.1221. [DOI] [PMC free article] [PubMed] [Google Scholar]
- Tait E, Simon MC, King S, Brown AJ, Gow NA, Shaw DJ. A Candida albicans genome project: Cosmid contigs, physical mapping, and gene isolation. Fungal Genet Biol. 1997;21(3):308–314. doi: 10.1006/fgbi.1997.0983. [DOI] [PubMed] [Google Scholar]
- Talbot NJ, Ebbole DJ, Hamer JE. Identification and characterization of MPG1, a gene involved in pathogenicity from rice blast fungus Magnaporthe grisea. Plant Cell. 1993;5:1575–1590. doi: 10.1105/tpc.5.11.1575. [DOI] [PMC free article] [PubMed] [Google Scholar]
- Valent B, Chumley FG. Molecular genetic analysis of the rice blast fungus, Magnaporthe grisea. Annu Rev Phytopathol. 1991;29:443–467. doi: 10.1146/annurev.py.29.090191.002303. [DOI] [PubMed] [Google Scholar]
- Valent B, Crawford MS, Weaver CG, Chumley FG. Genetic studies of fertility and pathogenicity in Magnaporthe grisea (Pyricularia oryzae) Iowa State J Res. 1986;60:569–594. [Google Scholar]
- Wang Y, Prade RA, Griffith J, Timberlake WE, Arnold J. A fast random cost algorithm for physical mapping. Proc Natl Acad Sci. 1994;91:11094–11098. doi: 10.1073/pnas.91.23.11094. [DOI] [PMC free article] [PubMed] [Google Scholar]
- Woo S-S, Gill BS, Paterson AH, Wing RA. Construction and characterization of a bacterial artificial chromosome library of Sorghum bicolor. Nucleic Acids Res. 1994;22:4922–4931. doi: 10.1093/nar/22.23.4922. [DOI] [PMC free article] [PubMed] [Google Scholar]
- Xu J-R, Hamer JE. MAP kinase and cAMP regulate infection structure formation and pathogenic growth in the rice blast fungus Magnaporthe grisea. Genes & Dev. 1996;10:2696–2706. doi: 10.1101/gad.10.21.2696. [DOI] [PubMed] [Google Scholar]
- Zhu H, Zhu L-H. DNA fingerprinting of the field isolates of the rice blast fungus in east Asia. Mycologia. 1993;5:56–61. [Google Scholar]
- Zhu H, Whitehead DS, Lee Y-H, Dean RA. Genetic analysis of developmental mutants and rapid chromosome mapping of APP1, a gene required for appressorium formation in Magnaporthe grisea. Mol Plant Microbe Interact. 1996;9:767–774. [Google Scholar]
- Zhu H, Choi S, Johnston AK, Wing RA, Dean RA. A large-insert (130 kb) bacterial artificial chromosome library of the rice blast fungus Magnaporthe grisea: Genome analysis, contig assembly, and gene cloning. Fungal Genet Biol. 1997;21:337–347. doi: 10.1006/fgbi.1997.0996. [DOI] [PubMed] [Google Scholar]