

Abstract
MicroRNAs (miRNAs) constitute a new class of regulators of gene expression. Among other actions, miRNAs have been shown to control cell proliferation in development and cancer. However, whether miRNAs regulate hepatocyte proliferation during liver regeneration is unknown. We addressed this question by performing 2/3 partial hepatectomy (2/3 PH) on mice with hepatocyte-specific inactivation of DiGeorge syndrome critical region gene 8 (DGCR8), an essential component of the miRNA processing pathway. Hepatocytes of these mice were miRNA-deficient and exhibited a delay in cell cycle progression involving the G1 to S phase transition. Examination of livers of wildtype mice after 2/3 PH revealed differential expression of a subset of miRNAs, notably an induction of miR-21 and repression of miR-378. We further discovered that miR-21 directly inhibits Btg2, a cell cycle inhibitor that prevents activation of forkhead box M1 (FoxM1), which is essential for DNA synthesis in hepatocytes after 2/3 PH. In addition, we found that miR-378 directly inhibits ornithine decarboxylase (Odc1), which is known to promote DNA synthesis in hepatocytes after 2/3 PH.
Conclusion
Our results show that miRNAs are critical regulators of hepatocyte proliferation during liver regeneration. Because these miRNAs and target gene interactions are conserved, our findings may also be relevant to human liver regeneration.
The adult liver is unique in its intrinsic ability to regenerate through proliferation of fully differentiated cells.1 Adult hepatocytes are quiescent and normally divide only once or twice a year in mice and even less frequently in humans.2 However, adult hepatocytes have the ability to divide numerous times in response to liver tissue injury or loss.3,4 After 2/3 partial hepatectomy (2/3 PH) in mice, hepatocytes enter and progress through the cell cycle in a highly synchronized fashion.5 Every hepatocyte divides once, and every other hepatocyte divides once more to restore the liver mass within 7 days.1 A complex network of cytokine and growth factor signaling between hepatocytes and other liver cell types regulates the hepatocyte cell cycle to ensure that liver regeneration is rapid and robust.6
Although microRNAs (miRNAs) have been shown to posttranscriptionally regulate genes that orchestrate proliferation in development and cancer, their role in organ regeneration is largely unknown. Recent studies in zebrafish have revealed that suppression of miR-1337 or miR-2038 is required for fin regeneration. Zebrafish fin regeneration is mediated by stem cells that are recruited to or originate from dedifferentiation of cells residing in the injured area. In contrast, regeneration of the mammalian liver entails cell cycle entry and division of differentiated hepatocytes. Proliferating hepatocytes remain differentiated and continue to provide liver function.9 Knowing how this unique form of regeneration is regulated might enable its restoration in diseased hepatocytes and recapitulation in other, nonregenerative cell types. Here we describe the results of our analysis of the changes in miRNA expression during mouse liver regeneration, leading to the identification of miR-21 and miR-378 as regulators of organ regeneration.
Materials and Methods
Mice
Dgcr8del/fl, Alb-Cre+/−, and Dgcr8fl/fl mice were generated from matings of Dgcr8del/fl mice on a mixed C57Bl/6, 129S4 background10 with Alb-Cre+/− mice on a C57Bl/6 background (Jackson Laboratory).11,12 Eight to 12-week-old male mice were used in this study. All procedures involving mice were approved by the Institutional Animal Care Committee at the University of California San Francisco.
Two-thirds PH
Two-thirds of the liver was surgically removed under isoflurane anesthesia as described.5 One hundred μg/g body weight 5-bromo-2-deoxyuridine (BrdU, Roche) was injected intraperitoneally 35 hours after surgery.
Quantitative Reverse Transcription-Polymerase Chain Reaction (qRT-PCR)
Total RNA was isolated with Trizol and treated with DNase I (Ambion) to eliminate genomic DNA. One μg RNA was used for cDNA synthesis with Superscript III reverse transcription reagent (Invitrogen). PCR amplification was performed at 50°C for 2 minutes and 95°C for 10 minutes, followed by 40 cycles at 95°C for 15 seconds and 60°C for 1 minute in a 7300 real-time PCR system with SYBR green (Applied Biosystems). For each sample we analyzed β-actin, Gapdh, or 18S rRNA expression to normalize target gene expression. Primers for qRT-PCR were designed with Primer Express software (Applied Biosystems). Dgcr8 primers were designed to target the deleted exon 3. For miRNA analysis, RNA was isolated with the miRNeasy kit (Qiagen). Ten ng RNA was used for miRNA-specific cDNA synthesis with the TaqMan MicroRNA Reverse Transcription Kit and Taqman MicroRNA Assays (all Applied Biosystems). PCR amplification was performed at 95°C for 10 minutes, followed by 40 cycles at 95°C for 15 seconds and 60°C for 1 minute in a 7900 real-time PCR system (Applied Biosystems). The small RNA Sno202 was used to normalize target miRNA expression. Relative changes in gene and miRNA expression were determined using the 2-ΔΔCt method.13
Immunostainings
Paraffin-embedded liver samples were sectioned and stained with the antibodies rabbit anti-Cyclin D (NeoMarkers), mouse anti-PCNA (Bio-source), and rabbit anti-Ki67 (Lab Vision) at 1:100 dilutions. To visualize immunocomplexes for light microscopy with 3,3′-diaminobenzidine (DAB), we used biotinylated antirabbit or antimouse IgG antibodies and the ABC reagent (all Vector). Immunostainings with rat anti-A6 (gift from Dr. Valentina Faktor, NCI), rabbit anti-DGCR8 (Proteintech), and rat anti-BrdU (Abcam) antibodies were performed on sections of frozen liver samples embedded in optimum cutting temperature compound (Tissue-Tek, Sakura Finetek) at 1:250, 1:50, and 1:100 dilution, respectively. For fluorescence microscopy, the secondary antibodies goat antirat conjugated with Alexa Fluor 488, goat antirabbit conjugated with Alexa Fluor 594, and goat antirat conjugated with Alexa Fluor 594 (all Molecular Probes) were used at 1:500 dilutions. Nuclear DNA was stained with 10 μg/mL Hoechst 33342 (Molecular Probes).
Global miRNA Expression Profiling
Eight-week-old male wildtype C57Bl/6 mice (Jackson Laboratory) were used for analysis of miRNA expression changes after 2/3 PH. Liver samples were obtained at 0, 1.5, 6, and 18 hours after surgery. Five mice were analyzed for each timepoint. Total RNA was isolated using Trizol and purified with the miRNeasy mini kit (Qiagen). miRNA expression profiling including labeling, hybridization, scanning, normalization, and data analysis was performed at Exiqon. Profiling was conducted with total RNA with RNA integrity number (RIN) values close to 8 measured with an Agilent 2100 Bioanalyzer. One μg total RNA of each sample and a common reference pool were labeled with Hy3 and Hy5 fluorescent label, respectively, using the miRCURY LNA Array power labeling kit (Exiqon). Hy3-labeled samples and Hy5-labeled common reference pool were mixed pairwise and hybridized to miRCURY LNA arrays v. 9.2 (Exiqon), which have a 61% coverage of the mouse miRNAs listed in miRBase v. 14.0. Hybridization was performed using a Tecan HS4800 hybridization station. Slides were scanned using an Agilent G2565BA Microarray Scanner System and image analysis was carried out with ImaGene 7.0 software (Bio-Discovery). Background correction was performed to remove nonbiological contributions to the measured signal.14 Quantified signals were normalized using the global Lowess (locally weighted scatterplot smoothing) regression algorithm.15 Log2 transformed median Hy3 (sample)/Hy5 (common reference pool) ratios were calculated for each capture probe (present in four replicates on the array). A two-tailed Student’s t test was performed between the samples obtained at 0 hours and the samples obtained at 1.5, 6, and 18 hours after 2/3 PH. Clustering was performed on miRNAs corresponding to capture probes with log2 Hy3/Hy5 ratios which passed filtering criteria of P < 0.001. The heat-map was generated using the Euclidean metric. The log2 median ratio values were standardized by subtracting the mean followed by dividing by the standard deviation.16
miRNA Manipulations for qRT-PCR and Luciferase Assays
miRIDIAN miRNA Mimics or Hairpin Inhibitors (Dharmacon) were introduced into Hepa1,6 mouse hepatoma cells (ATCC) at a final concentration of 20, 40, or 80 nM. Five × 104 cells were plated in 24-well plates (Corning) and transfected using Lipofectamine 2000 (Invitrogen) 24 hours later. Hepa1,6 cells transfected with chemically modified double-stranded or single-stranded oligonucleotides based on the sequence of miR-67 from C. elegans (both Dharmacon) were used as controls for miRNA mimics or inhibitors, respectively. For luciferase assays, cells were cotransfected with 30 ng of the pMIR-REPORT vector (Ambion) modified to contain the B-cell translocation gene 2 (Btg2) or ornithine decarboxylase 1 (Odc1) 3′ untranslated region (UTR) and 30 ng of the pSV-β-Galactosidase Control Vector (Promega) to monitor transfection efficiencies. Twenty-four hours after transfection, luciferase and β-galactosidase activities were measured using the Luciferase Assay System and the Beta-Glo Assay System (both Promega) on a Synergy 2 Microplate Reader (BioTek Instruments). Luciferase activities were normalized to β-galactosidase activities for each well.
Statistical Analysis
Significance was determined with a two-tailed Student’s t test.
Results
To determine the overall impact of miRNAs on liver regeneration, we performed 2/3 PH on mice with global miRNA deficiency specifically in hepatocytes. Mature miRNAs are the product of sequential cleavage of the primary transcript by the RNase III enzymes Drosha and Dicer. Because Dicer is also involved in processing of other small RNAs, we generated mice with hepatocyte-specific inactivation of DGCR8, which together with Drosha forms the microprocessor complex that is specifically required for canonical miRNA biogenesis.17 Mice with hepatocyte-specific miRNA deficiency were viable and developed normally into adulthood. However, whereas miRNA-deficient hepatocytes readily exited the G0 phase of the cell cycle, they failed to transition into S phase by 36 hours after 2/3 PH (Fig. 1A). Despite increased expression of Cyclin D1 (Ccnd1) before 2/3 PH, these cells failed to induce Cyclin A2 (Ccna2) and Cyclin B1 (Ccnb1) expression at 36 hours after 2/3 PH (Fig. 1B). Moreover, other genes or markers specific for DNA synthesis were not activated or detectable in miRNA-deficient hepatocytes (Supporting Information Fig. 1B,C). Interestingly, a subset of the mice showed compensatory expansion of adult liver progenitors, so-called oval cells (Fig. 1A, Supporting Information Fig. 2A). In contrast to hepatocytes, oval cells retained intact DGCR8 and hence miRNA expression, which explains their normal proliferative capabilities (Fig. 1A-D, Supporting Information Fig. 2B).
Fig. 1.
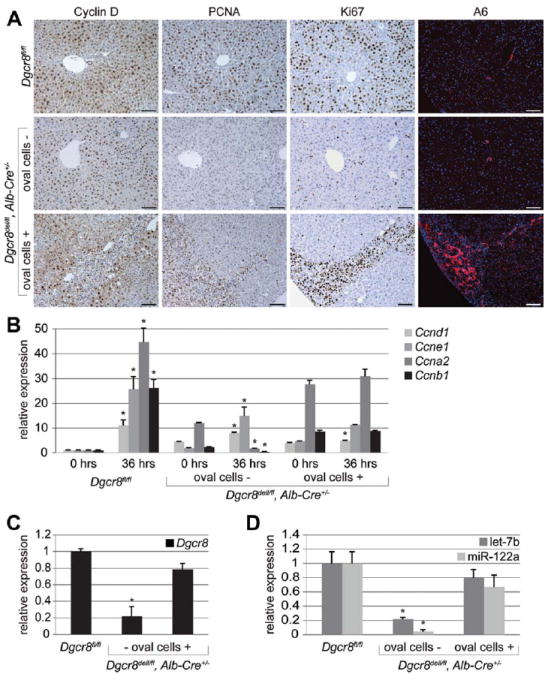
Global miRNA deficiency impairs G1 to S phase progression of hepatocytes after 2/3 PH and is accompanied by proliferation of wild-type oval cells. (A) Representative immunostainings show that hepatocytes lacking DGCR8 expression (hepatocytes of Dgcr8del/fl, Alb-Cre+/− mice) enter the G1 phase of the cell cycle (Cyclin D, brown) but, in contrast to hepatocytes of littermates with intact DGCR8 expression (hepatocytes of Dgcr8fl/fl mice), fail to progress into S phase (PCNA and Ki67, both brown) by 36 hours after 2/3 PH. However, by 72 hours after 2/3 PH hepatocytes of Dgcr8del/fl, Alb-Cre+/− mice progress into S phase and mitosis (Supporting Information Fig. 1A). A subset of Dgcr8del/fl, Alb-Cre+/− mice show proliferating oval cells (A6, red). These cells were detectable before 2/3 PH and retained normal DGCR8 expression (Supporting Information Fig. 2B). Oval cell activation is likely caused by the moderate hepatocyte injury detectable in Dgcr8del/fl, Alb-Cre+/− mice (Supporting Information Fig. 2C). (B) qRT-PCR 36 hours (hrs) after 2/3 PH shows that livers of Dgcr8del/fl, Alb-Cre+/− mice lacking oval cells fail to induce Ccna2 and Ccnb1, cyclins critical for DNA synthesis and mitosis. Livers from Dgcr8del/fl, Alb-Cre+/− mice containing oval cells show blunted induction of Ccna2 and Ccnb1 before and 36 hours after 2/3 PH. The difference in oval cell presence in mice of the same genotype is likely due to variable onset of Cre expression from the synthetic albumin promoter.35 Early Cre expression leads to DGCR8 inactivation in fetal liver progenitors which is inherited by hepatocytes, biliary cells, and oval cells. Cre activation after fetal liver progenitor lineage bifurcation restricts its expression to hepatocytes and leaves DGRC8 expression in oval cells intact. Thus, oval cells retain the ability to proliferate, whereas hepatocytes are negative for PCNA and Ki67 also in these mice at 36 hours after PH. Of note, mRNA levels of Ccnd1 are increased in Dgcr8del/fl, Alb-Cre+/− mice before 2/3 PH. (C) qRT-PCR shows loss of Dgcr8 expression in livers of Dgcr8del/fl, Alb-Cre+/− mice lacking oval cells. Because the synthetic albumin promoter restricts Cre expression to hepatocytes in adult mice, residual Dgcr8 expression in Dgcr8del/fl, Alb-Cre+/− mice lacking oval cells stems mostly from nonhepatocyte liver cell types.12 (D) Hepatocyte-specific Dgcr8 disruption leads to loss of the most abundant miRNAs in the liver, the hepatocyte-specific miR-122a, and, to a lesser extent, the ubiquitously expressed let-7b. miRNAs known to be processed independent of DGCR8 continue to be expressed in livers of Dgcr8del/fl, Alb-Cre+/− mice (Supporting Information Fig. 3A,B).17 Error bars represent ± SEM. *P < 0.005. Scale bars = 100 μm.
To identify miRNAs regulating hepatocyte S phase entry during liver regeneration, we analyzed global miRNA expression during the first 36 hours after 2/3 PH in wildtype mice. Pilot analyses led us to focus on miRNA expression changes during the first 18 hours after 2/3 PH (Supporting Information Table 1 and data not shown). Previous studies showed that many genes are differentially expressed after 2/3 PH.9,18,19 However, using a stringent cutoff of P < 0.001, we found significantly altered expression after 2/3 PH of only 7 of ≈430 mouse miRNAs analyzed (Fig. 2A). Intriguingly, miR-21, a known promoter of proliferation in cancer,20 was most significantly induced. miR-21 peaked at 18 hours after 2/3 PH, that is, after hepatocytes transitioned from G0 into G1 but before they passed the restriction point and entered S phase (Fig. 2B). Recent studies showed that miR-21 is transcriptionally regulated by activation protein 1 (AP-1)21 and signal transducer and activator of transcription 3 (STAT3),22 proteins activated early in liver regeneration.1 Because these and our findings fit well with lack of miR-21 impairing the transition of regenerating hepatocytes from G1 to S phase, we focused our analyses on miR-21.
Fig. 2.
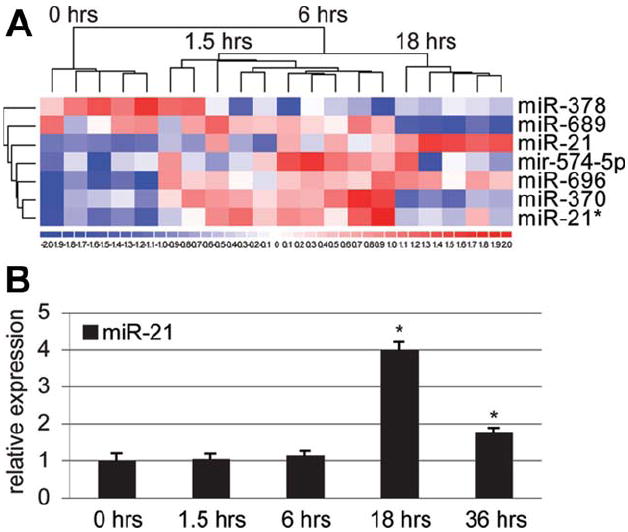
miRNA expression changes in livers of wildtype mice in response to 2/3 PH. (A) Heatmap of the miRNAs that are significantly differentially expressed in livers of wildtype mice during the first 18 hours after 2/3 PH. The miRNA clustering tree is shown on the left and the sample clustering tree appears at the top. The color scale in the bottom illustrates the relative expression level of an miRNA across all samples. Red color represents an expression level above mean, blue color represents expression lower than mean. The clustering is performed on log2 (Hy3/Hy5) ratios that passed the filtering criteria of P < 0.001 (Supporting Information Table 1). (B) qRT-PCR shows that expression of miR-21 peaks at 18 hours after 2/3 PH in wildtype mice. Error bars represent ± SEM. *P < 0.005.
Several target genes of miR-21 were previously reported.20 However, to potentially identify new targets of miR-21 involved in liver regeneration, we chose an unbiased approach. We first used the TargetScan algorithm to identify genes targeted by miR-21 in both mice and humans.23 Focusing on conserved miR-21 targets not only increased the probability of target gene prediction but also assured that our results could be extended to human liver regeneration. We then used the PicTar algorithm to scan the 3′UTR of the conserved miR-21 target genes and eliminate genes with a lower score or free energy (Supporting Information Table 2).24 Our findings of impaired G1 to S phase progression in miRNA-deficient hepatocytes and induction of miR-21 at a time when entry into S phase is negotiated suggested that miR-21 acts to promote liver regeneration. Therefore, among the 63 genes meeting the selection criteria, we focused on 17 genes with established negative effects on proliferation (Supporting Information Table 2). Among these genes were the previously reported miR-21 targets Timp3, Reck, and Pdcd4.20 Potential new miR-21 targets included Tgfbi and Smad7, components of the transforming growth factor β (TGFβ) signaling pathway, which is known to restrict liver regeneration.25 Most interestingly, however, our search retrieved Btg2, a gene restraining G1 to S phase transition that, paradoxically, is induced by 2/3 PH.18 Because Btg2 also had the highest score and free energy of the predicted conserved miR-21 target genes with established proliferation-inhibiting function, we investigated whether it is directly targeted by miR-21 (Supporting Information Fig. 4A, Supporting Information Table 2).
BTG2 inhibits proliferation by interfering with activating phosphorylation of FoxM1.26 FoxM1 is activated after 2/3 PH and its deficiency impairs DNA synthesis and Ccnb1 gene expression in regenerating mouse hepatocytes.26,27 Btg2 was previously reported to be immediately induced and peak at 4 hours after 2/3 PH.18 When we investigated the expression of Btg2 at later stages, we found that it returns to baseline levels between 6 and 18 hours after 2/3 PH. Thus, the expression pattern of Btg2 is the mirror opposite of that of miR-21 (Fig. 3A). Analysis of Dgcr8del/fl, Alb-Cre+/− mice lacking oval cells showed that miR-21 is mainly expressed in hepatocytes in the liver (Fig. 3B). Taken together with the similar nature of the cell cycle defect in hepatocytes with FoxM1 or global miRNA deficiency (Fig. 1A,B), our findings suggested that miR-21 antagonizes Btg2 in regenerating hepatocytes to facilitate efficient cell cycle progression. Indeed, Btg2 messenger RNA (mRNA) levels and activity of a reporter gene linked to its 3′UTR readily responded to miR-21 mimic or inhibitor transfection into well-differentiated mouse hepatoma cells (Fig. 3C). These manipulations also caused induction or suppression of the FoxM1 target gene Ccnb1, respectively (Fig. 3D). We conclude that direct inhibition of Btg2 by miR-21 antagonizes its inhibitory effect on FoxM1 during liver regeneration.
Fig. 3.
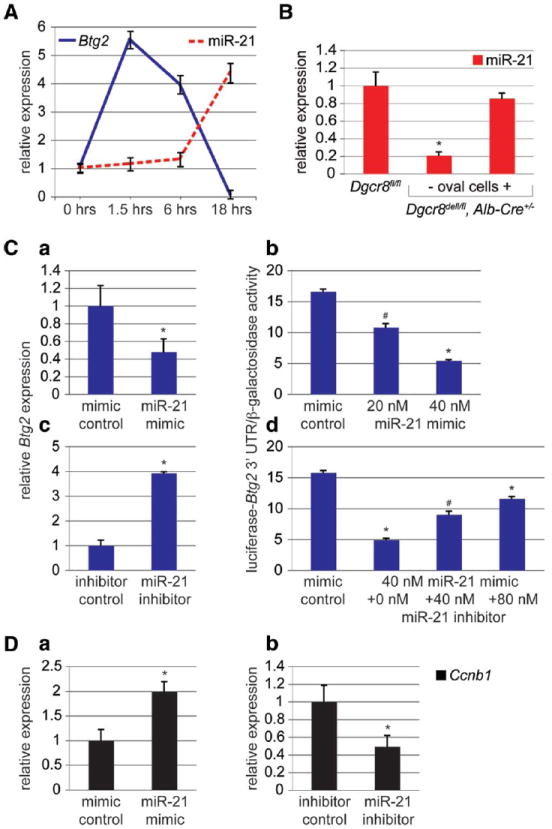
miR-21 directly antagonizes the proliferation-inhibiting gene Btg2 during liver regeneration. (A) qRT-PCR shows inverse correlation of Btg2 and miR-21 expression in the first 18 hours after 2/3 PH. miR-21 expression normalizes by 72 hours after 2/3 PH (Supporting Information Fig. 5A). (B) qRT-PCR shows loss of miR-21 in livers of Dgcr8del/fl, Alb-Cre+/− mice lacking oval cells. Livers of Dgcr8del/fl, Alb-Cre+/− mice containing oval cells have miR-21 levels similar to controls, reflecting the proliferative activity of oval cells. (C) miR-21 mimic transfection into Hepa1,6 cells causes a reduction in Btg2 mRNA levels (a) and dose-dependent inhibition of the activity of a luciferase reporter gene linked to the 3′UTR of Btg2 (b). Conversely, miR-21 inhibitor transfection into Hepa1,6 cells causes an increase in Btg2 mRNA levels (c). Furthermore, miR-21 inhibitor transfection antagonizes the inhibitory binding of miR-21 mimics to the 3′UTR of Btg2 (d). (D) Levels of Ccnb1 mRNA are increased after miR-21 mimic (a) and decreased after mir-21 inhibitor (b) transfection into Hepa1,6 cells. Error bars represent ± SEM. * P < 0.005. #P < 0.05.
Another miRNA significantly altered in response to 2/3 PH was miR-378 (Fig. 2A). In contrast to miR-21, miR-378 expression declined after 2/3 PH, suggesting that it might inhibit a proliferation-promoting gene (Fig. 4A). Loss of miR-378 expression in livers of Dgcr8del/fl, Alb-Cre+/− mice lacking oval cells indicated that it functions predominantly in hepatocytes in the liver (Fig. 4B). Among 64 genes predicted as targets of miR-378 in both mice and humans, four genes were previously reported to have a positive effect on cell proliferation (Supporting Information Table 3). Intriguingly, one of these genes, Odc1, encodes a polyamine-synthesizing enzyme that is needed for efficient and timely DNA synthesis in liver regeneration.28 Furthermore, Odc1 had the highest score and free energy of the predicted conserved miR-378 target genes with established proliferation-promoting function (Supporting Information Fig. 4B, Supporting Information Table 3). Using the experimental strategy described above, we found that miR-378 inhibits Odc1 by direct targeting of a complementary sequence in its 3′UTR (Fig. 4C). These results suggest that efficient liver regeneration may involve release of Odc1 from repression by miR-378.
Fig. 4.
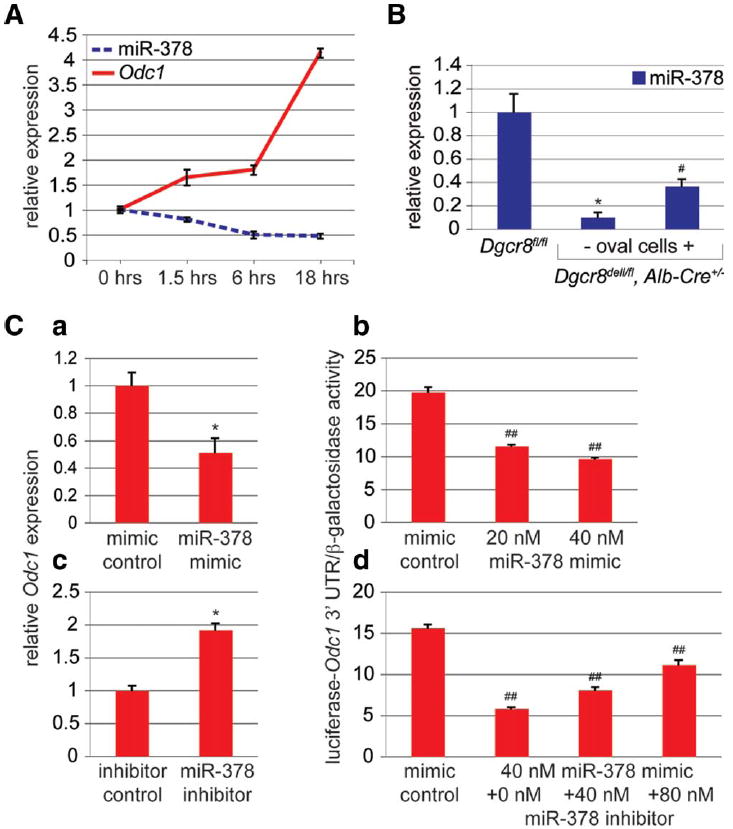
Declining expression of miR-378 during liver regeneration leads to de-repression of its proliferation-promoting target gene Odc1. (A) qRT-PCR shows inverse correlation of Odc1 and miR-378 expression in the first 18 hours after 2/3 PH. miR-378 expression normalizes by 72 hours after 2/3 PH (Supporting Information Fig. 5A). (B) qRT-PCR shows loss of miR-378 in livers of Dgcr8del/fl, Alb-Cre+/− mice lacking oval cells. Livers of Dgcr8del/fl, Alb-Cre+/− mice containing oval cells have significantly lower miR-378 levels than controls, suggesting that miR-378 expression increases with hepatic differentiation. (C) miR-378 mimic transfection into Hepa1,6 cells causes a reduction in Odc1 mRNA levels (a) and dose-dependent inhibition of the activity of a luciferase reporter gene linked to the 3′UTR of Odc1 (b). Conversely, miR-378 inhibitor transfection into Hepa1,6 cells causes an increase in Odc1 mRNA levels (c). Furthermore, miR-378 inhibitor transfection antagonizes the inhibitory binding of miR-378 mimics to the 3′UTR of Odc1 (d). Error bars represent ± SEM. *P < 0.005. ## P < 0.01. #P < 0.05.
Discussion
Although miRNAs are known to regulate cell proliferation, little information exists on the miRNAs and their target genes involved in regeneration of the liver or other organs. We investigated this question by generating mice with hepatocyte-specific inactivation of DGCR8, an essential component of the microprocessor complex. DGCR8 anchors the primary miRNA transcript for cleavage by Drosha. Thus, DGCR8 acts upstream of Dicer and its deficiency leads to disruption of processing of miRNAs, not other small RNAs.17 In line with recent findings of impaired proliferation in DGCR8-deficient mouse embryonic stem cells,29 we found that initiation of DNA synthesis was delayed in DGCR8-deficient hepatocytes after 2/3 PH. This finding suggested that miRNAs regulate hepatocyte G1 to S phase progression during liver regeneration.
To identify miRNAs regulating the regenerative capabilities of hepatocytes, we screened for miRNA expression changes in livers of adult wildtype mice after 2/3 PH. Because the miRNAs reported as promoters of proliferation in mouse embryonic stem cells are not expressed in hepatocytes, it was not surprising that none of these miRNAs was induced by 2/3 PH. Instead, we specifically found increased levels of miR-21, an established promoter of proliferation that is expressed at high levels in many types of cancer.20
Prompted by stringent target gene prediction we found that Btg2 is a direct target of miR-21. Moreover, our data suggest that increased miR-21 expression serves to antagonize the cell cycle inhibitor Btg2 during liver regeneration. The proliferation-promoting effect of increased miR-21 after 2/3 PH appears to be aided by a decrease in miR-378 expression and subsequent de-repression of Odc1. However, because the net result of global miRNA deficiency in hepatocytes was impaired S phase entry, loss of miR-378 appears to be insufficient to compensate loss of miR-21 during liver regeneration. Specific inhibition of miR-21 and miR-378 in vivo could be used to delineate their individual contributions to regulation of liver regeneration.30
Because a single miRNA typically targets many genes, the effects of miR-21 and miR-378 during liver regeneration are most likely not restricted to inhibition of Btg2 and Odc1. For example, in addition to Tgfbi and Smad7, the TargetScan algorithm predicts Tgfbr2, Acvr1c (activin A receptor 1C), and Acvr2a (activin A receptor 2A) as direct and conserved miR-21 targets involved in TGFβ and activin signaling. miR-21 might target these genes to limit the inhibitory effect of TGFβ and activin signaling on G1 to S phase transition of hepatocytes after 2/3 PH.25
The levels of the proliferation-promoting gene Ccnd1 were increased in hepatocytes with global miRNA deficiency before 2/3 PH. Our miRNA profiling revealed that miR-16, an miRNA known to inhibit Ccnd1 in the prostate, is expressed in the liver.31 Thus, loss of miR-16 may explain de-repression of Ccnd1 in Dgcr8del/fl, Alb-Cre+/− mice. In analogy, it is possible that loss of other miRNAs normally expressed in hepatocytes but not induced by 2/3 PH may contribute to impaired liver regeneration in Dgcr8del/fl, Alb-Cre+/− mice. This could explain the spontaneous oval cell activation in a subset of Dgcr8del/fl, Alb-Cre+/− mice. In addition, mouse miRNAs continue to be identified and we cannot rule out that miRNAs not represented on our arrays play a role in liver regeneration. However, in contrast to findings after DGCR8 inactivation in the skin,32 miR-21 was depleted in whole liver samples of mice with hepatocyte-specific DGCR8 deficiency. This shows that miR-21 is mainly expressed in hepatocytes in the liver and supports our conclusion that miR-21 directly regulates cell cycle progression in hepatocytes. Specific induction of miR-21 in G1 phase after 2/3 PH and impaired G1 to S phase transition in both hepatocytes with global miRNA deficiency and in those with FoxM1 deficiency further suggest that miR-21 plays a leading role in miRNA regulation of liver regeneration.
Our analyses focused on miRNA target genes that are conserved between mouse and human. Although little has been reported about miR-378’s regulation or function, the expression of miR-21 is known to be increased in primary human liver cancer.33,34 Moreover, miR-21 has been shown to promote proliferation of human liver cancer cell lines by inhibition of the phosphatase and tensin homolog (PTEN) tumor suppressor.33 Therefore, it is likely that miR-21 inhibits Btg2, and potentially other regulators of hepatocyte proliferation, also in human liver regeneration.
Supplementary Material
Acknowledgments
The authors thank Dr. Valentina Faktor for providing A6 antibody, Sandra Huling for immunostainings, and Dr. Montgomery Bissell for critical reading of the article.
H.W. received grant support from the California Institute for Regenerative Medicine, American Liver Foundation, and American Society of Transplantation. G.R. was supported by a fellowship from the NRSA Hepatology Training Grant at UCSF. R.N. was supported by a scholarship from the Agency of Science Technology and Research (A*STAR) Singapore.
Abbreviations
- ACVR1C
activin A receptor 1C
- ACVR2A
activin A receptor 2A
- AP-1
activation protein 1
- BTG2
B-cell translocation gene 2
- DGCR8
DiGeorge syndrome critical region gene 8
- FOXM1
forkhead box M1
- CCNA2
Cyclin A2
- CCNB1
Cyclin B1
- CCND1
Cyclin D1
- CCNE1
Cyclin E1
- miRNAs
microRNAs
- ODC1
ornithine decarboxylase
- PCNA
proliferating cell nuclear antigen
- PTEN
phosphatase and tensin homolog
- RIN
RNA integrity number
- STAT3
signal transducer and activator of transcription 3
- TGFβ
transforming growth factor β
- TGFBI
transforming growth factor β-induced
- TGFBR2
transforming growth factor β receptor 2
- UTR
untranslated region
Footnotes
Potential conflict of interest: Nothing to report.
Additional Supporting Information may be found in the online version of this article.
References
- 1.Michalopoulos GK. Liver regeneration. J Cell Physiol. 2007;213:286–300. doi: 10.1002/jcp.21172. [DOI] [PMC free article] [PubMed] [Google Scholar]
- 2.Lee LA. Advances in hepatocyte transplantation: a myth becomes reality. J Clin Invest. 2001;108:367–369. doi: 10.1172/JCI13650. [DOI] [PMC free article] [PubMed] [Google Scholar]
- 3.Overturf K, al-Dhalimy M, Ou CN, Finegold M, Grompe M. Serial transplantation reveals the stem-cell-like regenerative potential of adult mouse hepatocytes. Am J Pathol. 1997;151:1273–1280. [PMC free article] [PubMed] [Google Scholar]
- 4.Azuma H, Paulk N, Ranade A, Dorrell C, Al-Dhalimy M, Ellis E, et al. Robust expansion of human hepatocytes in Fah(−/−)/Rag2(−/−)/Il2rg(−/−) mice. Nat Biotechnol. 2007;25:903–910. doi: 10.1038/nbt1326. [DOI] [PMC free article] [PubMed] [Google Scholar]
- 5.Mitchell C, Willenbring H. A reproducible and well-tolerated method for 2/3 partial hepatectomy in mice. Nat Protoc. 2008;3:1167–1170. doi: 10.1038/nprot.2008.80. [DOI] [PubMed] [Google Scholar]
- 6.Fausto N, Campbell JS, Riehle KJ. Liver regeneration. Hepatology. 2006;43(Suppl):S45–S53. doi: 10.1002/hep.20969. [DOI] [PubMed] [Google Scholar]
- 7.Yin VP, Thomson JM, Thummel R, Hyde DR, Hammond SM, Poss KD. Fgf-dependent depletion of microRNA-133 promotes appendage regeneration in zebrafish. Genes Dev. 2008;22:728–733. doi: 10.1101/gad.1641808. [DOI] [PMC free article] [PubMed] [Google Scholar]
- 8.Thatcher EJ, Paydar I, Anderson KK, Patton JG. Regulation of zebrafish fin regeneration by microRNAs. Proc Natl Acad Sci U S A. 2008;105:18384–18389. doi: 10.1073/pnas.0803713105. [DOI] [PMC free article] [PubMed] [Google Scholar]
- 9.Otu HH, Naxerova K, Ho K, Can H, Nesbitt N, Libermann TA, et al. Restoration of liver mass after injury requires proliferative and not embryonic transcriptional patterns. J Biol Chem. 2007;282:11197–11204. doi: 10.1074/jbc.M608441200. [DOI] [PubMed] [Google Scholar]
- 10.Rao PK, Toyama Y, Chiang HR, Gupta S, Bauer M, Medvid R, et al. Loss of cardiac microRNA-mediated regulation leads to dilated cardiomyopathy and heart failure. Circ Res. 2009;105:585–594. doi: 10.1161/CIRCRESAHA.109.200451. [DOI] [PMC free article] [PubMed] [Google Scholar]
- 11.Postic C, Shiota M, Niswender KD, Jetton TL, Chen Y, Moates JM, et al. Dual roles for glucokinase in glucose homeostasis as determined by liver and pancreatic beta cell-specific gene knock-outs using Cre recombinase. J Biol Chem. 1999;274:305–315. doi: 10.1074/jbc.274.1.305. [DOI] [PubMed] [Google Scholar]
- 12.Postic C, Magnuson MA. DNA excision in liver by an albumin-Cre transgene occurs progressively with age. Genesis. 2000;26:149–150. doi: 10.1002/(sici)1526-968x(200002)26:2<149::aid-gene16>3.0.co;2-v. [DOI] [PubMed] [Google Scholar]
- 13.Schmittgen TD, Livak KJ. Analyzing real-time PCR data by the comparative C(T) method. Nat Protoc. 2008;3:1101–1108. doi: 10.1038/nprot.2008.73. [DOI] [PubMed] [Google Scholar]
- 14.Ritchie ME, Silver J, Oshlack A, Holmes M, Diyagama D, Holloway A, et al. A comparison of background correction methods for two-colour microarrays. Bioinformatics. 2007;23:2700–2707. doi: 10.1093/bioinformatics/btm412. [DOI] [PubMed] [Google Scholar]
- 15.Yang YH, Dudoit S, Luu P, Lin DM, Peng V, Ngai J, et al. Normalization for cDNA microarray data: a robust composite method addressing single and multiple slide systematic variation. Nucleic Acids Res. 2002;30:e15. doi: 10.1093/nar/30.4.e15. [DOI] [PMC free article] [PubMed] [Google Scholar]
- 16.Eisen MB, Spellman PT, Brown PO, Botstein D. Cluster analysis and display of genome-wide expression patterns. Proc Natl Acad Sci U S A. 1998;95:14863–14868. doi: 10.1073/pnas.95.25.14863. [DOI] [PMC free article] [PubMed] [Google Scholar]
- 17.Babiarz JE, Ruby JG, Wang Y, Bartel DP, Blelloch R. Mouse ES cells express endogenous shRNAs, siRNAs, and other Microprocessor-independent, Dicer-dependent small RNAs. Genes Dev. 2008;22:2773–2785. doi: 10.1101/gad.1705308. [DOI] [PMC free article] [PubMed] [Google Scholar]
- 18.Su AI, Guidotti LG, Pezacki JP, Chisari FV, Schultz PG. Gene expression during the priming phase of liver regeneration after partial hepatectomy in mice. Proc Natl Acad Sci U S A. 2002;99:11181–11186. doi: 10.1073/pnas.122359899. [DOI] [PMC free article] [PubMed] [Google Scholar]
- 19.Li J, Campbell JS, Mitchell C, McMahan RS, Yu X, Riehle KJ, et al. Relationships between deficits in tissue mass and transcriptional programs after partial hepatectomy in mice. Am J Pathol. 2009;175:947–957. doi: 10.2353/ajpath.2009.090043. [DOI] [PMC free article] [PubMed] [Google Scholar]
- 20.Krichevsky AM, Gabriely G. miR-21: a small multi-faceted RNA. J Cell Mol Med. 2009;13:39–53. doi: 10.1111/j.1582-4934.2008.00556.x. [DOI] [PMC free article] [PubMed] [Google Scholar]
- 21.Fujita S, Ito T, Mizutani T, Minoguchi S, Yamamichi N, Sakurai K, et al. miR-21 Gene expression triggered by AP-1 is sustained through a double-negative feedback mechanism. J Mol Biol. 2008;378:492–504. doi: 10.1016/j.jmb.2008.03.015. [DOI] [PubMed] [Google Scholar]
- 22.Loffler D, Brocke-Heidrich K, Pfeifer G, Stocsits C, Hackermuller J, Kretzschmar AK, et al. Interleukin-6 dependent survival of multiple myeloma cells involves the Stat3-mediated induction of microRNA-21 through a highly conserved enhancer. Blood. 2007;110:1330–1333. doi: 10.1182/blood-2007-03-081133. [DOI] [PubMed] [Google Scholar]
- 23.Friedman RC, Farh KK, Burge CB, Bartel DP. Most mammalian mRNAs are conserved targets of microRNAs. Genome Res. 2009;19:92–105. doi: 10.1101/gr.082701.108. [DOI] [PMC free article] [PubMed] [Google Scholar]
- 24.Krek A, Grun D, Poy MN, Wolf R, Rosenberg L, Epstein EJ, et al. Combinatorial microRNA target predictions. Nat Genet. 2005;37:495–500. doi: 10.1038/ng1536. [DOI] [PubMed] [Google Scholar]
- 25.Oe S, Lemmer ER, Conner EA, Factor VM, Leveen P, Larsson J, et al. Intact signaling by transforming growth factor beta is not required for termination of liver regeneration in mice. Hepatology. 2004;40:1098–1105. doi: 10.1002/hep.20426. [DOI] [PubMed] [Google Scholar]
- 26.Park TJ, Kim JY, Oh SP, Kang SY, Kim BW, Wang HJ, et al. TIS21 negatively regulates hepatocarcinogenesis by disruption of cyclin B1-Forkhead box M1 regulation loop. Hepatology. 2008;47:1533–1543. doi: 10.1002/hep.22212. [DOI] [PubMed] [Google Scholar]
- 27.Wang X, Kiyokawa H, Dennewitz MB, Costa RH. The Forkhead Box m1b transcription factor is essential for hepatocyte DNA replication and mitosis during mouse liver regeneration. Proc Natl Acad Sci U S A. 2002;99:16881–16886. doi: 10.1073/pnas.252570299. [DOI] [PMC free article] [PubMed] [Google Scholar]
- 28.Ohtake Y, Maruko A, Ohishi N, Kawaguchi M, Satoh T, Ohkubo Y. Effect of retinoic acid on transglutaminase and ornithine decarboxylase activities during liver regeneration. Cell Biochem Funct. 2008;26:359–365. doi: 10.1002/cbf.1451. [DOI] [PubMed] [Google Scholar]
- 29.Wang Y, Baskerville S, Shenoy A, Babiarz JE, Baehner L, Blelloch R. Embryonic stem cell-specific microRNAs regulate the G1-S transition and promote rapid proliferation. Nat Genet. 2008;40:1478–1483. doi: 10.1038/ng.250. [DOI] [PMC free article] [PubMed] [Google Scholar]
- 30.Krutzfeldt J, Rajewsky N, Braich R, Rajeev KG, Tuschl T, Manoharan M, et al. Silencing of microRNAs in vivo with ‘antagomirs’. Nature. 2005;438:685–689. doi: 10.1038/nature04303. [DOI] [PubMed] [Google Scholar]
- 31.Bonci D, Coppola V, Musumeci M, Addario A, Giuffrida R, Memeo L, et al. The miR-15a-miR-16-1 cluster controls prostate cancer by targeting multiple oncogenic activities. Nat Med. 2008;14:1271–1277. doi: 10.1038/nm.1880. [DOI] [PubMed] [Google Scholar]
- 32.Yi R, Pasolli HA, Landthaler M, Hafner M, Ojo T, Sheridan R, et al. DGCR8-dependent microRNA biogenesis is essential for skin development. Proc Natl Acad Sci U S A. 2009;106:498–502. doi: 10.1073/pnas.0810766105. [DOI] [PMC free article] [PubMed] [Google Scholar]
- 33.Meng F, Henson R, Wehbe-Janek H, Ghoshal K, Jacob ST, Patel T. MicroRNA-21 regulates expression of the PTEN tumor suppressor gene in human hepatocellular cancer. Gastroenterology. 2007;133:647–658. doi: 10.1053/j.gastro.2007.05.022. [DOI] [PMC free article] [PubMed] [Google Scholar]
- 34.Connolly E, Melegari M, Landgraf P, Tchaikovskaya T, Tennant BC, Slagle BL, et al. Elevated expression of the miR-17-92 polycistron and miR-21 in hepadnavirus-associated hepatocellular carcinoma contributes to the malignant phenotype. Am J Pathol. 2008;173:856–864. doi: 10.2353/ajpath.2008.080096. [DOI] [PMC free article] [PubMed] [Google Scholar]
- 35.Xu X, Kobayashi S, Qiao W, Li C, Xiao C, Radaeva S, et al. Induction of intrahepatic cholangiocellular carcinoma by liver-specific disruption of Smad4 and Pten in mice. J Clin Invest. 2006;116:1843–1852. doi: 10.1172/JCI27282. [DOI] [PMC free article] [PubMed] [Google Scholar]
Associated Data
This section collects any data citations, data availability statements, or supplementary materials included in this article.