Abstract
Sequence similarity based protein clustering methods organize proteins into families of similar sequences, a task that continues to be critical for automated protein characterization. However, many protein families cannot be automatically characterized further because little is known about the function of any protein in a family of similar sequences. We present a novel phylogenetic profile comparison (PPC) method called Automated Protein Annotation by Coordinate Evolution (APACE) that facilitates the automated characterization of proteins beyond their homology to other similar sequences. Our method implements a new approach for the normalization of similarity scores among multiple species and automates the characterization of proteins by their patterns of co-evolution with other proteins that do not necessarily share a similar sequence. We demonstrate that our method is able to recapitulate the topology of the latest, unresolved, composite deep eukaryotic phylogeny and is able to quantify the as yet unresolved branch lengths. We further demonstrate that our method is able to detect more functionally related proteins, given the same starting data, than existing methods. Finally, we demonstrate that our method can be successfully applied to much larger comparative genomic problem instances where existing methods often fail.
I. INTRODUCTION
The relationship between the genes and the observable traits of a given organism is mediated by the function of the protein products of the genes in question. The sequence of a protein determines the folding, and thus the function, of a protein due to protein folding. Since interactions between individual amino acids are conserved across instances, proteins that have similar sequences also fold in a similar manner and presumably have similar functions. This relationship between structure and function is the basis of sequence similarity-based protein annotation methods. These homology methods infer knowledge about a new protein from knowledge about a known protein with a sufficiently similar amino acid sequence. The organization of proteins into so-called protein families facilitates the association of new proteins with known protein families by sequence similarity, which facilitates the transfer of knowledge from existing annotations to novel proteins. The extent of automated protein characterization made possible by such methods is largely dependent on existing knowledge about at least one protein in every protein family. As a result, a large proportion of protein families remain uncharacterized beyond sequence similarity [1,2].
The fact that proteins rarely act in isolation suggests an extended annotation approach where the function of a known protein can inform the user about the function of a novel, sequentially dissimilar protein based on its functional context [3]. The phylogenetic profile comparison (PPC) class of automated protein characterization methods operates on the premise that members of protein networks co-evolve to preserve functional compatibility and that similar patterns of protein occurrence across sets of diverse species evidence instances of protein co-evolution [4]. Typically, a PPC method proceeds as follows: for each protein in a proteome of interest, the presence or absence of an orthologous sequence is determined in each of the reference proteomes that a user has selected, and an occurrence profile of each protein is constructed. This is followed by a pair-wise occurrence profile comparison step. Proteins occurrence profile pairs that satisfy some criterion of occurrence profile similarity are predicted to have co-evolved to maintain functional compatibility. PPC methods tend to differ in how orthologs are detected and how occurrence profiles are compared. For ortholog detection, certain methods use a similarity score cutoff to determine the existence of an ortholog [1,5,6,7,8], while other methods use pre-computed ortholog clusters [9]. Each method has its strengths and drawbacks. For profile comparison, reported schemes range from simple Hamming distance [3] to phylogeny-based maximum-likelihood methods complete with an internal model of gene evolution [10]. Combinations of the more straightforward solutions to both problems have made existing methods particularly applicable to prokaryotic proteomes [1,5,8,10], while the development of PPC methods focusing on eukaryotic species remains largely unexplored [6,10].
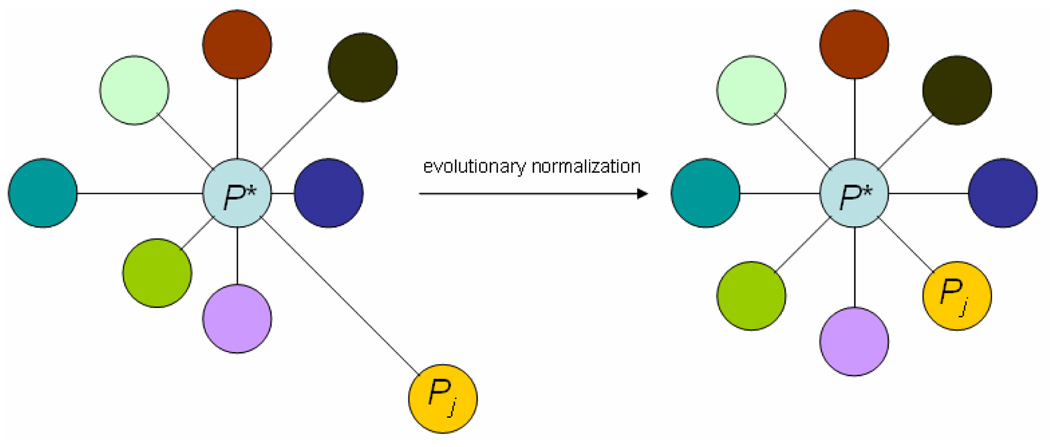
PPC methods aim to characterize proteins by extracting information for a protein of interest from its compatibility context by leveraging the strength of the association relating co-evolution and profile similarity. The use of reference varying evolutionary distances to the proteome of interest is integral for the successful application of any PPC method. Varying evolutionary distances between species inherently introduces evolutionary biases into sequence similarity scores that confounds accurate profile construction. Thus, it is imperative to normalize similarity scores for any variation in the underlying evolutionary distances between a focus species and each reference species (Figure 1). While gene-evolution events like horizontal gene transfer may justify the use of convenient profile comparison approaches, like Hamming distance, as found in existing methods, the same approaches to profile comparison are less applicable within the context of eukaryotic phylogenetics. Other profile comparison schemes rely on many assumptions about eukaryotic gene and species evolution that do not accurately reflect known biology.
Figure 1.
Reference proteomes Pj evolve away from a focus proteome P* at different rates and for different lengths of time (left). Normalization of similarity scores equalize evolutionary distances (rate × time) between P* and all Pj facilitates proper comparison of sequence similarity scores across multiple Pj (right).
One of the few methods to focus on eukaryotic systems is described in [6,7] in which a PPC method called Procom is presented. Procom works by determining the set of proteins in a given focus proteome that has a detected ortholog in every species classified as positive for a trait of interest and no detectable orthologs species classified as negative for the same trait of interest [6]. An ortholog is detected if the BLASTP E-value of the best-hit to a given focus protein in a given reference proteome is less than the significance cut-off value of 1E-10. Reference [6] demonstrates the effectiveness of Procom by identifying and characterizing novel ciliary proteins in the biflagellate, green alga Chlamydomonas reinhardtii. In [6], the trait of interest is the presence or absence of cilia, Human is the species positive for the trait and Arabidopsis thaliana, an aflagellate angiosperm, is the negative species. Reference [6] used Procom to define the now well-established Flagellar and Basal Body proteome. Among many other cilia and basal body related proteins, Procom is responsible for the characterization of BBS5, a new Bardet-Biedl Syndrome disease gene.
This paper presents a new PPC method called APACE (Automated Protein Annotation by Coordinate Evolution) based on a novel similarity score normalization process and ortholog detection approach that automatically clusters proteins without requiring any additional profile comparison scheme. Our novel normalization function adjusts sequence similarity scores to equalize the evolutionary distance between a focus species and each reference species (Figure 1). Furthermore, the APACE is able to organize proteins into co-evolving groups without any additional profile comparison scheme.
II. THE APPROACH
In this section, the input to any PPC method is taken to be a set of N+1 proteomes consisting of a focus proteome P* and a set of N reference proteomes labeled P1, P2, …, PN. Proteome P* is made up of the appropriate number of individual proteins pi encoded by gene gi in genome G*. The protein in reference proteome Pj that is most similar in sequence to a given protein of interest pi in P* is the “best-hit to pi from Pj” and is denoted by pij. The degree of sequence similarity between pi and pij is quantified by a similarity score sij.
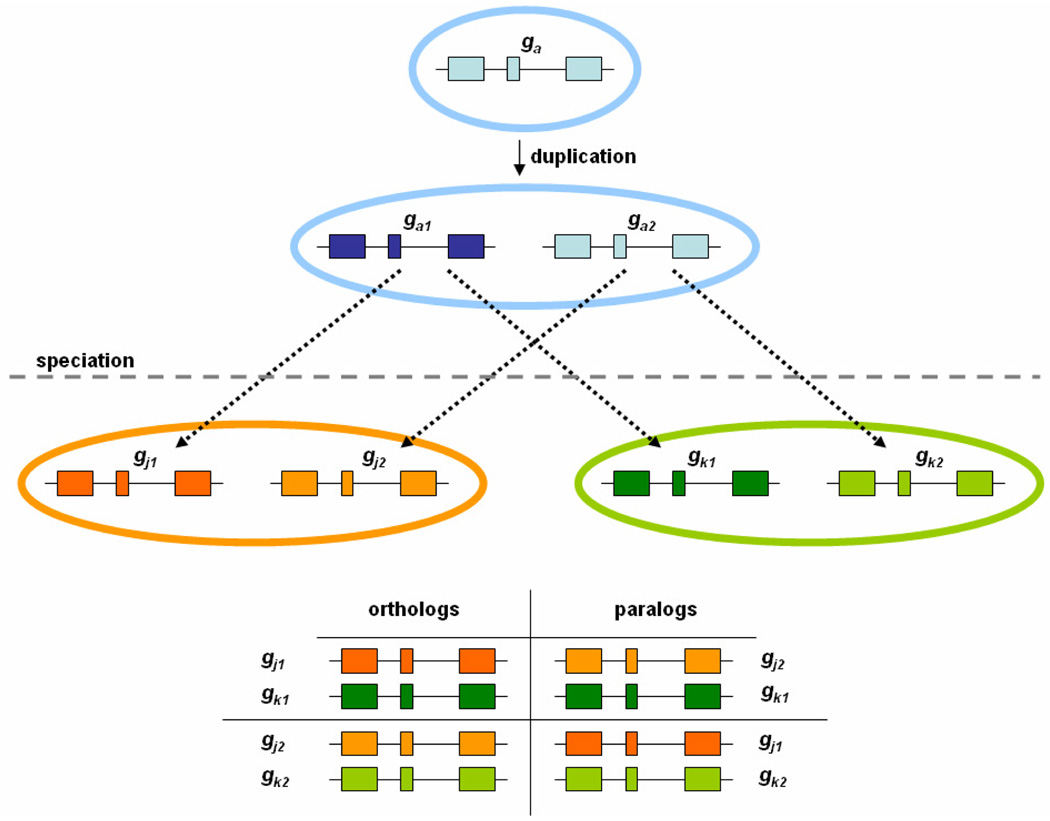
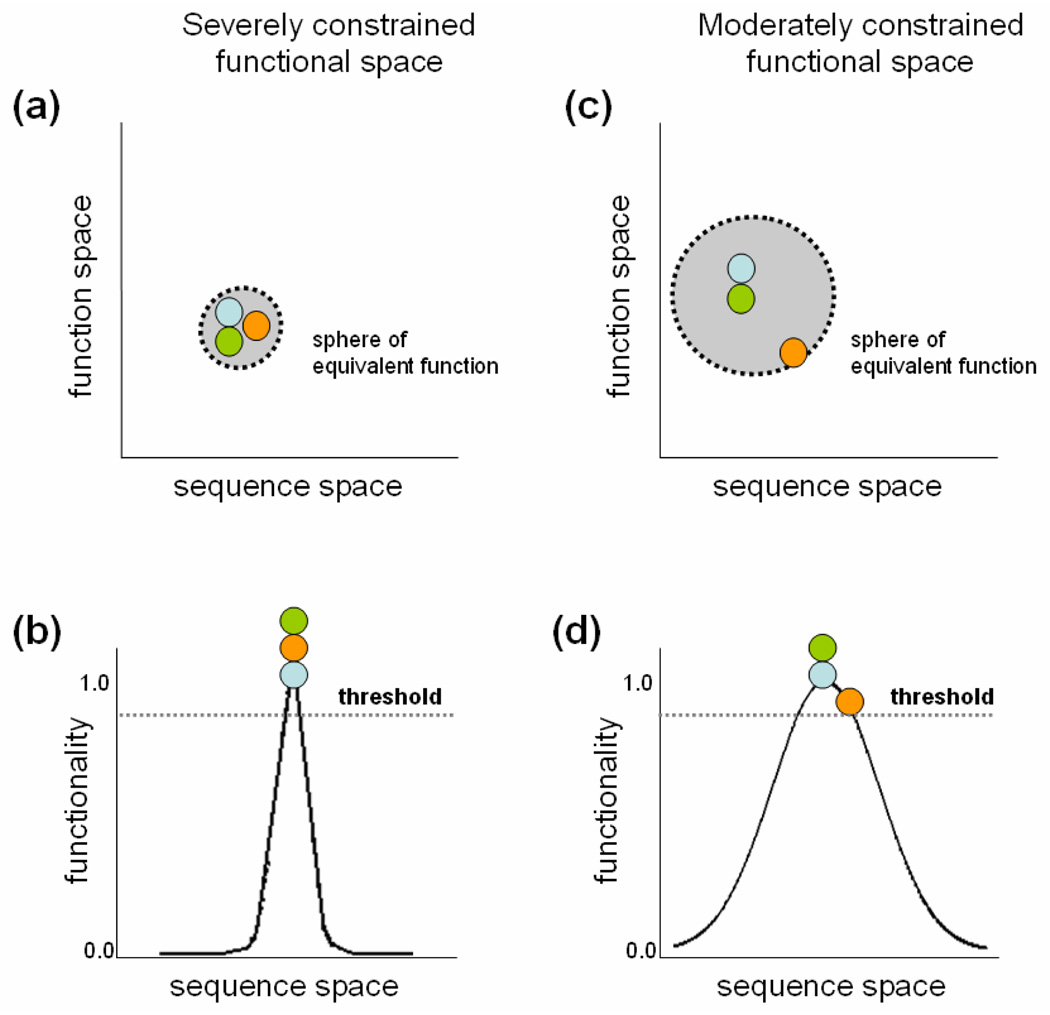
Orthologs are genes gj1 and gk1 from two different species J and K that evolve from a common ancestral gene ga1 through speciation from their last common ancestral species (Figure 2). Proteins encoded by orthologous genes are assumed to retain the same function in J as in K; that is, orthologous sequences are constrained to mutate within a functionally equivalent sequence space. Paralogs gj1, gk2 and gj2, gk1 are genes that evolve from duplicate ancestral genes ga1 and ga2 and often do not retain the same function across species; that is, paralogs are free to evolve outside of their functionally equivalent sequence space (Figure 3). This relationship between orthologs and paralogs implies that protein pi will be more similar in sequence to an ortholog than to any other paralogous sequence in an arbitrary reference proteome Pj, which suggests that a superset of all orthologs to a protein of interest pi in a set of reference species can be generated by identifying the proteins pij over each of the N reference proteomes Pj. This set is a superset of the orthologs of pi because not every Pj necessarily contains an ortholog of pi. In the case where a Pj does not contain an ortholog to pi, the best-hit pij would still be returned. Note that such cases are not necessarily handled correctly by reciprocal-best-hit ortholog detection schemes. Orthologs can be extracted from a superset of best-hits provided that there is a way to separate orthologous best-hits from paralogous best-hits.
Figure 2.
The operative relationship between orthologous and paralogous sequences.
Figure 3.
Different proteins have function-specific spheres of equivalent function in function-sequence space, which determines the sequence space within which a protein may mutate and still retain the same function as the ancestral sequence.
The sequence, structure and function of a given protein are intimately related characteristics. Evolving proteins can be viewed as moving points within a sequence-function space in which every biological action performed by a protein defines an associated sphere of equivalent function. In this space, perturbations in the sequence that do not result in a loss-of-function place an extant protein point within the functional sphere of the ancestral protein (Figure 3a). Perturbations in a sequence that greatly affect function place an extant protein point outside the functional sphere of the ancestral protein. Another way to visualize this relationship is to plot functionality against sequence space (Figure 3b). Proteins that occupy steep functionality curves cannot diverge significantly from a functional ancestral sequence without falling below some equivalency threshold of functionality (Figure 3b). Other genes encode proteins that can withstand greater degrees of perturbations will result in orthologs that mutate within a more relaxed sequence space (Figure 3c). In terms of functionality, functions with moderate sequence constraints allow for a larger variety of protein sequences to carry out equivalent function (Figure 3d). In such a case, there arise some sequences that result in conformations more functionally favorable than other sequences, but as in the first case, at a certain point, the degree of functionality drops below some critical threshold and the original function is lost.
Orthologs are proteins from different species that carry out the same function by remaining within the functional sphere of the common ancestral protein. Proteins under greater functional constraints likely have a lower tolerance to sequence perturbations than proteins under fewer constraints. This further reduces the degree of sequence space within which functionally equivalent orthologs can evolve. Paralogs, by contrast, are free to evolve outside this doubly constrained sequence space suggesting the assumption that, over the magnitudes of evolutionary time considered by our method, paralogous proteins have had ample opportunity to evolve into the wider sequence space and no longer occupy the same functional space. The sphere of equivalent function is specific to each individual protein; that is, different proteins evolve at different rates and perform functions that are tolerant of different degrees of perturbation. Thus, while one may define a cutoff similarity score for each protein individually, it is impossible to correctly define a universal cutoff similarity score for every protein.
Evolutionary distance between the two source species and functional equality are the two principal factors that influence the degree of similarity between any two proteins. PPC methods rely on the accurate detection of functionally equivalent orthologs across many species. Therefore, a critical step in any PPC pipeline ought to be the normalization of similarity scores for the effects of different evolutionary distance. Proteins that are least tolerant of sequence perturbations are presumably the most functionally constrained. For these proteins, we expect a high degree of inter-ortholog similarity and any observed dissimilarity is primarily a reflection of the evolutionary distance between the two source species. Following this rationale, sequence similarity scores of the most widely conserved proteins across multiple phyla have been used to infer branch lengths of the phylogenetic trees. Our method extends this rationale by equating the evolutionary distance between P* and each Pj as the average sij of the most widely conserved proteins in P* and each Pj. Our normalization determines a normalization factor rj for each reference proteome Pj that is inversely related to the distance between P* and Pj. The idea is to calculate an adjusted similarity score aij as the product of sij and rj, which equalizes the evolutionary distance between P* and every Pj (Figure 1).
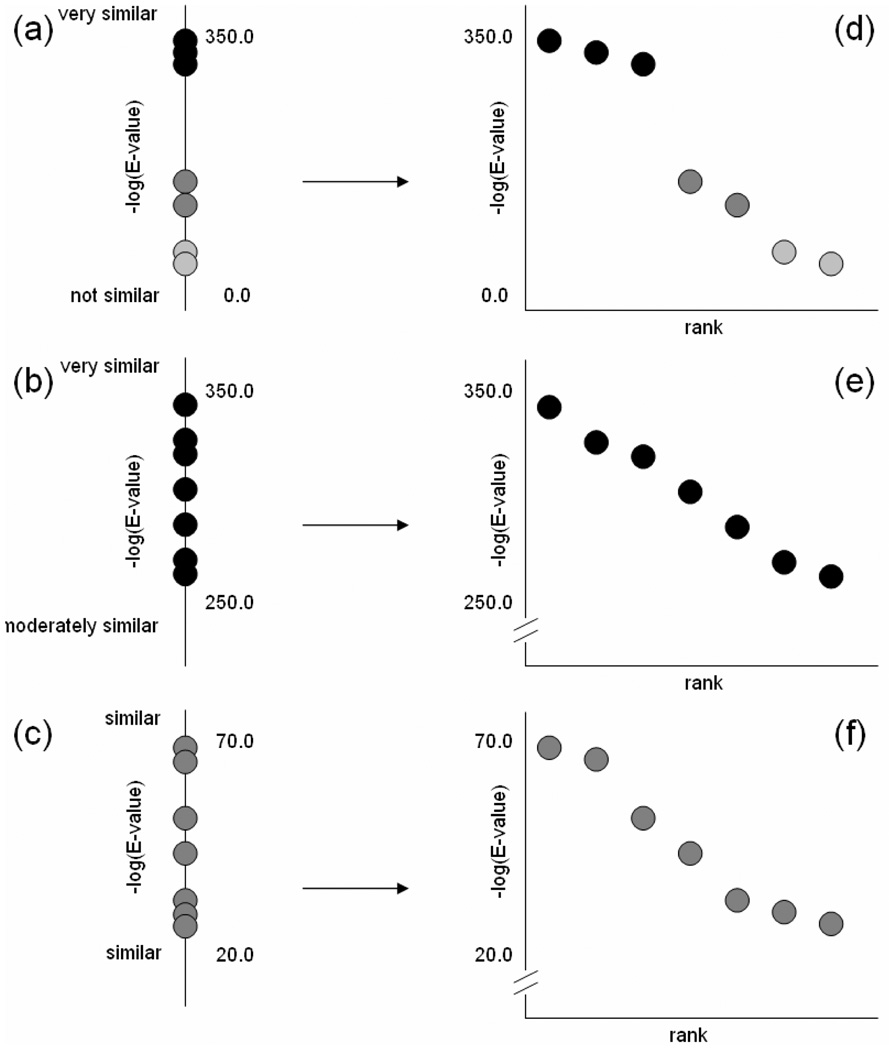
Orthologous sequences can be extracted from a set of best-hit sequences containing both orthologous and paralogous sequences by leveraging the observation that orthologs always evolve with a relatively more constrained sequence space; the orthologous best-hits can be distinguished from paralogous best-hits by their greater degree of similarity to the reference protein pi than paralogous best-hits. Discriminating orthologs from paralogs in a set of best-hits can be intuitively interpreted as a simple clustering problem. A best-hit set can be represented as a list of similarity scores for each pij for each Pj sorted in decreasing order of adjusted similarity according to aij, suggesting that the problem be solved by some flavor of k-means. The critical observation here is that the sorted similarity scores for every pi in P* will be a mixture of three classes of score distributions. Ideally, similarity scores from orthologous best-hits will form a cluster of high scoring best-hits within the set (Figure 4a). Proteins that are widely conserved across all reference species are another class of score distributions that form a single cluster with similarity scores scattered over a small range in a roughly uniform manner (Figure 4b). A third class of score distributions arise when proteins have orthologous and paralogous best-hits scores that are not as clearly defined as the ideal first class and yet not as uniformly distributed as the second class. This mixture of score distributions precludes an a priori determination of the requisite constant k for a k-means solution for all proteins in P* (Figure 4c).
Figure 4.
Three classes of similarity score distributions in 1D and their corresponding 2D spreads (a) Orthologs form a distinct cluster of very similar sequences and the 2D spread has a distinct ortholog-paralog gap; (b) Orthologs exist across all species forming a single high-scoring cluster and the 2D spread is roughly linear across the 2D spread; (c) Orthologs and paralogs are not easily distinguished in 1D while in the 2D spread an inflection point can still be detected.
We propose a novel solution to this problem by defining a 2D “spread” for each list of 1D sorted scores. The 2D spread of any sorted list is constructed by introducing an axis of decreasing rank that is orthogonal to the native axis of real valued similarity scores (Figures 4d–f). The units on the new axis are the rank of the score within the scores for a given pi. Because any list of scores has an implicit ranking, the property used to cluster the scores is the inter-cluster versus intra-cluster differences in 1D. Constructing the 2D spread of a list of scores translates a large difference between two scores into a line segment with a steep negative slope (Figure 4d) and a small difference between two scores into a line segment with a shallow negative slope and (Figure 4e). Thus, clusters of orthologs will form approximately linear sub-profiles that begin at the first rank position (leftmost position on the rank axis) in a 2D spread. The problem of determining whether a group of scores form a cluster in the 1D list as a whole can be reduced to determining the rank after which there is an inflection point in the 2D spread. Our method determines the appropriate inflection point by computing the second forward derivative of the 2D spread at every rank. To mitigate the effects of spurious noise in the spreads, the method takes the averaged second derivative over rank t, t+1 and t+2 as the smoothed second-forward derivative at t. The method selects the leftmost rank t* with a smoothed second forward derivative that is greater than or equal to zero to be the lowest ranked species with an ortholog to pi.
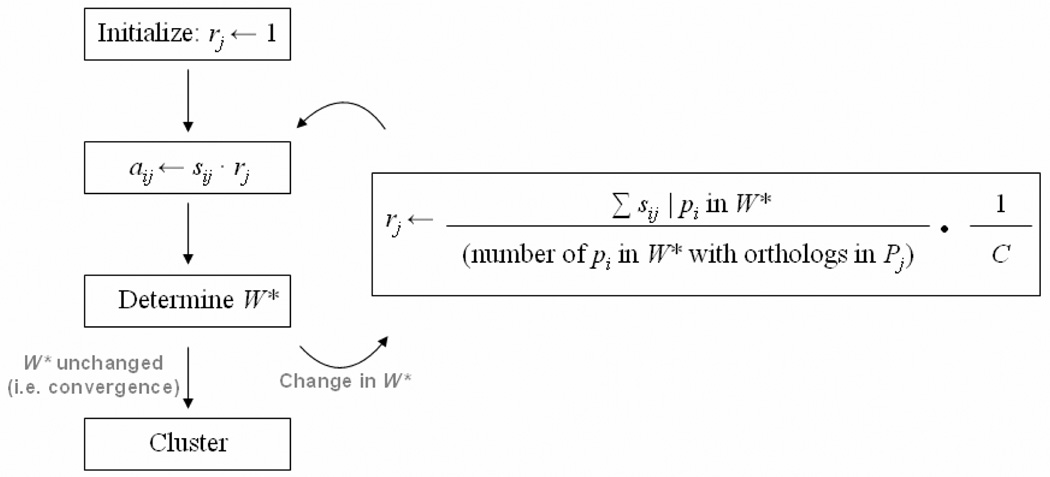
Our method, called APACE, proceeds as follows: First, the method determines a normalization factor rj for each reference proteome Pj that is inversely related to the distance between P* and Pj. These factors are computed by determining the multiplicand that equalizes the average best-hit similarity score of most widely conserved proteins in P* between all Pj. Let the set W* be the subset of proteins in P* with orthologs in at least N − ε reference proteomes for some small ε. W* is the set of widely conserved proteins in P*. The algorithm incrementally converges on the appropriate value for each rj by initiating each rj to 1 and use our profile inflection-point ortholog detection method (see above) to determine an initial W* with unadjusted scores. Every rj is then reassigned the ratio of the average sij of every pi in W* for each Pj to some globally constant value (i.e. the unit branch length in the balanced star topology). Every aij of every protein pi is then recalculated with the updated rj and the next iteration begins (Figure 5). Convergence is reached when the composition of W* remains unchanged or a maximum number of iterations has been reached. Empirically, convergence is reached within four iterations for the 29 eukaryotic test species analyzed in this study. After convergence is reached, the similarity scores are already appropriately adjusted to normalize evolutionary distance and the phylogenetic profile clustering of pi by the occurrence of functionally equivalent orthologs is performed using the inflection point analysis method described above. The profile of each pi is determined as the species from rank “1” down to and including the leftmost rank in the 2D spread with a smoothed second derivative greater than zero. Proteins that exhibit the same phylogenetic profile are predicted to have co-evolved, presumably to maintain functional compatibility.
Figure 5.
A flow diagram of the APACE phylogenetic profile clustering method. The normalization factor, rj, is ultimately computed to be the multiplicand that equalizes the average similarity scores of every widely-conserved protein in P* to each reference proteome Pj and is initiated as 1. W* is the set of most conserved in P* and is by construction a strict subset of P*. The value of C is the arbitrary constant evolutionary distance every Pj is normalized to from P* through each rj.
III. RESULTS AND ANALYSIS
APACE introduces two novel methods for its analyses of proteomic data from multiple eukaryotic species. The first is the normalization of similarity scores for differences in evolutionary distance between a focus proteome P* and each of the N reference proteomes Pj. Unlike conventional methods that normalize similarity scores based on branch lengths of phylogenetic trees constructed using a single gene or a small set of genes, APACE makes use of as many widely conserved proteins as possible in determining a species-specific normalization factor rj that is inversely related to the evolutionary distance between P* and each Pj. In the current example of 29 species, the interspecies distances are computed based on approximately 1,600 highly conserved proteins, varying in a species specific manner. The second novel method introduced by APACE is in how orthologous sequences are detected from a superset of best-hit sequences from each of the reference species from the 2D spread of a list of best-hit similarity scores. To validate the normalization approach introduced by APACE, we ask whether the phylogenetic tree generated from the inverse values of APACE normalization factors is able to topographically recapitulate the unresolved, deep eukaryotic phylogeny tree recently presented in [11]. To demonstrate the flexibility of the novel ortholog detection and phylogenetic profile construction approach introduced by APACE, we present results of two analyses to identify proteins with specific functional classifications. First we present a small-scale example query comparing APACE to the method documented in [6] for identifying proteins involved in cilia motility. To demonstrate the scalability of APACE in comparison with existing methods, we ask both APACE and the method in [6] to identify a list of Human proteins that have co-evolved in a large number of multicellular metazoan and plant species.
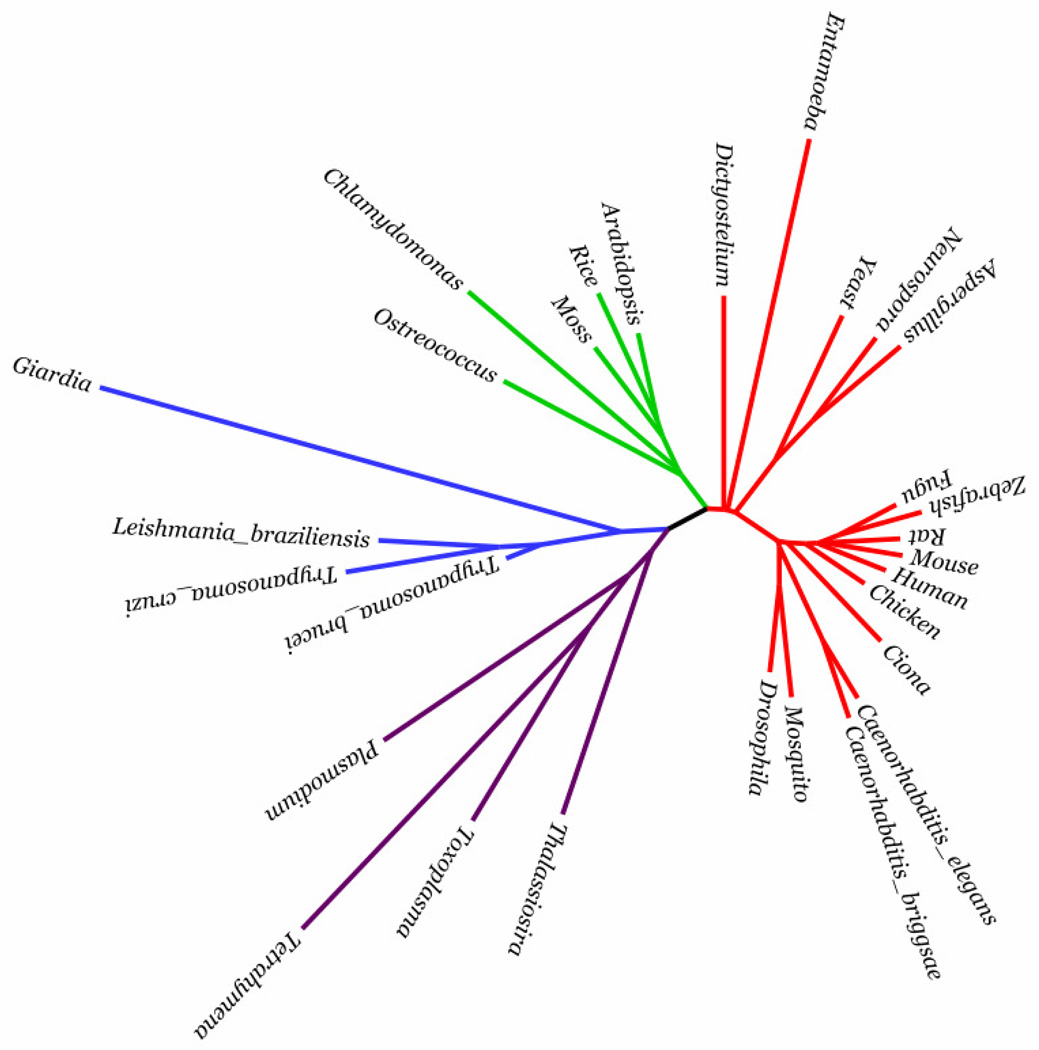
To validate our normalization procedure, we analyzed 29 eukaryotic organisms, which span multiple phyla and supergroups [11]. We construct a 29 by 29 matrix of distances from the average similarities rj as described in [12] and use the minimal evolution with ordinary least squares tree-building method FastME described in [13] to build a tree from the distance matrix and compare our generated tree to a published composite tree [11] (Figure 6). We confine our comparison to the gross topology because the tree in [13] contains unresolved branches. A comparison shows that both trees share identical topology from the most general level (i.e. supergroups) down to the most specific level presented in [13]. The identical topologies of the generated tree and the reference tree indicate that our method successfully computes normalization factors for 29 widely divergent eukaryotic species. To test whether the topological identity is due to the strong bias in the 29 test species for species belonging to the ‘Unikonts’ supergroup [11], we removed closely related species from metazoa leaving the same number of ‘Unikonts’ species as there are species from Plantae. The topological identity of the resultant “unbiased” tree remains unchanged (data not shown) and demonstrates that our normalization method is robust against different species biases and sizes of different reference species sets.
Figure 6.
A rendering of the phylogenetic tree of eukaryotes using FigTree [24] constructed by FastME using interspecies distances computed based on the normalization factors rj as determined by the normalization phase of APACE. The normalization factors facilitate the quantification of previously unresolved branches [10] and the resulting tree topologically recapitulates the composite deep eukaryote tree presented in [10]. Represented supergroups are ‘Unikonts’ (red), Plantae (green), Excavates (blue) and Chromalveolates (purple).
We evaluate our predictions by comparing our results to Procom [7]. We target C. reinhardtii proteins responsible for cilia motility in our comparison with Procom because one class of ciliopathies results from immotile cilia (e.g. primary cilia dyskinesia). For this demonstration, the focus species is C. reinhardtii; species with motile cilia that we include in our analysis are Homo sapiens, Danio rerio (zebrafish) and Physcomitrella patens (a moss) and species without motile cilia included in our analysis are Arabidopsis thaliana, Caenorhabditis elegans (nematode), Oryza sativa (rice) and Saccharomyces cerevisiae (yeast).
Procom identifies 50 proteins in C. reinhardtii that have orthologs in all three positive species and none of the negative species and APACE identifies 65 proteins that have coevolved in species considered. We find that APACE and Procom agree for 33 proteins; 21 have cilia related annotations. Ten are known cilia proteins by mass spectroscopy of isolated cilia [14], four were identified previously in [6] and the remainder that are likely to be involved in cilia motility as they have mutant motility phenotypes. The remaining eight proteins have no previous association with cilia or cilia motility. APACE identifies 32 proteins that are not in the Procom output. Three-quarters (N=24) have existing ciliary or cilia motility associations; they include ODA7, recently implicated in primary ciliary dyskinesia [15], PF13, a chaperone of dynein arms [16] and a novel C. reinhardtii ortholog of human BLU/ZMYND10 which is a member of the chromosome 3p21.3 candidate tumor suppressor gene cluster [17]. Two proteins are completely novel with no existing annotations; None of the remaining six proteins identified exclusively by APACE are overtly unrelated to cilia motility. Procom identifies 17 putative cilia motility proteins absent from APACE output. Given existing annotations, about half (N=9) have existing ciliary or cilia motility associations, while the remaining eight proteins seem unlikely to be involved with cilia motility given existing annotations. These results demonstrate that APACE is able to contribute novel characterizations of proteins that are complimentary to existing methods and that it identifies fewer known negatives than Procom [6, 7].
Next, we compared APACE to Procom using 29 Eukaryotic proteomes to identify human proteins that have orthologs in only multicellular species (Anopheles gambiae, Arabidopsis thaliana, Caenorhabditis briggsae, Caenorhabditis elegans, Ciona intestinalis, Danio rerio, Drosophila melanogaster, Gallus gallus, Mus musculus, Physcomitrella patens, Oryza sativa, Rattus norvegicus and Takifugu rubripes) but that are absent from unicellular species (Aspergillus nidulans, Chlamydomonas reinhardtii, Dictyostelium discoideum, Entamoeba histolytica, Leishmania braziliensis, Neurospora crassa, Ostreococcus tauri, Plasmodium falciparum, Saccharomyces cerevisiae, Tetrahymena thermophila, Toxoplasma gondii, Trypanosoma brucei and Trypanosoma cruzi) with the aim of identifying proteins that are essential for multicellularity. Our method identifies 56 proteins while Procom is unable to detect any proteins conserved in multicellular species exclusively. Interestingly, the set identified by our method (N=56) consists mostly of extracellular matrix degradation and regulatory proteins. The family of metalloproteinase is the most strongly represented group in the set (N=10) and have been implicated in multiple tissue remodeling of many physiological and pathological processes such as morphogenesis [18], angiogenesis [19], wound healing/tissue repair [20], cirrhosis [21], arthritis [22] and metastasis [23]. The majority of other proteins identified contain transcription factor, signaling or transmembrane domains, potentially highlighting more specific functional subclasses that are integral for the development, maintenance and pathology of multicellular organisms.
IV. CONCLUSIONS
We describe a new, scalable method, APACE, for the characterization of proteins by their common phylogenetic profile through a new, effective PPC method that does not require orthologous and paralogous proteins to be identified in a preprocessing step. Furthermore, our method is able to avoid the use of alignment significance cutoffs to distinguish orthologs from paralogs. Instead, the method recognizes that the set of best-hits to a protein of interest will always be a superset of the orthologs to that protein. The task of distinguishing ortholog from paralog in a set of best-hits for every protein in a proteome reduces to a k-means clustering problem where k cannot be determined a priori. Our method uses a novel clustering method that redistributes similarity scores in one dimensional space onto a second dimension to separate orthologs and paralogs within a best-hit protein set. We demonstrate that the method is able to determine interspecies evolutionary distances that corroborate the most recent deep eukaryotic phylogenies, that our approach can successfully detect a set of proteins involved in cilia motility that compliments existing approaches and that our method can be applied to larger problem spaces where existing methods often fail.
ACKNOWLEDGEMENTS
This work was supported by the National Institutes of Health grants to GDS (HG-00249) and SKD (GM-32843).
Contributor Information
Alan L. Kwan, Dept. Computer Science & Engineering, Washington University in St. Louis, St. Louis, Missouri, alan@ural.wustl.edu
Susan K. Dutcher, Department of Genetics, Washington University School of Medicine, St. Louis, Missouri, dutcher@genetics.wustl.edu
Gary D. Stormo, Department of Genetics, Washington University School of Medicine, St. Louis, Missouri, stormo@ural.wustl.edu
REFERENCES
- 1.Karimpour-Fard A, Hunter L, Gill RT. Investigation of factors affecting prediction of protein-protein interaction networks by phylogenetic profiling. BMC Genomics. 2007;8:393. doi: 10.1186/1471-2164-8-393. [DOI] [PMC free article] [PubMed] [Google Scholar]
- 2.Jaroszewski L, Li Z, Krishna SS, Bakolitsa C, Wooley J, Deacon AM, Wilson IA, Godzik A. Exploration of Uncharted Regions of the Protein Universe. PLOS Biology. 2009;7(9) doi: 10.1371/journal.pbio.1000205. e1000205. [DOI] [PMC free article] [PubMed] [Google Scholar]
- 3.Pellegrini M, Marcotte EM, Thompson MJ, Eisenberg D, Yeates TO. Assigning protein functions by comparative genome analysis: protein phylogenetic profiles. Proc. Natl. Acad. Sci. USA. 1999;96:4285–4288. doi: 10.1073/pnas.96.8.4285. [DOI] [PMC free article] [PubMed] [Google Scholar]
- 4.Pazos F, Ranea JA, Juan D, Sternberg MJ. Assessing protein co-evolution in the context of the tree of life assists in the prediction of the interactome. J. Mol. Biol. 2005;352(4):1002–1015. doi: 10.1016/j.jmb.2005.07.005. [DOI] [PubMed] [Google Scholar]
- 5.Karimpour-Fard A, Hunter L, Gill RT. Investigation of factors affecting predictions of protein-protein interaction networks by phylogenetic profiling. BMC Genomics. 2007;8:393. doi: 10.1186/1471-2164-8-393. [DOI] [PMC free article] [PubMed] [Google Scholar]
- 6.Li B, Gerdes JM, Haycraft J, Fan Y, Teslovich TM, May-Simera H, Li H, Blacque O, Li L, Leitch CC, et al. Comparative Genomics Identifies a Flagellar and Basal Body Proteome that Includes the BBS5 Human Disease Gene. Cell. 2004;117(4):541–552. doi: 10.1016/s0092-8674(04)00450-7. [DOI] [PubMed] [Google Scholar]
- 7.Li BJ, Zhang M, Dutcher SK, Stormo GD. Procom: a web-based tool to compare multiple eukaryotic proteomes. Bioinformatics. 2005;21(8):1693–1694. doi: 10.1093/bioinformatics/bti161. [DOI] [PubMed] [Google Scholar]
- 8.Sun J, Xu J, Liu Z, Liu Q, Zhao A, Shi T, Li Y. Refined phylogenetic profiles method for predicting protein-protein interactions. Bioinformatics. 2005;21(16):3409–3415. doi: 10.1093/bioinformatics/bti532. [DOI] [PubMed] [Google Scholar]
- 9.Cokus S, Mizutani S, Pellegrini M. An improved method for identifying functionally linked proteins using phylogenetic profiles. BMC Bioinformatics. 2007;8 Supp. 4:S7. doi: 10.1186/1471-2105-8-S4-S7. [DOI] [PMC free article] [PubMed] [Google Scholar]
- 10.Barker D, Meade A, Pagel M. Constrained models of evolution lead to improved prediction of functional linkage from correlated gain and loss of genes. Bioinformatics. 2007;23(1):14–20. doi: 10.1093/bioinformatics/btl558. [DOI] [PubMed] [Google Scholar]
- 11.Keeling PJ, Burger G, Durnford DG, Lang BF, Lee RW, Pearlman RE, Roger AJ, Gray MW. The tree of eukaryotes. Trends Ecol.Evol. 2005;20(12):670–676. doi: 10.1016/j.tree.2005.09.005. [DOI] [PubMed] [Google Scholar]
- 12.Feng D, Doolittle RF. Converting Amino Acid Alignment Scores into Measures of Evolutionary Time: A Simulation Study of Various Relationships. J. Mol. Evol. 1997;44:361–370. doi: 10.1007/pl00006155. [DOI] [PubMed] [Google Scholar]
- 13.Desper R, Gascuel O. Fast and accurate phylogeny reconstruction algorithms based on the minimum evolution principle. J. Comp. Biol. 2002;9:687–705. doi: 10.1089/106652702761034136. [DOI] [PubMed] [Google Scholar]
- 14.Pazour GJ, Agrin N, Leszyk J, Witman GB. Proteomic analysis of a eukaryotic cilium. J. Cell Biol. 2005;170(1):103–113. doi: 10.1083/jcb.200504008. [DOI] [PMC free article] [PubMed] [Google Scholar]
- 15.Duquesnoy P, Escudier E, Vincensini L, Freshour J, Bridoux A, Coste A, Deschildre A, de Blic J, Legendre M, Montantin G, et al. Loss-of-Function Mutations in the Human Ortholog of Chlamydomonas reinhardtii ODA7 Disrupt Dynein Arm Assembly and Cause Primary Ciliary Dyskinesia. Am. J. Human Genetics. 2009;85(6):890–896. doi: 10.1016/j.ajhg.2009.11.008. [DOI] [PMC free article] [PubMed] [Google Scholar]
- 16.Omran H, Kobayashi D, Olbrich H, Tsukahara T, Loges NT, Hagiwara H, Zhang Q, Leblond G, O’Toole E, Hara C, et al. Ktu/PF13 is required for the cytoplasmic pre-assembly of axonemal dyneins. Nature. 2008;456:611–616. doi: 10.1038/nature07471. [DOI] [PMC free article] [PubMed] [Google Scholar]
- 17.Yau WL, Lung HL, Zabarovsky ER, Lerman MI, Sham JS, Chua DT, Tsao SW, Stanbridge EJ, Lung ML. Functional studies of the chromosome 3p21.3 candidate tumor suppressor gene BLU/ZMYND10 in nasopharyngeal carcinoma. Int. J. Cancer. 2006;119:2821–2826. doi: 10.1002/ijc.22232. [DOI] [PubMed] [Google Scholar]
- 18.Wiseman BS, Sternlicht MD, Lund LR, Alexander CM, Mott J, Bissell MJ, Soloway P, Itohara S, Werb Z. Site-specific inductive and inhibitory activities of MMP-2 and MMP-3 orchestrate mammary gland branching morphogenesis. J. Cell Biol. 2003;162(6):1123–1133. doi: 10.1083/jcb.200302090. [DOI] [PMC free article] [PubMed] [Google Scholar]
- 19.Rundhaug JE. Matrix metalloproteinases and angiogenesis. J. Cell Mol. Med. 2007;9(2):267–285. doi: 10.1111/j.1582-4934.2005.tb00355.x. [DOI] [PMC free article] [PubMed] [Google Scholar]
- 20.Gabison EE, Hoang-Xuan T, Mauviel A, Menashi S. EMMPRIN/CD147, an MMP modulator in cancer, development and tissue repair. Biochimie. 2005;87:361–368. doi: 10.1016/j.biochi.2004.09.023. [DOI] [PubMed] [Google Scholar]
- 21.Lichtinghagen R, Michels D, Haberkorn CI, Arndt B, Bahr M, Flemming P, Manns MP, Boeker KHW. Matrix metalloproteinase (MMP)-2, MMP-7, and tissue inhibitor of metalloproteinase-1 are closely related to the fibroproliferative process in the liver during chronic hepatitis C. J. Hepatology. 2001;34(2):239–247. doi: 10.1016/s0168-8278(00)00037-4. [DOI] [PubMed] [Google Scholar]
- 22.Konttinen Y, Ainola M, Valleala H, Ma J, Ida H, Mandelin J, Kinne RW, Santavirta S, Sorsa T, López-Otín C, Takagi M. Analysis of 16 different matrix metalloproteinases (MMP-1 to MMP-20) in the synovial membrane: different profiles in trauma and rheumatoid arthritis. Ann. Rheum. Dis. 1999;58:691–697. doi: 10.1136/ard.58.11.691. [DOI] [PMC free article] [PubMed] [Google Scholar]
- 23.Kurahara S, Shinhara M, Ikebe T, Nakamura S, Beppu M, Hiraki A, Takeuchi H, Sirasuna K. Expression of MMPS, MT-MMP and TIMPs in squamous cell carcinoma of the oral cavity: Correlations with tumor invasion and metastasis. Head & Neck. 1999;21(7):627–638. doi: 10.1002/(sici)1097-0347(199910)21:7<627::aid-hed7>3.0.co;2-2. [DOI] [PubMed] [Google Scholar]
- 24.Rambaut A. FigTree v1.2.2. 2007. tree.bio.ed.ac.uk/software/figtree. [Google Scholar]


