Abstract
Radiofrequency (RF) ablation uses RF current to heat and kill cancer applied via an electrode inserted under image-guidance, and is in clinical use for tumors in liver, lung kidney, and bone. Mathematical models are frequently used to determine tissue temperature during RF ablation, but most prior models do not include accurate implementation of power control algorithms as are used in clinical devices. We created a computer model employing the Finite Element Method, and implemented a clinically used impedance control algorithm. We assumed a rapid increase in tissue electrical conductivity upon vaporization to approximate tissue vapor formation and allow impedance control. We performed ex vivo tissue experiments where we measured the tissue temperature and impedance to validate the computer models. Impedance and temperature time course were comparable between model and experiments, and deviations are likely due to inaccurate data on temperature dependence of tissue properties. Ablation zone diameter was 33 mm in the computer model, and 29 ± 3 mm in the experiments. Our computer model may more accurately allow tissue temperature calculation via including power control algorithms as used in clinical devices.
Index Terms: radiofrequency ablation, tumor ablation, bioheat transfer
I. INTRODUCTION
Radiofrequency (RF) ablation employs electric current in the radiofrequency range (450 – 500 kHz) to heat, and destroy cancer tissue. It is in clinical use for treatment of primary and metastatic liver tumors, as well as tumors in kidney, lung, bone, and adrenal gland tissue [1–6]. During RF ablation, an electrode is inserted into the tumor under imaging guidance (typically CT or Ultrasound), and tissue surrounding the electrode is heated and destroyed.
A number of prior studies have used Finite Element Method (FEM) models to examine tissue heating during radiofrequency ablation [7–13]. One shortcoming of prior models is that they do not accurately reproduce the power control algorithms used in clinical devices. Clinical devices adjust applied power either dependent on temperature measured by sensors integrated into the electrode (temperature control), or based on tissue impedance measured between electrode and ground pad (impedance control). Here, we implemented an impedance control algorithm as used in clinical devices and validated tissue temperature and impedance from an experimental study.
II. MATERIALS AND METHODS
A. Computational Modeling
Equations for Calculation of Electric Field and Temperature
When alternating electric fields are applied to resistive materials (like tissue), heating occurs due to both conduction losses (resistive heating from ion movement) and dielectric losses (caused by the rotation of molecules in the alternating electric field). However, in the frequency range below ~1 MHz, dielectric losses are negligible [7], and therefore we only consider resistive heating in this model.
During RF ablation a certain voltage is applied to the electrode. The resulting electric field in the tissue from the Laplace’s equation:
| (1) |
where σ is the electrical conductivity of the material (S/m) and V is the electric potential (V). The electric field intensity E (V/m) and current density J (A/m2) are then computed from:
| (2) |
| (3) |
The local power density resulting in tissue heating is the product of current density J and electric field intensity E, which is then used to calculate the temperature distribution via the heat-transfer equation:
| (4) |
where ρm is the mass density of the material (kg/m3), c is the specific heat of the material (J/(kg·K)), and k is the thermal conductivity of the material (W/(m·K)). Table I shows the material properties used in these equations.
TABLE I.
Material Properties Used In FEM
| Element | Material | ρ [kg/m3] |
c [J/kg·K] |
k [W/m·K] |
σ [S/m] (at 25 °C) |
|---|---|---|---|---|---|
| RF electrode | Stainless steel | 21500 | 132 | 71 | 4·106 |
| Probe shaft | Polyurethane | 70 | 1045 | 0.026 | 10−5 |
| Tissue | Liver | 1060 | 3600 | 0.512 | 0.333 |
Model Geometry
We created an axisymmetric FEM model for a cooled needle electrode (1.25 mm diameter) with 3 cm exposure. The electrode was placed within a cylinder of liver tissue (200 mm diameter, 170 mm height). We used material properties as shown in Table I, and assumed temperature dependent electrical conductivity with a temperature coefficient of 2%/°C [14]. If temperature rose above 100 °C, we assumed a rapid drop in electrical tissue conductivity by a factor of 10,000 between 100 °C and 102 °C. This is to emulate vaporization where gas forms and creates an electrically insulating layer. In addition we applied latent heat associated with water vaporization of 2,257 J/kg, once tissue reached 100 °C. We set the initial temperature of the liver tissue and temperature at the boundary of the model to 25 °C; this is also the initial temperature in the ex vivo experiment. We simulated probe cooling by assigning the water temperature (20 °C) as a boundary condition to the probe, i.e. the probe is kept at constant temperature assuming high water flow rate, and simulated impedance-controlled ablation for 12 min. Constant voltage was applied to the probe throughout the simulation. Dissipated power was 40 W at the start of the simulation and applied voltage was 50 V throughout the whole ablation procedure. Ground potential (0 V) was assigned to the model boundaries. Once impedance rose above the threshold (20 Ω above baseline value), power was shut down for 15 s, and then re-applied. This scheme was repeated until the 12 min ablation time was completed. This is an approximation of the actual algorithm used by one of the clinically used generators [15]. The ablation zone size was determined using the 50 °C margin (i.e. tissue above 50 °C is considered destroyed). The model consisted of ~35,000 triangular elements and ~18,000 nodes. I used anisotropic mesh. Mesh size was 0.1 mm next to the electrode, where high electric and thermal gradients occur, and 1 mm at the model boundaries. We performed convergence tests to ensure that the mesh is sufficiently small. Time steps started at 0.05 s and were automatically controlled so that temperature increase at any node was below 3 °C between steps.
We used PATRAN Version 2005 (The MacNeal-Schwendler Co., Los Angeles, CA) to generate the geometric models, assign material properties, assign boundary conditions and perform meshing. We then performed a coupled thermo-electrical analysis using the FEM software ABAQUS 6.5 (Hibbitt, Karlsson & Sorensen, Inc., Pawtucket, RI).
B. Ex-vivo Validation
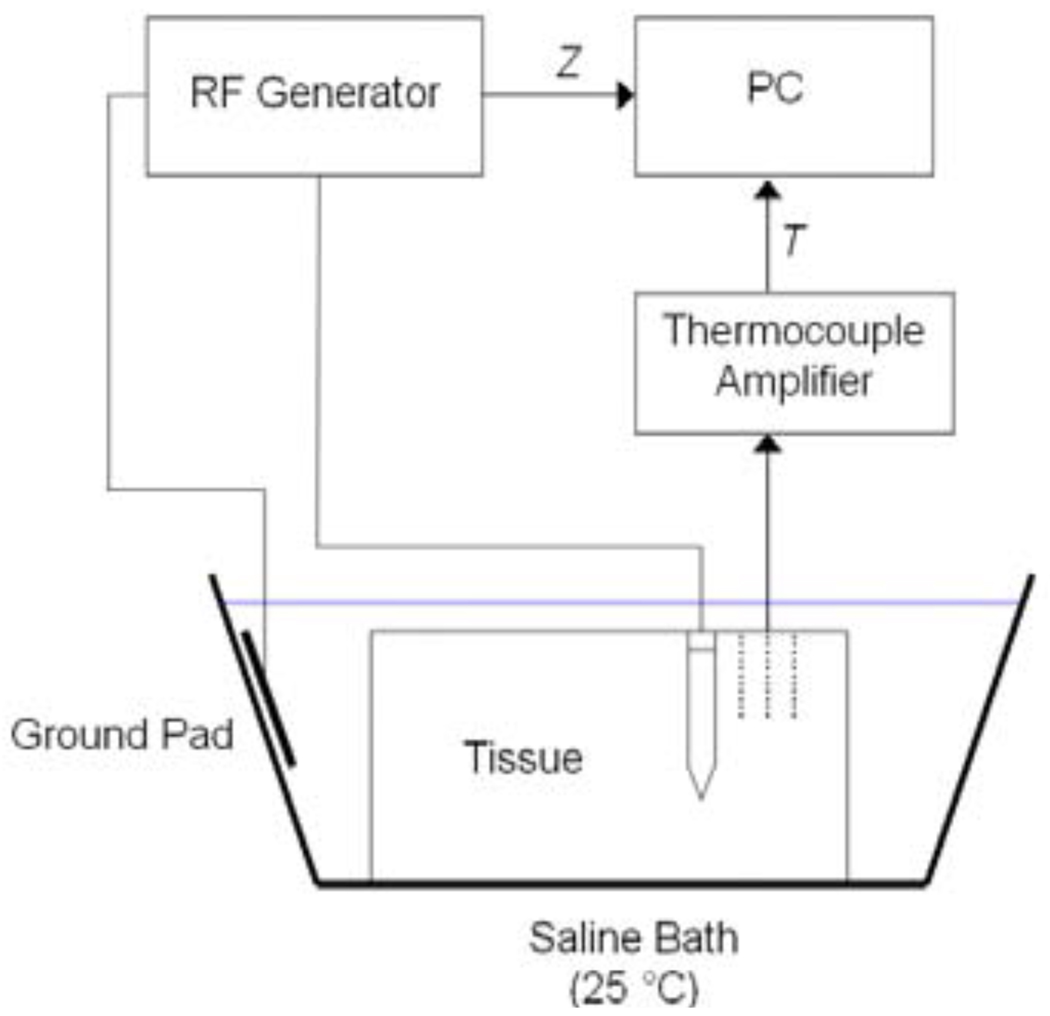
We acquired two pieces of fresh bovine liver from a local butcher, immersed the tissue in 0.9% saline solution and waited until the liver was at room temperature (25 °C). We then placed a cooled needle electrode with 3 cm active length into the liver at 5 cm depth. Aluminum foil was located at least 50 cm away from the electrode as a dispersive electrode (Fig. 1). The ablation electrode was perfused with room temperature water for cooling. We performed impedance-controlled RF ablation for 12 min and set the initial power to 40 W, as in the FEM models; constant voltage was applied throughout the ablation procedure. In in vivo settings, higher power is used; however, since no blood-mediated cooling was present in the ex vivo experiment, 40 W was sufficient. We created a total of 12 ablations with minimum distance of 7 cm between the ablations in same tissue samples. After ablation, we sliced the tissue perpendicular to the direction of electrode insertion. The ablation zone can be optically identified as a light brown, pale region. We selected the slice where the ablation zone was largest, and determined average lesion diameter by optical inspection. During each of the experiments we recorded impedance Z between RF probe and ground pad as well as temperature T at 3 different distances of 10, 15, and 20 mm with thermocouples.
Fig. 1.
Experimental setup employed for validation of computational models
III. RESULTS
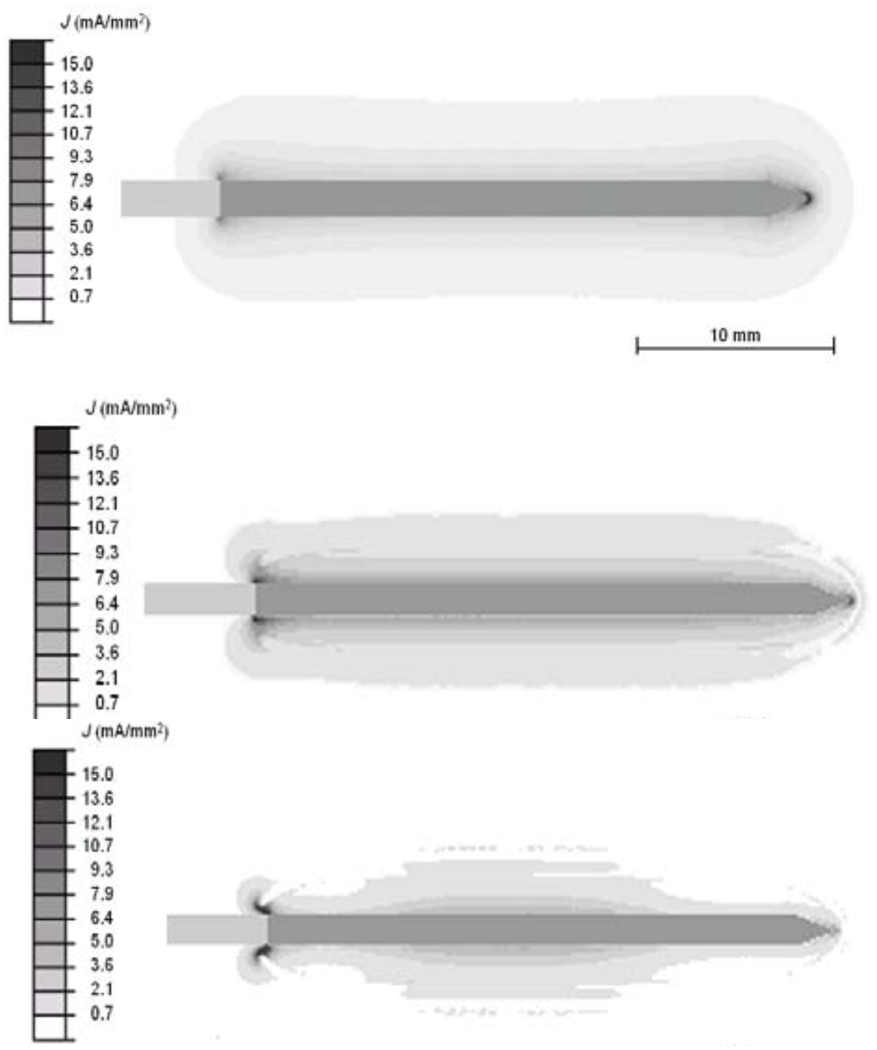
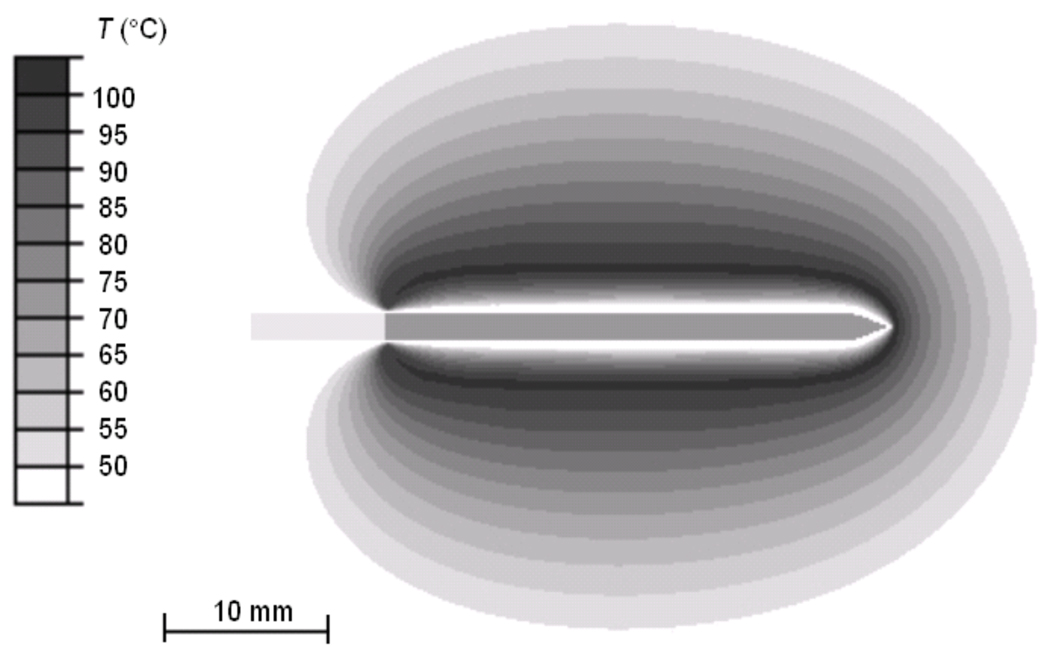
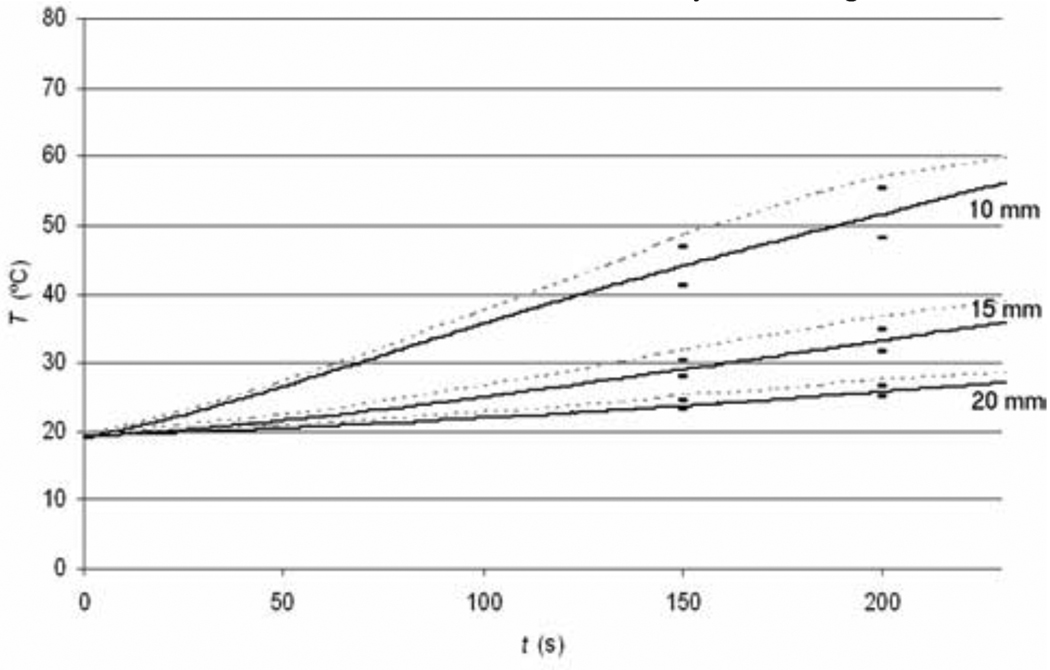
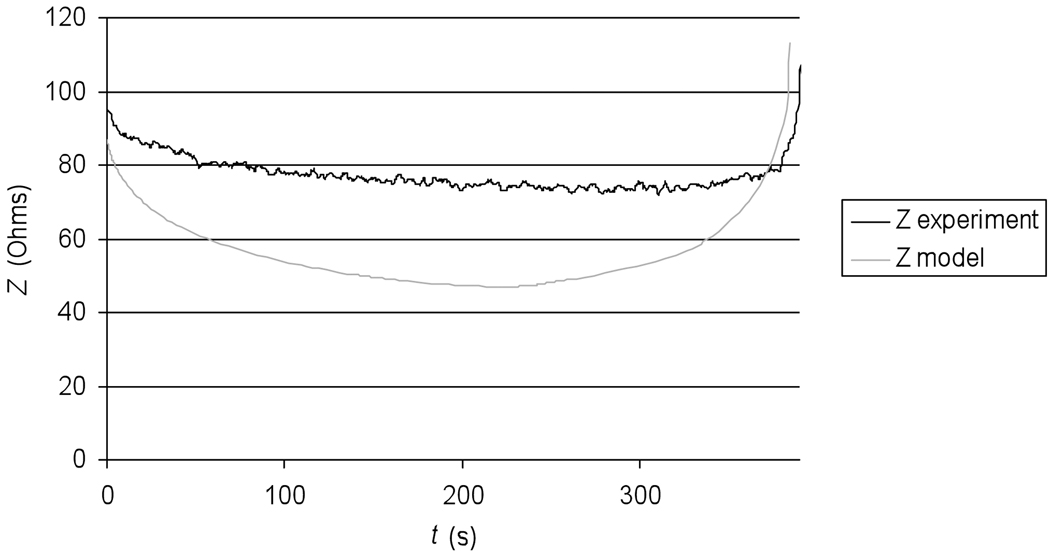
Figure 2 shows the current density profile at the beginning of the ablation procedure, as well as after 4 min and after 6 min where tissue vaporization occurs and as a result the current density drops in these regions. Figure 3 shows the temperature profile after the 12 min ablation simulation. Figure 4 shows the temperature time course at 10, 15, and 20 mm distance from the electrode axis, both for the FEM model and the ex vivo experiment. Figure 5 shows the impedance measured between the RF probe and ground, both for the FEM model and the ex vivo experiment. The ablation zone diameter in the FEM model was 33 mm, the diameter in the ex vivo experiment was 29 ± 3 mm.
Fig. 2.
Electrical current density at beginning of ablation (top), after ~4 min (middle), and after ~6 min (bottom). Tissue vaporization around the electrode results in reduced current density, and heating.
Fig. 3.
Temperature profile from computer simulation after 12 min ablation. RF electrode is located in the center, with electrically active region in dark.
Fig. 4.
Tissue temperature at 10, 15 and 20 mm distance from the electrode in computer simulations (dotted lines) compared to experimental results (solid lines).
Fig. 5.
Tissue Impedance Z compared between experiment (black curve), and model (gray curve).
IV. DISCUSSION
We developed a FEM computer model of a commercially available cooled needle RF ablation device, and implemented the impedance control algorithm as it is used in the commercial device. The impedance control algorithm controls applied RF power based on the change of impedance between the RF probe and the ground pad. Constant voltage is applied to the RF probe, and when tissue temperature exceeds 100 °C, vaporization and gas formation takes place in the tissue surrounding the probe, and results in an impedance rise (Fig. 2). RF power is applied until the impedance rises 20 Ohms above baseline value (i.e. impedance at the beginning of the ablation procedure). Once this impedance threshold is exceeded, power is turned off for 15 s. During this time of tissue cooling, vapor and gas settle down, and impedance returns close to baseline value. After 15 s, RF power is re-applied until the impedance threshold is exceeded again, or until the end of the 12 min treatment cycle is reached. To implement impedance control in the model, we have to include in the model how the electrical tissue conductivity changes once the tissue reaches 100 °C. Here, we assumed that tissue exhibits electrically insulating behavior above 100 °C, and has a very low electrical conductivity comparable to air. We calculated the impedance in the model between the RF electrode and the ground pad, and used this value for impedance control in the same way as it is used in the commercial device. To validate this assumption in the computer model, we compared the impedance as measured during the ex vivo experiments to the impedance calculated in the computer model. Figure 5 compares the impedance of experiment and model. The initial impedance values are comparable with 95 Ohms in the experiment and 87 Ohms in the model. As the tissue heats up during the ablation procedure, tissue becomes more electrically conductive and impedance decreases. However, the decrease in the model is much larger compared to the experiment. Apparently the assumption of a 2%/°C temperature coefficient for electrical conductivity is not sufficiently accurate but unfortunately there is no data currently available in the literature on the temperature dependence of electrical conductivity; knowledge of this data is necessary for more accurate models. Starting around 300s (5 min) after beginning of the ablation, the impedance begins to rise due to tissue heating above 100 °C, and gas bubble formation. Figure 2 shows how the current density drops within the tissue due to local decrease in electrical conductivity. The rate of impedance rise increases steadily, until the impedance threshold is reached and power is shut down. The impedance rise in experiment and model are comparable, so the simple assumption of how the electric impedance changes once tissue reaches boiling temperature performed satisfactory and allowed us to implement the same impedance control algorithm as is used in the commercial device.
We also compared tissue temperature between model (see Fig. 3) and experiments. Figure 4 shows the temperature time course at 10, 15 and 20 mm distance from the electrode. The experimental temperature values are persistently smaller compared to the values in the model throughout the ablation procedure. One likely reason is the inaccurate temperature dependence of electrical conductivity. In both the model and the experiment we apply constant voltage to the RF probe throughout the procedure; due to the inaccurate temperature dependence of the electrical conductivity, the impedance in the model is much smaller compared to the experimental impedance value. As a consequence more total power is dissipated in the model than in the experiment (P = V2/R), resulting in faster temperature rise. The RF lesion diameter was 4 mm (14 %) larger in the model (33 mm) than in the experiment (29 ± 3 mm), which is a reasonable deviation considering lack of parameter values.
V. CONCLUSION
With a simple assumption of tissue behavior above 100 °C, we were able to implement the impedance control algorithm used in a commercial ablation device in a computer model. Likely due to inaccuracies in the temperature coefficient of electrical conductivity, temperature in the computer model rose faster, and the model overestimated the ablation zone dimensions. Implementation of accurate power control algorithms in models, as used in clinical devices, may allow for more accurate model results.
Acknowledgments
This work was conducted in a facility constructed with support from the National Institutes of Health, Grant Number C06 RR018823 from the Extramural Research Facilities Program of the National Center for Research Resources. In addition this project was supported by NIH Grant Number R01 CA118990 and R21 CA135519.
REFERENCES
- 1.Farrell MA, Charboneau WJ, DiMarco DS, Chow GK, Zincke H, Callstrom MR, Lewis BD, Lee RA, Reading CC. Imaging-guided radiofrequency ablation of solid renal tumors. AJR. 2003;180:1509–1513. doi: 10.2214/ajr.180.6.1801509. [DOI] [PubMed] [Google Scholar]
- 2.Gervais DA, McGovern FJ, Arellano RS, McDougal WS, Mueller PR. Renal cell carcinoma: clinical experience and technical success with radio-frequency ablation of 42 tumors. Radiology. 2003;226:417–424. doi: 10.1148/radiol.2262012062. [DOI] [PubMed] [Google Scholar]
- 3.Mayo-Smith WW, Dupuy DE. Adrenal neoplasms: CT-guided radiofrequency ablation--preliminary results. Radiology. 2004;231:225–230. doi: 10.1148/radiol.2311031007. [DOI] [PubMed] [Google Scholar]
- 4.Neeman Z, Wood BJ. Radiofrequency ablation beyond the liver. Tech. Vasc. Interv. Radiol. 2002;5:156–163. doi: 10.1053/tvir.2002.36419. [DOI] [PMC free article] [PubMed] [Google Scholar]
- 5.Rosenthal DI, Hornicek FJ, Torriani M, Gebhardt MC, Mankin HJ. Osteoid osteoma: percutaneous treatment with radiofrequency energy. Radiology. 2003;229:171–175. doi: 10.1148/radiol.2291021053. [DOI] [PubMed] [Google Scholar]
- 6.Wood BJ, Abraham J, Hvizda JL, Alexander HR, Fojo T. Radiofrequency ablation of adrenal tumors and adrenocortical carcinoma metastases. Cancer. 2003;97:554–560. doi: 10.1002/cncr.11084. [DOI] [PMC free article] [PubMed] [Google Scholar]
- 7.Berjano EJ. Theoretical modeling for radiofrequency ablation: state-of-the-art and challenges for the future. Biomed. Eng. Online. 2006;5:24. doi: 10.1186/1475-925X-5-24. [DOI] [PMC free article] [PubMed] [Google Scholar]
- 8.Chen CC, Miga MI, Galloway RL., Jr Optimizing electrode placement using finite-element models in radiofrequency ablation treatment planning. IEEE Trans. Biomed. Eng. 2009;56:237–245. doi: 10.1109/TBME.2008.2010383. [DOI] [PubMed] [Google Scholar]
- 9.Haemmerich D, Chachati L, Wright AS, Mahvi DM, Lee FT, Jr, Webster JG. Hepatic radiofrequency ablation with internally cooled probes: effect of coolant temperature on lesion size. IEEE Trans. Biomed. Eng. 2003;50:493–500. doi: 10.1109/TBME.2003.809488. [DOI] [PubMed] [Google Scholar]
- 10.Haemmerich D, Wood BJ. Hepatic radiofrequency ablation at low frequencies preferentially heats tumour tissue. Int. J. Hyperthermia. 2006;22:563–574. doi: 10.1080/02656730601024727. [DOI] [PMC free article] [PubMed] [Google Scholar]
- 11.He X, McGee S, Coad JE, Schmidlin F, Iaizzo PA, Swanlund DJ, Kluge S, Rudie E, Bischof JC. Investigation of the thermal and tissue injury behaviour in microwave thermal therapy using a porcine kidney model. Int. J. Hyperthermia. 2004;20:567–593. doi: 10.1080/0265673042000209770. [DOI] [PubMed] [Google Scholar]
- 12.Liu Z, Ahmed M, Sabir A, Humphries S, Goldberg SN. Computer modeling of the effect of perfusion on heating patterns in radiofrequency tumor ablation. Int. J. Hyperthermia. 2007;23:49–58. doi: 10.1080/02656730601094415. [DOI] [PubMed] [Google Scholar]
- 13.Altrogge I, Preusser T, Kroger T, Buskens C, Pereira PL, Schmidt D, Peitgen HO. Multiscale optimization of the probe placement for radiofrequency ablation. Acad. Radiol. 2007;14:1310–1324. doi: 10.1016/j.acra.2007.07.016. [DOI] [PubMed] [Google Scholar]
- 14.Foster KR, Schwan HP. Dielectric properties of tissues and biological materials: a critical review. Crit Rev Biomed Eng. 1989;17:25–104. [PubMed] [Google Scholar]
- 15.McGahan JP, Dodd GD. Radiofrequency ablation of the liver: Current status. American Journal of Roentgenology. 2001;176:3–16. doi: 10.2214/ajr.176.1.1760003. [DOI] [PubMed] [Google Scholar]


