

Abstract
A data set of 77 genomic mouse/human gene pairs has been compiled from the EMBL nucleotide database, and their corresponding features determined. This set was used to analyze the degree of conservation of noncoding sequences between mouse and human. A new alignment algorithm was developed to cope with the fact that large parts of noncoding sequences are not alignable in a meaningful way because of genetic drift. This new algorithm, DNA Block Aligner (DBA), finds colinear-conserved blocks that are flanked by nonconserved sequences of varying lengths. The noncoding regions of the data set were aligned with DBA. The proportion of the noncoding regions covered by blocks >60% identical was 36% for upstream regions, 50% for 5′ UTRs, 23% for introns, and 56% for 3′ UTRs. These blocks of high identity were more or less evenly distributed across the length of the features, except for upstream regions in which the first 100 bp upstream of the transcription start site was covered in up to 70% of the gene pairs. This data set complements earlier sets on the basis of cDNA sequences and will be useful for further comparative studies.
[This paper contains supplementary data that can be found at http://www.genome.com.]
Comparative analysis of genomic sequences is becoming increasingly important as a tool to elucidate coding and regulatory regions in genomic DNA. Several comparative studies have been done on large sequence regions of human and various species (summarized in Hardison et al. 1997). It is evident from these studies that coding regions are generally well conserved. Most protein sequences are easily alignable at least as far back in evolution as the split between fish and higher vertebrates (450 Myr), and at that distance splicing patterns are largely conserved (Elgar 1996). Noncoding regions, on the other hand, show a much more varying degree of conservation. Some regions appear to be drifting randomly, whereas others are conserved by selective pressure. Evolutionary distances on the order of 50–100 Myr such as mouse to human (80 Myr; Li and Graur 1991) can reveal functionally conserved regions among nonconserved sequences. The use of phylogenetic comparisons to reveal conserved functional elements has been termed phylogenetic footprinting (Tagle et al. 1988). Reasons for conservation of noncoding regions include that these regions are important for regulating gene expression, maintaining the structural organization of the genome, and contributing to other hitherto-unknown functions of the chromosomes (Koop and Hood 1994).
Because of the value of genome sequence comparisons in identifying such functional regions and the importance of the mouse as a genetic model system in its own right, plans are under way for large-scale sequencing of the mouse genome (Collins et al. 1998). To make maximal use of the sequence comparisons that will result, we need tools and a background base line from existing data. Although comparative studies of noncoding regions of genomic DNA have been done among mammals and birds, amphibians, and fishes (Duret et al. 1993, Duret and Bucher 1997), and at the cDNA level two, large studies of the conservation between human and rodent sequences have been made (Makalowski et al. 1996; Makalowski and Boguski 1998), there is no corresponding analysis for genomic DNA between mouse and human. Tools that are available for analyzing noncoding conservation include, for example, percent identity plots (PIPs) (Oeltjen et al. 1997).
As mentioned above, a number of studies have been done on orthologous genes or regions (for review, see Hardison et al. 1997). Here we bring together in a consistent data set many of these genes as well as other genomic sequences available in the public nucleotide sequence databases from mouse and human. Seventy-seven orthologous mouse/human gene pairs were compiled from the European Molecular Biology Laboratory (EMBL) nucleotide database. The noncoding regions of these gene pairs have been analyzed with a new alignment algorithm that allows us to find conserved regions.
RESULTS
Data Set
A data set of 77 mouse–human gene pairs was compiled from the EMBL nucleotide database (Stoesser et al. 1998) release 55, as outlined in Methods. The lower size limit for the mouse genomic sequences was arbitrarily set to 7 kb. The genes range in size from 994 to 41.8 kb for mouse (average length = 7902 bp, s.d. = 6391) and from 1148 to 37.7 kb for human (average length = 8446 bp, s.d. = 7124). The number of exons range from 1 to 41 per/gene (average = 8.4, s.d. = 6.9). Aligning the coding exons and amino acid translations with the ALIGN program from the FASTA package (Pearson and Lipman 1988) shows that the coding regions of these genes are on average 82% identical at the DNA level and 81% at the amino acid level (data not shown), similar to the levels found in a previous comparative study of a large set of human–mouse mRNAs (Makalowski et al. 1996). The 77 gene pairs are unique, with the exception of the mouse H2-Mb1 and H2-Mb2 genes, which are the results of a probable gene duplication of the ortholog to the human DMB gene.
Noncoding regions were divided into upstream regions, 5′-untranslated exons (5′ UTRs), introns, and 3′ UTRs. The positions of introns, 5′ UTRs, and 3′ UTRs were taken from the feature tables of the EMBL entries. An automatic method was used to pair up corresponding features from the mouse and human entries, and these pairings were then verified manually. Because of the varying quality of annotations in different entries, a fair amount of work went into confirming the locations of corresponding features. Occasionally, cDNA sequences for the genes were consulted to determine the positions of 5′ and 3′ UTRs. Upstream regions were defined as the region up to 1000 bp, but no less than 500 bp, upstream of the start of the 5′ UTR or up to the start or end of another gene’s UTR.
Aligning of Noncoding Regions
To estimate the degree of conservation of noncoding regions between mouse and human genes, we decided to develop a new alignment algorithm that would find conserved colinear blocks in two DNA sequences. Comparisons of functionally conserved regions of DNA sequence, such as potential transcriptional regulatory regions, pose particular problems for standard algorithms. Our limited knowledge of the transcription machinery suggests that one should observe the following features in comparing a functionally conserved region in two species. (1) The conservation of small motifs in the DNA sequence. This conservation might not be absolute and could potentially contain mismatches and insertions in the compared sequences. These regions would represent potential trans-acting factor binding sites, for example, transcription factor binding sites. (2) The appearance of large pieces of unrelated DNA sequence due to random insertions of base pairs or larger structures (e.g., repeats) in one species compared with another. (3) An unclear role for the relative positioning of the conserved motifs relative to each other, as, for example, in some promoters the position is important for function, whereas in other promoters, the transcription factors can seemingly act in many positions and either orientation. It is particularly unclear in two syntenous regions whether the relative positioning of motifs is conserved or not, whatever the functional dependency on the positioning.
Standard alignment algorithms, which were designed primarily for protein coding regions, such as Needleman and Wunsch (1970) or Smith and Waterman (1981), give very unintuitive results: A high-gap penalty focuses the alignment on one or two regions, whereas a low-gap penalty encourages spurious matching of DNA sequences in clearly unrelated regions. We expected this behavior, as the algorithms were not designed for this problem. Methods based on filtering due to fixed length words, such as the BLAST family, also gave unsatisfactory results; in the ungapped mode they broke motifs at small gaps, whereas when gaps were allowed, it was difficult to prevent the alignments extending into unrelated sequence, particularly between two motifs. Analyzing these results also required complicated post-processing with somewhat arbitrary cutoffs.
We could have tuned the parameters to a gapped BLAST program to alleviate this problem, but instead we developed a custom algorithm, that produced sensible matching regions in syntenous regulatory DNA sequences.
DBA models four different types of conserved blocks, each parameterized by identity–substitution probabilities (Fig. 1). In the default setting, these models correspond approximately to block type A, 60%–70%, block type B, 70%–80%, block type C, 80%–90%; and block type D, 90%–100% identity. Conserved regions are assigned to one of the different types automatically by the algorithm when the two DNA sequences are aligned, according to which substitution model fits best. The output of DBA therefore not only identifies discrete conserved blocks but also classifies them into four levels of conservation.
Figure 1.

Finite state model of the DBA algorithm. States are represented by labeled circles, transitions between states are represented by arrows. Emission probability values within brackets indicate the default parameters for DBA. The Match A–D states represent conserved regions of 65%, 75%, 85%, and 95% identity, respectively. The two Unmatch states represent large gaps between the conserved blocks. The process starts and ends in the Unmatch states.
As a control for the background level of DBA, all noncoding features were DBA aligned to all other noncoding features of the other species except for the orthologous one. Of 88.5 Mb analyzed, 127.9 kb (0.14%) was covered by alignable blocks of any level of identity (mean length, 33.4; s.d., 33.1; min length, 14; max length, 591). These blocks were often caused by the alignment of low-complexity regions, and others might be real functional elements shared between genes, but this at least provides an upper limit of 0.14% for the background false-positive rate for the DBA method.
The noncoding regions of the 77 mouse/human gene pairs were aligned with the DBA algorithm. Interspersed repeats were masked with RepeatMasker (Smit and Green 1995) before aligning. In all, 35.2 kb of upstream sequences, 9.6 kb of 5′ UTR sequences, 435 kb of intron sequences, and 33.3 kb of 3′ UTR sequences were aligned. Table 1 summarizes the result of the alignment of corresponding features of the gene pairs. For each feature type (upstream region, intron, 5′ and 3′ UTRs) Table 1 shows the fraction of the mouse sequence that is covered by conserved blocks of a certain degree of similarity (A–D), as well as the total fraction covered by conserved blocks.
Table 1.
Fractions of Noncoding Regions Covered by DBA Blocks
 |
 |
Accession numbers for mouse and human genes are available as an online supplement to Table 1 at http://www.genome.org.
Upstream Regions
Upstream regions could be determined for 41 gene pairs. Thirty-six percent of the total length of the upstream regions could be aligned by DBA; 5%, 13%, 14%, and 4% being of the A–D category, respectively (Table 1). For each gene, the fraction covered ranges from 0% to 89% (Table 1; Fig. 2a). The values show a fairly broad distribution with 50% of the values between 20% and 57%, and 80% of the values between 11% and 75%. The length-weighted average of identity, over all block types, is 80.6%.
Figure 2.

DBA coverage and block size distributions. Box plots of DBA block coverage for different noncoding features (a), and DBA block lengths for the different similarity categories A–D (b). The central box depicts the middle half of the data between percentiles 25 and 75; the solid lines indicate the medians of each distribution. The dots indicate extreme values that fall outside of percentiles 10 and 90, respectively.
5′ UTRs
A total of 46 of the genes had defined 5′ UTRs (those shorter than 30 bp were excluded from analysis). Fifty percent of the length of the 5′ UTRs were covered by DBA blocks, 3%, 21%, 14%, and 11% being of the A–D category, respectively (Table 1). For each gene, the fraction covered ranges from 0% to 99% (Table 1; Fig. 2a). The values are broadly distributed with half of the values between 4% and 76%, and 80% of the values between 0% and 90%. The length-weighted average of identity, over all block types, is 82.5%.
Introns
Seventy-five of the 77 gene pairs contained introns. Introns were the least frequently covered feature type, with 23% of the length of the introns covered by DBA blocks, 4%, 11%, 6%, and 1% being of the A–D category, respectively (Table 1). For each gene, the fraction covered ranges from 0% to 77% (Table 1; Fig. 2a). In contrast to upstream regions and 5′ UTRs, the values are fairly narrowly distributed with half of the values between 15% and 34%, and 80% of the values between 8% and 48%. The length-weighted average of identity, over all block types, is 76.9%.
3′ UTRs
Fifty-one gene pairs had defined 3′ UTRs, and they were the most frequently covered feature type, with 56% of the total length being aligned by DBA blocks 2%, 23%, 22%, and 9% being of the A–D category, respectively (Table 1). For each gene, the fraction covered ranges from 0% to 99% (Table 1; Fig. 2a). Half of the values were between 44% and 82%, and 80% of the values were between 32% and 95%. The length-weighted average of identity, over all block types, is 82.1%.
The distribution of block sizes for the different degrees of similarity are shown in Figure 2b. Perhaps, not surprisingly, blocks with higher similarity are shorter than blocks with lower similarity, although some of the blocks of the highest similarity level are as long as 600 bp.
We also compared the DBA method with simply using the sequence comparison program Wu-BLAST (Gish 1997). Running Wu-BLASTN on corresponding features gives results of fractions similar to those covered in DBA alignment methods (data not shown), with the exception that BLAST quite often produces overlapping matches that make the results harder to interpret. DBA also divides matches into different levels of identity, which can be useful to allow focusing on more strongly conserved regions. To do this correctly with BLAST would require changing the scoring scheme.
Distribution of Conserved Blocks
We were also interested in determining whether the blocks of similarity were evenly distributed over the length of the noncoding regions. We therefore calculated how often every nucleotide with a certain distance from the start or the end of feature was covered by a DBA block and divided that with how often that nucleotide position occurred in the data set after adjusting for the presence of repeats. The frequency of DBA block coverage and repeat coverage was then plotted against the nucleotide position either from the start or the end of the feature relative to the mouse sequences (Fig. 3).
Figure 3.
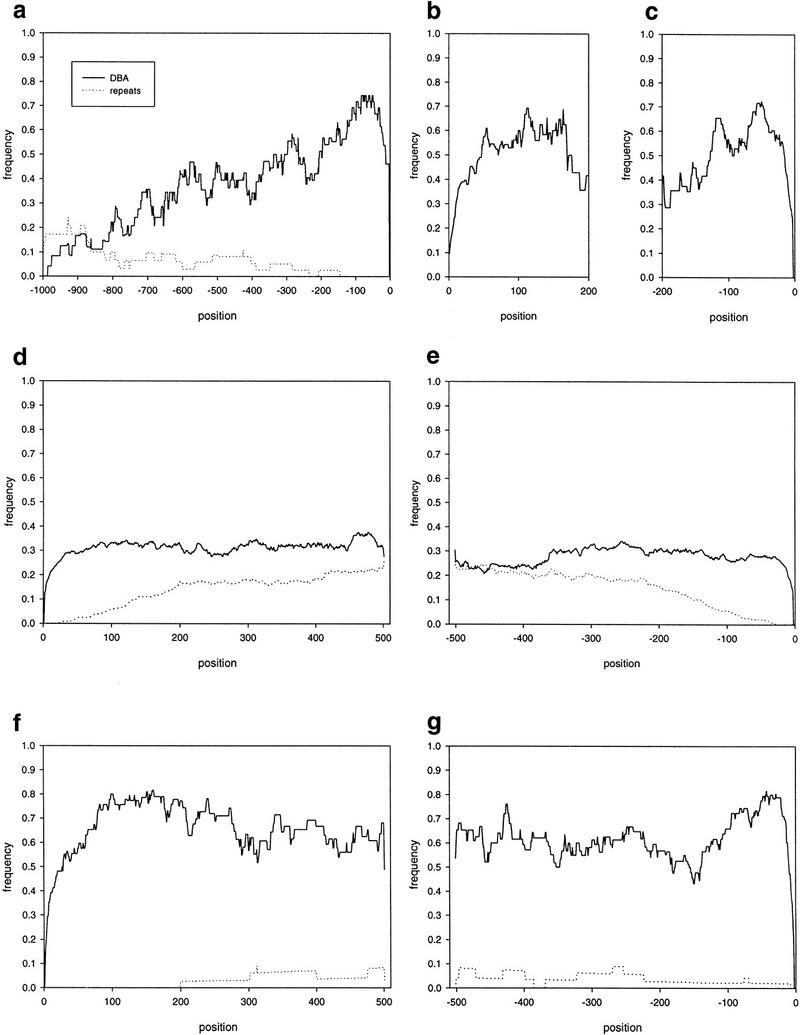
DBA block and repeat coverage of noncoding features. Coverage as a function of positions from the end of the upstream regions (a), the start of the 5′ UTRs (b), the end of the 5′ UTRs (c), the start of the introns (d), the end of the introns (e), the start of the 3′ UTRs (f), and the end of the 3′ UTRs (g) for DBA blocks (solid lines) and repeats (dotted lines) are shown.
The distribution of conserved blocks in the upstream region shows that a high proportion of conserved blocks are located close to the transcription start site (Fig. 3a). There is a peak of coverage frequency reaching >0.7 in the first 150–200 bp. This then drops down to a plateau of ∼0.35, which is about the average coverage level (see Table 1), between nucleotides −200 to −600, and finally to a coverage frequency of ∼0.1 at around nucleotide −800. The first 150 bp is void of repeats, which then gradually increase to a coverage frequency of ∼0.15 around nucleotides −900.
As few 5′ UTRs were longer than 200 bp, we only analyzed the distribution of DBA blocks over the first 200 bp from the start and end of the 5′ UTRs (Fig. 3b,c). At both ends, the coverage frequencies reach above the average 0.5 (Table 1) within the first 100 bp, although they peak earlier at the 3′ end close to the translation start site. At the 5′ end, this level is maintained through most of the 200 bp analyzed, whereas the 3′ end drops down to 0.4 in the range between nucleotides −100 to nucleotides −200. The 5′ UTRs in this set of sequences did not contain any repeats as determined by RepeatMasker.
For introns, the coverage is fairly evenly distributed across the feature at ∼0.3 (Fig. 3d,e), which is slightly above the average 0.23 (see Table 1). Looking at the 3′ end of the introns (Fig. 3d), the coverage drops down to the average level at around nucleotides 360. The distribution of repeats in the introns does not vary across the introns, except at the ends. However, this drop in coverage at the ends is what could be expected if repeats were inserted with the same probability at all positions of the introns. Theoretically, if repeats were of uniform length and inserted with the same probability at all positions, there would be gradual increase of coverage to the position in the intron that is equal to the repeat length, after which the coverage curve would flatten out. In reality, the repeat lengths are not uniform, which causes a slight rounding of the line, although there is a tendency of shoulder in the curves at around nucleotides 200. The average repeat length in the introns is 158 bp, so there is an indication that there might be an under-representation of repeats at the ends of introns. This, however, is hardly significant.
The 3′ UTRs exhibit the most conserved parts of any of the noncoding features, with coverage frequencies reaching as high as 0.8 (Fig. 3f,g). At the 5′ end there is a plateau at ∼0.8 that stretches from nucleotides 100 to 200. It then drops slightly but stays well above the average 0.56 (Table 1) throughout the 500 bp from the stop codon. At the 3′ end, the coverage frequency peaks at around nucleotides −40 and then drops to the average level during the next 100 bp. The 5′ end is devoid of repeats for the first 200 bp, after which there is a low level of repeat coverage. At the 3′ end, there are repeats throughout the 500 bp upstream of the polyadenylation site, although at a level slightly lower than during the first 200 bp.
CpG Islands
We also investigated the presence of CpG islands among the genes in the mouse/human data set using the definition of a CpG island as described by Gardiner-Garden and Frommer (1987) (see Methods). Nineteen mouse (46%) and 25 human (61%) of the 41 genes with defined upstream regions contained CpG islands predicted by the CpG program (as outlined in Methods). This is similar to earlier estimates of CpG islands in mouse (45%) and human (56%) genes made by Antequera and Bird (1993), and suggests that at least in this regard the data set is a fairly representative set of mammalian genes. Two mouse genes and seven human genes contained more than one CpG island. Of the human genes corresponding to the 19 mouse genes with CpG islands, 18 contained CpG islands. The CpG islands found range in size from 213 to 2036 bp for the mouse genes, with an average of 737 bp (s.d. = 458). For the human genes, sizes ranged from 213 to 2764 bp, with an average size of 765 bp (s.d. = 636). In the mouse genes, 90% (19/21), and in the human genes 65% (22/34) of the CpG islands overlapped the upstream region, 5′ UTR, or the first coding exon of the genes.
DISCUSSION
The aim of this study was to make an assessment of the conservation of noncoding regions of orthologous mouse/human genes. Unlike coding regions that are readily alignable over their entire length because of the evolutionary pressure to preserve the coding capacity, noncoding regions are under less evolutionary pressure and often insensitive to large insertions and deletions, as well as evolutionary drift, which makes them less alignable over their entire length in any meaningful sense. Because of the nature of noncoding regions, we chose to express the degree of conservation between noncoding parts of mouse/human orthologous genes as the length fraction that could be aligned in blocks with an identity higher than 60%, allowing short gaps within blocks.
Can we estimate which regions of homology are conserved because of functional constraints and which are conserved because of lack of time of divergence? The mutation rate for neutral DNA sequences has been estimated to be 0.5% per site per million years (Li et al. 1985). With an estimated divergence time between rodents and human of 80 Myr, two DNA sequences that are under no selective pressure can be estimated to be 51% identical, by the Jukes–Cantor equation (Jukes and Cantor 1969). By use of simple simulations with random sequences of ∼50% identity, very low (<0.5%) random coverage by blocks of the B–D varieties were observed (data not shown). Blocks of the A type showed a higher random coverage (8%). We therefore believe that blocks of the B–D types are conserved because of functional constraint, and probably some of the A type as well, although how large a fraction this is, is difficult to estimate. The type B–D blocks are then likely to have a functional role, for example, in gene regulation. We believe that the comparative analysis of vertebrate genomic sequences will become increasingly more important as a tool to help identify not only coding region structures but also, and maybe more importantly, regions that are important for regulation of gene expression.
Of the noncoding features examined in this study, the transcribed regions, particularly the 3′ UTRs, were the most conserved, with 56% of the 3′ UTRs being covered by alignable blocks and 50% of the 5′ UTRs. The lower frequency of coverage of the 5′ UTRs might in part be due to the difficulty of definitely defining their boundaries. Introns were the noncoding feature type with the lowest coverage, 23%, being aligned in DBA blocks. If we assume that the conservation we have observed is due to functional selection, it means that on average 19% (excluding the type A blocks) of intron sequences have some functional role; a portion of that is signals involved in regulating splicing, but at least in some cases these conserved regions have been shown to be involved in the regulation of gene expression (Oeltjen et al. 1997). About one-third (36%) of the upstream regions could be aligned with the DBA method. Looking at the distribution of the aligned blocks, it is evident that the first 100–150 bp upstream of the transcription start site is conserved most frequently. The absence of repeats in this region supports this hyposthesis. Not as evident is any positional bias of conservation for the other types of noncoding features. However, in the 3′ UTRs the low levels of repeats at the beginnings and ends indicate that these regions close to the edges might be more sensitive to disruption by the insertion of repeats.
Is this data set representative of vertebrate genes? We believe that it is fairly representative, on the basis of the fact that the average identity of the coding regions is similar to what has been reported earlier for a much larger data set of mouse/human mRNA sequences (Makalowski 1996), and that the fraction of CpG island-containing genes is similar to earlier estimates (Antequera and Bird 1993). The data set might be biased toward gene-dense regions, as 21 of the genes come from two regions, (accession nos. U58105–U78027 and AC002397–U47924) that have been described as such (Oeltjen et al. 1997; Ansari-Lari et al. 1998). In fact, a majority of the genes have a GC content that would classify them as belonging to GC-rich isochores, which are considered to be gene dense (Bernardi 1993). Seventy-eight percent of the mouse genes and 77% of the human genes have GC content in the third codon position that is >61% and hence belong to the H2 or H3 isochores (Zoubak et al. 1996). The GC content in the third codon position of the mouse genes is on average 65% (s.d. = 0.09), and for human genes 67% (s.d. = 0.11). There is also a strong correlation (0.86) between the GC3 content of the orthologous genes in the different species. The data set is also not entirely nonredundant as a gene duplication of the mouse H2-Mb genes have been compared with the human DMB gene (accession nos. U35323 and X87344), but this should not affect the results significantly. Genes that have very large introns are not represented either, presumably because of a bias against genomic sequencing of such genes. The longest intron in the data set is 12 kb.
PIPs (Oeltjen et al. 1996) provide another method for comparative analysis. They use the SIM program (Huang et al. 1990) to identify ungapped blocks longer than 50 bp with an identity >50%. These blocks are then plotted against the length of one of the sequences. The main difference with the DBA method is that DBA identifies gapped blocks. Also, blocks identified by DBA can be shorter than 50 bp, although their identity will have to be higher to be picked up. Also, potentially long SIM blocks could be split into multiple DBA blocks at different levels of identity, although we have not seen this happen.
It is our hope that this data set will be useful for further comparative studies, and for this reason it is publicly available at http://www.sanger.ac.uk/Software/Alfresco/mmhs.shtml. There is bound to be a certain amount of error introduced into the data by the fact that the feature boundaries defined in the EMBL entries are not always correct. Although a fair amount of work went into checking these coordinates, errors are inevitable. We aim to maintain and expand this resource and would therefore welcome corrections.
METHODS
Data Set
First, a database of human genomic sequences longer than 5 kb was generated. Entries from the human division of the EMBL nucleotide database (release 55) (Stoesser et al. 1998), defined as DNA, and being longer than 5 kb were extracted with the GETZ program (Etzhold et al. 1996). These entries were then converted into BLAST database format (Altschul et al. 1990). Mouse (Mus musculus) genomic entries larger than 7 kb were then extracted from EMBL and searched against the human genomic database with BLASTN (Altschul et al. 1990) to find potentially orthologous genomic sequences. BLAST results were inspected manually by MSPcrunch/Blixem (Sonhammer and Durbin 1994). The descriptions of entries that showed extensive similarity were then inspected, and in some cases the cross references to the Swissprot protein sequence database investigated to determine whether the entries were orthologous. Entries without protein-coding sequence (CDS) tags in their feature table, or cryptic descriptions, such as entries without fully defined CDSs or entries in which extensive alternative splicing was annotated in one species but not in the other, were excluded from analysis. Immunoglobulin and T-cell receptor genes were also excluded, which resulted in a set of 77 orthologous gene pairs. Corresponding features (5′ UTRs, coding exons, introns, and 3′ UTRs) were obtained from the feature tables of the entries. For each gene pair, when possible, an upstream region was also defined as a 500–1000-bp region upstream of the 5′ UTR or the region up to another gene. This data set is available at http://www.sanger.ac.uk/Software/Alfresco/mmhs.shtml.
DBA
The DBA algorithm was implemented with Dynamite (Birney and Durbin 1997), a code generating language developed for dynamic programming algorithms in molecular biology, which allowed us to experiment with different algorithms easily. The final algorithm of choice was developed to satisfy the following criteria: (1) There are conserved regions of differing levels of conservation, being ∼60%–70%, 70%–80%, 80%–90%, and 90%–100% identity in the DNA sequence; (2) these regions can contain small gaps; (3) large gaps can occur between these regions; and (4) conserved regions in a syntenous region from two species occur colinearly. The final criterion is possibly wrong, but makes the construction of the algorithm far simpler.
The algorithm is displayed graphically in Figure 1. A more precise definition of the algorithm, the parameterization of the algorithm and downloadable source code can be found at http://www.sanger.ac.uk/Software/Wise2/dba.shtml.
DBA is provided as ANSI C code and should compile on any system with an ANSI C compiler, and has been tested extensively on common Unix platforms, including Dec Alpha, SGI Irix, RedHat Linux, and Solaris. A web site for testing of DBA is available at http://www.sanger.ac.uk/Software/Wise2/dbaform.shtml.
Aligning of Noncoding Regions
Features were extracted from the EMBL entries with the positions defined in the feature tables. Reciprocal features were aligned with the DBA algorithm by the following parameters: match level A = 0.65, match level B = 0.75, match level C = 0.85, match level D = 0.95, gap probability = 0.05, unmatched probability = 0.99, and block open probability = 0.01. The different match levels chosen will give ranges of similarity between ∼60% and 70%, 70% and 80%, 80% and 90%, and 90% and 100%, respectively.
CpG Islands
The presence of CpG islands was predicted with the program CpG (G. Micklem and R. Durbin, unpubl.). A CpG island was defined as DNA stretch at least 200 bp long with a GC content >50% and an observed-to-expected ratio of CpG dinucleotides >0.6 (Gardiner-Garden and Frommer 1987). Complete gene sequences, from the upstream region to the end of the last coding exon or 3′ UTR, of the 41 gene pairs that had defined upstream regions, were analyzed with CpG.
Acknowledgments
N.J. was supported by a Marie Curie Fellowship grant (contract no. FMBICT961755) from the European Union and by a grant from The Wenner-Gren Foundation. E.B. and R.D. are supported by the Wellcome Trust.
The publication costs of this article were defrayed in part by payment of page charges. This article must therefore be hereby marked “advertisement” in accordance with 18 USC section 1734 solely to indicate this fact.
Footnotes
E-MAIL niclas.jareborg@cgr.ki.se; FAX 46-8-32-39-50.
REFERENCES
- Altschul S, Gish W, Miller W, Meyers E, Lipman D. Basic local alignment search tool. J Mol Biol. 1990;215:403–410. doi: 10.1016/S0022-2836(05)80360-2. [DOI] [PubMed] [Google Scholar]
- Ansari-Lari MA, Oeltjen JC, Schwartz S, Zhang Z, Muzny DM, Lu J, Gorrell JH, Chinault AC, Belmont JW, Miller W, Gibbs RA. Comparative sequence analysis of a gene-rich cluster at human chromosome 12p13 and its syntenic region in mouse chromosome 6. Genome Res. 1998;8:29–40. [PubMed] [Google Scholar]
- Antequera F, Bird A. Number of CpG islands and genes in human and mouse. Proc Natl Acad Sci. 1993;90:11995–11999. doi: 10.1073/pnas.90.24.11995. [DOI] [PMC free article] [PubMed] [Google Scholar]
- Bernardi G. The isochore organization of the human genome and its evolutionary history–A review. Gene. 1993;135:57–66. doi: 10.1016/0378-1119(93)90049-9. [DOI] [PubMed] [Google Scholar]
- Birney E, Durbin R. Dynamite: A flexible code generating language for dynamic programming methods used in sequence comparison. Intell Syst Mol Biol. 1997;5:56–64. [PubMed] [Google Scholar]
- Collins F, Patrinos A, Jordan E, Chakravati A, Gesteland R, Walters L the members of the DOE and NIH planning groups. New goals for the U.S. human genome project: 1998–2003. Science. 1998;282:682–689. doi: 10.1126/science.282.5389.682. [DOI] [PubMed] [Google Scholar]
- Duret L, Bucher P. Searching for regulatory elements in human noncoding sequences. Curr Opin Struct Biol. 1997;7:399–406. doi: 10.1016/s0959-440x(97)80058-9. [DOI] [PubMed] [Google Scholar]
- Duret L, Dorkeld F, Gautier C. Strong conservation of non-coding sequences during vertebrates evolution: Potential involvement in post-transcriptional regulation of gene expression. Nucleic Acids Res. 1993;21:2315–2322. doi: 10.1093/nar/21.10.2315. [DOI] [PMC free article] [PubMed] [Google Scholar]
- Elgar G. Quality not quantity: The pufferfish genome. Hum Mol Genet. 1996;5:1437–1442. doi: 10.1093/hmg/5.supplement_1.1437. [DOI] [PubMed] [Google Scholar]
- Etzold T, Ulyanov A, Argos P. SRS: Information retrieval system for molecular biology data banks. Methods Enzymol. 1996;266:114–128. doi: 10.1016/s0076-6879(96)66010-8. [DOI] [PubMed] [Google Scholar]
- Gardiner-Garden M, Frommer M. CpG Islands in vertebrate genomes. J Mol Biol. 1987;196:261–282. doi: 10.1016/0022-2836(87)90689-9. [DOI] [PubMed] [Google Scholar]
- Gish W. WU-BLAST. 1997. http://blast.wustl.edu/ , at http://blast.wustl.edu/. . [Google Scholar]
- Hardison R, Oeltjen JC, Miller W. Long human-mouse sequence alignments reveal novel regulatory elements: A reason to sequence the mouse genome. Genome Res. 1997;7:959–966. doi: 10.1101/gr.7.10.959. [DOI] [PubMed] [Google Scholar]
- Huang X, Hardison R, Miller W. A space-efficient algorithm for local similarities. Comput Appl Biosci. 1990;6:373–381. doi: 10.1093/bioinformatics/6.4.373. [DOI] [PubMed] [Google Scholar]
- Jukes TH, Cantor CR. Evolution of protein molecules. In: Munro HN, editor. Mammalian protein metabolism. New York, NY: Academic Press; 1969. pp. 21–123. [Google Scholar]
- Koop BF, Hood L. Striking sequence similarity over almost 100 kilobase of human and mouse T-cell receptor DNA. Nat Genet. 1994;7:48–53. doi: 10.1038/ng0594-48. [DOI] [PubMed] [Google Scholar]
- Li W-H, Graur D. Fundamentals of molecular evolution. Sunderland, MA: Sinauer Associates; 1991. [Google Scholar]
- Li W-H, Luo C, Wu C. Evolution of DNA sequences. In: Macintyre RJ, editor. Molecular evolutionary genetics. New York, NY: Plenum Press; 1985. pp. 1–94. [Google Scholar]
- Makalowski W, Boguski M. Evolutionary parameters of the transcribed mammalian genome: An analysis of 2,820 orthologous rodent and human sequences. Proc Natl Acad Sci. 1998;95:9407–9412. doi: 10.1073/pnas.95.16.9407. [DOI] [PMC free article] [PubMed] [Google Scholar]
- Makalowski W, Zhang J, Boguski M. Comparative analysis of 1196 Orthologous mouse and human full-length mRNA and protein sequences. Genome Res. 1996;6:846–857. doi: 10.1101/gr.6.9.846. [DOI] [PubMed] [Google Scholar]
- Needleman S, Wunsch C. A general method applicable to the search for similarites in the amino acid sequences of two proteins. J Mol Biol. 1970;48:443–453. doi: 10.1016/0022-2836(70)90057-4. [DOI] [PubMed] [Google Scholar]
- Oeltjen J, Malley T, Muzny D, Miller W, Gibbs R, Belmont J. Large-scale comparative sequence analysis of the human and murine Bruton’s tyrosine kinase loci reveals conserved regulatory domains. Genome Res. 1997;7:315–329. doi: 10.1101/gr.7.4.315. [DOI] [PubMed] [Google Scholar]
- Pearson W, Lipman D. Improved tools for biological sequence analysis. Proc Natl Acad Sci. 1988;85:2444–2448. doi: 10.1073/pnas.85.8.2444. [DOI] [PMC free article] [PubMed] [Google Scholar]
- Smit A, Green P. RepeatMasker. 1995. http://ftp.genome.washington.edu/RM/RepeatMasker.html , at http://ftp.genome.washington.edu/RM/RepeatMasker.html. . [Google Scholar]
- Smith T, Waterman M. Identification of common molecular subsequences. J Mol Biol. 1981;147:195–197. doi: 10.1016/0022-2836(81)90087-5. [DOI] [PubMed] [Google Scholar]
- Sonnhammer E, Durbin R. A workbench for large scale sequence homology analysis. Comput Appl Biosci. 1994;10:301–307. doi: 10.1093/bioinformatics/10.3.301. [DOI] [PubMed] [Google Scholar]
- Stoesser G, Moseley M, Sleep J, McGowran M, Garcia-Pator M, Sterk P. The EMBL nucleotide sequence database. Nucleic Acids Res. 1998;26:8–15. doi: 10.1093/nar/26.1.8. [DOI] [PMC free article] [PubMed] [Google Scholar]
- Tagle D, Koop B, Goodman M, Slightom J, Hess D, Jones R. Embryonic epsilon and gamma globin genes of a prosimian primate (Galago crassicaudatus) nucleotide and amino acid sequences, developmental regulation and phylogenetic footprints. J Mol Biol. 1988;203:439–455. doi: 10.1016/0022-2836(88)90011-3. [DOI] [PubMed] [Google Scholar]
- Zoubak S, Clay O, Bernardi G. The gene distribution of the human genome. Gene. 1996;174:95–102. doi: 10.1016/0378-1119(96)00393-9. [DOI] [PubMed] [Google Scholar]