Abstract
Objective
Injury during routine spinal cord procedures could result in devastating consequences for the surgical patient. Spinal cord monitoring through somatosensory evoked potentials (SEPs) remains a viable method for prevention of serious injury.
Methods
The adaptive coherence estimation (ACE) is a method to iteratively calculate signal match quality through successive filter entrainment. Here we compare the speed of detection with ACE to conventional amplitude measurements. Both absolute magnitude of ACE and amplitude as well as slope change detector algorithm (Farley-Hinich) was run as well to determine the earliest time when a significant change occurred.
Results
The standard error for the ACE algorithm is close to one tenth of the amplitude measure, Since the ACE algorithm achieved low variance during baseline measurement, we were able to achieve rapid detection of injury. For absolute magnitude detection ACE was faster than amplitude for the 20g injury weight class. It took an average of 10 epochs to detect the injury with adaptive coherence and nearly 19 with standard amplitude metrics using absolute magnitude changes. Abrupt change detection methods using slope change show that ACE provides more favorable detection capabilities comparable to amplitude. Additionally, there was a significant increase in the ROC curve between ACE and amplitude alone (P<0.05).
Conclusions
Because of its excellent detection capabilities, the adaptive coherence method provides an excellent supplement to traditional amplitude for capturing injury-related changes in SEPs.
Significance
Adaptive coherence remains a viable method for rapidly and accurately detecting spinal injury.
Keywords: Somatosensory Evoked Potential, Adaptive Algorithm, Template Matching, Spinal Injury
Introduction
Intraoperative neuromonitoring applies to a variety of tests used during surgery to evaluate the nervous system (Minahan, 2002). In the case of spinal cord surgery, EP evaluation was first used in animal studies in 1972 and was applied to patients by McCallum and Bennett in 1975 (McCallum and Bennett, 1975); (Croft et al., 1972). The primary goal was to serve as an early warning system for a compromise in the somatosensory pathways. Such injury could lead to sensory loss, or worse, to paraplegia. In the past 25 years, the benefits and goals of monitoring have evolved significantly. Now, surgeons look to monitoring for reassurance of the integrity of the spinal cord. Finally, patients and families can be assured that the surgery is not being done “blind” to the potential for paraplegia, and that precautions have been taken (Brown and Nash, 1988; Cracco and Bodis-Wollner, 1986; Grundy, 1983; McPherson, 1993; Nuwer, 1986).
Current intra-operative monitoring techniques measure only the EP signal latency and amplitude while ignoring the fact that the EP signal consists of polyphasic wave forms that reflect different activation and conduction velocities within the spinal cord and corresponding part of the nervous system. Apart from the EP latency and amplitude analysis, some research has utilized spectrum and adaptive analysis (like the adaptive Fourier Linear Combiner) to extract spinal cord injury information (Barros and Ohnishi, 1997; Riviere et al., 1998; Riviere et al., 1997; Vaz and Thakor, 1989). Signal modeling has also been used in EP monitoring in order to augment the signal quality (Davila and Srebro, 2000).
Adaptive signal processing can also be an effective means of detecting spinal cord injury. It uses past signal information and constructs a stable filter to convert one signal to another. Because of its reliance on using the entire signal and past information, consistent estimates of signal integrity are maintained. In this study we propose to utilize the adaptive coherence estimator (ACE) to characterize the transfer function of the neurological system and construct valid relations between the calculation of the neurological system transform function and the physical event of the EP in an intraoperative neurological monitoring paradigm. Coherence is a key component derived from multi-channel spectral estimation. It examines consistency of the linear transfer function estimate between probable input and output signals. If we take the viewpoint of the seminal article by Cadzow and Solomon (Cadzow and Solomon, 1987), we see that the coherence function only measures how well linear modeling captures the relationship between the two time series. To quote these authors “A perfect bidirectional relationship linear association requires that each of the time series be related to one another by means of a time-invariant linear operation (not necessarily causal).” Coherence estimation in our context is a method of template matching between signals. We examine the coherence between a signal taken at the beginning of an experiment (or critical surgery) and a test case during the same surgery. A mismatch between signals from the injured state and the normal state causes a decrease in coherence between the signals. In this study we will examine the baseline variability with conventional signal averaging vs. adaptive signal coherence. Specifically, we will investigate the speed of detection and the pre-injury baseline variability when using the conventional average versus using the ACE. Traditionally, conventional average amplitude is highly variable and can have a high number of false positives. To avoid this, a high threshold is used in determining signal change, i.e. ≥50% change of signal amplitude from pre-injury baseline. We will investigate if the low baseline variability can turned around into faster detection through ACE.
1. Methods
2a. Adaptive Coherence Estimation (ACE)
The Adaptive Coherence Estimate measures the level of correlation between two different signals (Thakor et al., 1995). In the interpretation of coherence, it is suggested that the SEP response under normal conditions can be thought of as a linear system, where injury to the spinal cord results in non-linear changes in the output response (Fig. 1). The reference signal is created by stimulating the normal brain during the immediate pre-surgical period after anesthesia has been administered. Once surgery begins, subsequent realizations of the signal are considered test signals. Two filter responses are simultaneously created and iteratively adapted. The first response (forward response) convolves the reference signal to test signal. The reverse filter convolves the test signal to the reference signal. This essentially provides a measure of coherence between the reference and test signals. Under normal conditions the test and reference signals would match. Thus the corresponding relationship between two normal SEP filter responses would be linear, while the relationship of a normal response to an injured response would be non-linear. Given this model, the coherence function is able to provide an indication of non-linear changes in the SEP due to injury. The coherence function is found from multiplying complementary transfer functions as seen in fig. 1. The basic idea is to use the coherence estimate to determine whether the association between control and diseased states are linear which the coherence function can imply. Coherence function values close to one imply a linear association, while values close to zero imply a deviation from a linear association between two time series (Cadzow and Solomon, 1987).
Figure 1.
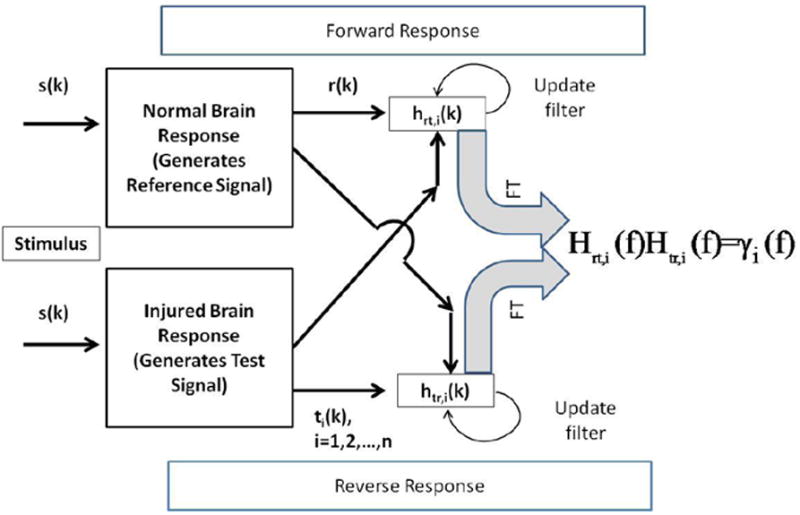
Figure 1 is a schematic of the operations involved in calculation the coherence using forward and reverse transfer functions and filters. In many respects this is a template matching method that is largely frequency dependent. The top and bottom panel shows the forward and reverse frequency response estimation and update procedure, respectively. The reference and the test signals are used as input and output for the forward response, respectively. Filters are adapted at each time point using both signals. A signal estimate is generated at every time point and that estimate is subtracted from actual signal to provide the adjustment to the filter weights.
Here is the summary of the ACE algorithm: We start by comparing the pre-surgery reference signal, ri(k), (vector form r) and primary test signals ti(k) (ti,k, i = 1,2,…,n; k = 1,…,K) are the ith successive test signals and K is the number of time points within a single SEP signal. To begin with, these equations are developed in the time domain so that signals and their respective filters are updated iteratively in time. Observations of coherence are done completely in the frequency domain. This update is done once per individual SEP average. This process of comparing frequency responses is shown in figure 1.
Here are the iterative equations that define the transfer response between the reference and test signals. The frequency domain rendering of these transfer functions yields the coherence function.
- Transfer function representation of one signal in terms of the other:
is the forward impulse response converting the vector r to tk through the convolution product and its complement for the reverse relationship
For both cases we have largely ignored noise since we are investigating largely signal averages and their relationship throughout the experiment. - Now we create an iterative form of this equation so that it updates at every time instance k. And we have embedded this variable within the filter iteration.
Now we have revealed the time index on the transfer function, ti(k) and μrt are the test (injury) signal samples and forgetting factor, respectively. The test signal estimate is represented by t̑i,k. This is the signal generated by current reference signal’s output out of hrt
-
cAnalogous transfer function for inverse relation or:
-
dReporting of the coherence takes place by doing a Fourier transform at a specific time point during the ith SEP iteration of the time domain filter to create the frequency domain filter:
-
eCombine transfer functions to generate coherence estimate:
Here we examine the degree of correspondence between the forward and backward transfer functions. When the transfer function estimates are identical inverses of each other both forward and backward, the coherence is said to equal unity. This would occur under completely noise-free conditions with identical signals, t(k) and r(k). When coherence is high, test and reference SEP signals show a high degree of conformity. On the other hand, when coherence is low, there are strong differences between signals.
2b. Surgical Methods
The protocols used in this study were approved by the Johns Hopkins University Animal Care and Use Committee (ACUC). Adult Wistar male rats (300-350 g; N=9; 3 controls & 6 experimental animals) were used in the study. The experimental model chosen was based on the modified aneurysm clip (Rivlin and Tator, 1978a, b) and consisted of a precisely calibrated, clip compression injury induced on the rat spinal cord at various levels of force for a short period of time in order to emulate an injury that might be sustained during a surgical procedure. This model was chosen as a result of its applicability to surgically-induced injury as well as its reproducibility and controllability.
Anesthesia
Ketamine was chosen as the anesthetic for all experimentation. Prior to all procedures that required anesthetization, deep sleep was initially induced with intraperitoneal administration of Xylazine/Ketamine 50 to 100 μl/100g [mixture containing 8.75 ml of Ketamine (100 mg/ml) and 1.25 ml of Xylazine (100 mg/ml)]. Additional administration was given as needed throughout the experiment (approximately every 30min) in order to maintain deep anesthesia. This refers to the cases in which animal preparation or surgeries took longer time. In other words, during standard EP recording there was no need for additional injection and only for prolonged laminectomy and surgeries we injected more ketamine
Surgical Preparations
A set of procedures are required to prepare the animal for electrophysiological monitoring. More specifically, insertion of five transcranial screw electrodes (E363/20, Plastics One Inc.) was performed 3-4 days prior to the induction of injury. After injection of lidocaine under the surface of the scalp, an incision was made along the midline; excess tissue was removed to reveal the cranium. Using a standard dental drill (Fine Science Tools, North Vancouver, BC, Canada), five burr holes) were created in the cranium; the locations of the holes were determined with respect to the bregma and were chosen so that recordings could be obtained from the portion of the somatosensory cortex in each hemisphere that receives input from sensory pathways originating in the fore- and hindlimbs. On each hemisphere, the forelimb recording sites were located 0.2 mm posterior to bregma and 3.8 mm laterally from the bregma, and the hindlimb recording sites were located 2.5 mm posterior to bregma, and 2.8 mm laterally from the bregma. A fifth hole drilled on the right frontal bone, situated 2 mm from both the sagittal and coronal sutures, served as the intracranial reference. The electrodes were screwed into each hole so that the screw gently touches the dura, without compressing the brain tissue or causing damage to the meninges. The electrode contact at the distal end of each electrode is placed into one of the electrode pedestal (MS363, Plastics One Inc., Roanoke, VA) slots and the pedestal is secured by the dental cement. After the cement hardens, the incision is closed with 2-0 silk suture.
Pre-Injury Procedures
The rat was prepared for clip application after a set of surgical procedures were performed on the day of injury. After the rat was fully anesthetized, electrophysiological signals were recorded (see Multiple-Limb SEP Monitoring section below) for 30min. Upon completion of the SEP recording, a 2 inch by 1 inch area along the midline of the back was shaven. A small incision was made along the midline in this area to reveal the thoracic region of the spinal column. Excess tissue was removed for clear visualization of the T6-7 vertebrae. The spinous process, the lamina, the transverse process, and two-thirds of the pedicles of the two vertebrae were cut away to expose the spinal cord and allow for insertion of the clip. Once the laminectomy was completed, SEP recordings were obtained for an additional 20-30 minutes.
The arms of a modified aneurysm clip of defined force application were opened using a Heifetz aneurysm clip applicator. The lower arm of the clip was gently positioned under the spinal cord so that the ventral surface was in contact with the superior surface of the lower arm. The upper arm was suspended over the dorsal surface of the spinal cord such that the midline was at the center of the curve of the arms and was perpendicular to the length of the clip. Upon release of the clip, the arms close on the cord for one minute, at which point the clip was gently removed using the clip applicator. Graded injury was obtained by separating rats into groups that received compression from clips with distinct spring forces. The two experimental groups were identified by clip spring values of 13g and 20g. Control animals were subjected to a laminectomy only. SEP recording was performed continuously during the clip application and the following 45-60 minutes in order to assess acute changes in SEPs. At the time of euthanasia the rat was anesthetized again and euthanized by trans-cardial perfusion with formaldehyde.
Multiple-Limb SEP Monitoring
SEPs were produced by electrical stimulation to all four limbs of the rat via subcutaneous needle electrode placement (Safelead F-E3-48, Grass-Telefactor, West Warwick, RI). A pair of needle electrodes was inserted in each of the four limbs such that activation of the middle tibial and median nerve, respectively, was obtained without direct contact to the nerve bundle. The designed software (Infinite Biomedical Technologies, Baltimore, MD) was used to trigger an external stimulator (Digitimer Limited, Hertfordshire, England) at a set frequency of 1 Hz. The 200μs pulse duration created by the stimulator was maintained at a constant current of 3.5mA. The stimulation pulse created by the stimulator was transmitted to each limb sequentially, such that each limb was stimulated at a frequency of 0.25 Hz or 1 Hz per one 4 limb EP cycle. For each experiment, limb numbers were assigned counter-clockwise with limb number one corresponding to the right forelimb. Real-time SEP recordings were utilized as a means to detect injury as well as to quantify changes in cord integrity. All analyses were done off-line, however.
SEP recordings were obtained using the five transcranial screw electrodes as described above. The diagram showing the positions of these electrodes is presented in figure 2. The differential signal for each hemisphere was amplified using an Opti-Amp 8002 biopotential amplifier (Intelligent Hearing Systems, Miami, FL) with a gain of 30,000. The analog filter settings were at 1000 Hz and 1.0 Hz for low and high pass cutoffs, respectively. The analog signal of each hemisphere was transferred optically to a personal computer via a data acquisition card sampling at 5,000 samples per second. The file created stored multiple channels of data, of which the electroencephalogram of each hemisphere, containing the SEP for the respective hemisphere, the stimulation signal and the stimulation limb number were recorded on separate channels for post-operative data analysis. A ground electrode was placed on the base of the skull (not shown in figure).
Figure 2.
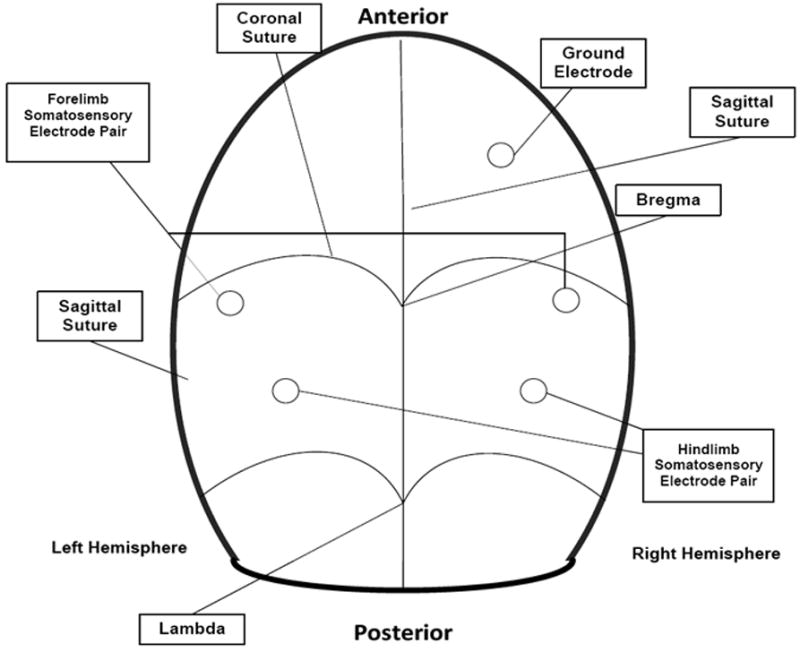
Figure 2 shows location of screw electrode placement on rat cranium. Details are explained in the text including screw electrode positions.
Data Processing
Averages were taken every 20 sec (4 limbs*5 EP cycles/limb* 1 sec/EP cycle). One hundred EPs were averaged after each 20 sec window shift so that there was 80% overlap between sequential averages. Averaged data was downsampled to 1250 Hz and then a Parks-McClellan FIR filter with a cutoff of 50 Hz was then applied to the data. The adaptive filter was utilized with a filter length of 7 and an adaptation coefficient (μ) of 0.00001. The filter was run sequentially between pts. 10 (16 ms) to 60 (80 ms) in each SEP average and then iteratively across separate SEP trials. Coherence was reported once at the end of each SEP average. A 128 pt. FFT was used to transform filters into their respective transfer functions. This data was transformed via the Fisher’s z-transform which is a quantitative method for transforming coherences to normality (Sherman et al., 1997). Amplitude values were calculated by subtracting the minimum from maximum values over the region of interest.
Statistical processing
This was to compare the variances for each animal’s data. We then compared the summary standard deviations for all animals together using a t-statistic. We looked at the time of detection of injury for both 6- and 10-σ deviations from the baseline for ACE and this was compared to the standard >50% amplitude change for conventional averaging. (Moller, 1995).
To help confirm the reliable early warning facility of the ACE algorithm we also provided results via an abrupt change detection strategy. We used the slope change detection algorithm of Farley and Hinich (Farley and Hinich, 1970) to show the ability of the algorithm to capture the key alterations of signal viability. A detection statistic level minimum of -3.0 was used to indicate a negative slope change. We want to search for a large reduction of the either the coherence or the amplitude. The results are reported every 10 discrete averages (200 seconds).
As a final comparison between the two methods we examine the receiver operating characteristic (ROC) for the signals detection methods. We calculate the amplitude and coherence values for 20 epochs prior to injury and 30 epochs post-injury. We average the 50 and 60 Hz coherence values to generate an estimate of the ACE algorithm. These values are used to calculate the ROC curves and the subsequent area under the curve (AUC). We apply the methods of Hanley and McNeil (Hanley and McNeil, 1983) to compare the AUCs statistically and check for significant changes in detector performance between amplitude and adaptive coherence. To implement these statistical tests we used the PASS system (NCSS, Inc., Kaysville, UT). In addition we calculated the specificity and sensitivity of the amplitude measurements assuming that a 50% reduction in maximum amplitude constitutes an injury. For the adaptive coherence, a positive injury detection is caused when the coherence falls below 0.8.
2. Results
For the ACE measure there is greater stability compared to the conventional averaging across the entire period for all limbs as seen in a control animal’s record. Figure 3 shows a single control animal’s trend lines for amplitude and ACE measures in all four limbs. There are noteworthy differences in baseline variability between conventional amplitude and ACE estimates as seen predominantly in the hind limbs. The ACE method has much narrower levels of variability during baseline. Amplitude calculations show a drift toward higher values during the first half of the recording. The right side recordings show a more pronounced increase than the left side SEPs. Ultimately coherence will not rely on sheer magnitude considerations since it does not depend on absolute amplitude considerations alone, i.e. it is normalized by spectral power. In clinical practice though, an upward drift in amplitude would bias the results.
Figure 3.
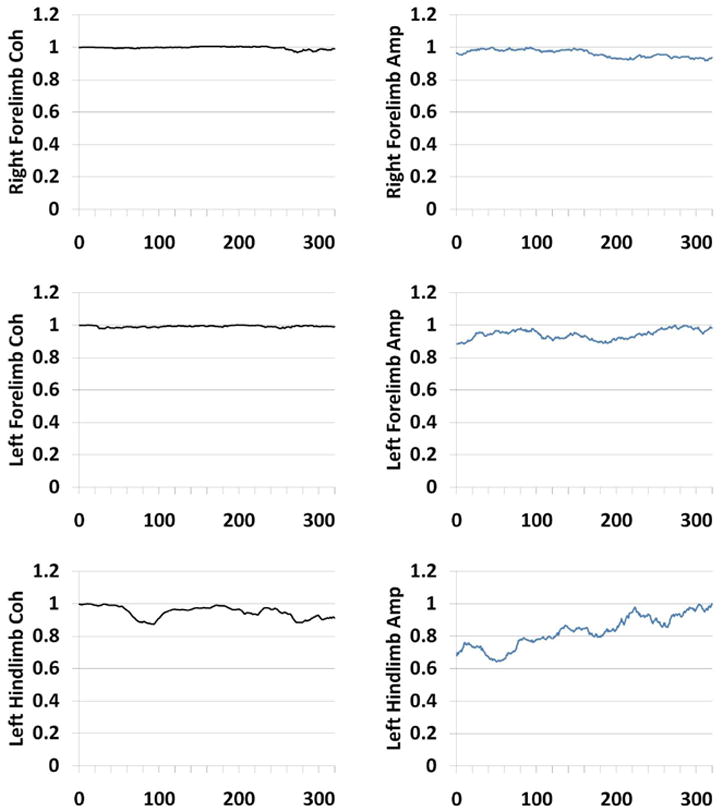
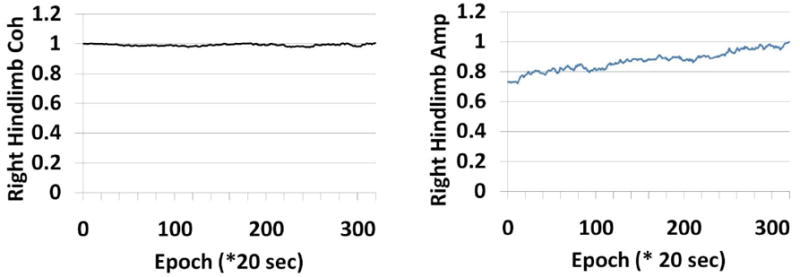
Figure 3 shows stability profile of ACE vs. amplitude during laminectomy in a control subject. The reaction of all four limbs are shown in the panels. The third frequency component ( at approximately 29.31 Hz) is shown. There is comparatively more stability in the ACE estimates than the amplitude estimates in this animal’s evoked potential.
We also computed standard errors for the baseline periods with all the animals. The standard error was calculated as the standard deviation of baseline measurements divided by the mean over the same time range. This is shown in Table 1. We see that the standard error average for ACE is approximately one tenth the size of the standard error for amplitude calculations at 0.0131 vs. 0.99, respectively. This is the case for the 20g weight rats. A paired sample t-test showed that these differed from their respective amplitude-based counterparts at the p<0.015 level. This low variance is critical for the estimates of change detection where we use a threshold based on pre-injury variance. Table 2 shows the differences in relative amplitude vs. ACE during the acute injury period. Overall across weight classes ACE shows a 91.3% change compared to baseline whereas amplitude shows only a 68.6% change. There were no differences between weight classes.
Table 1.
Standard error differences between the ACE and the amplitude method for both 13 and 20 g animals. Paired sample t-tests show differences in level of variability between ACE and amplitude.
| PRE-INJURY STANDARD ERROR | |||
|---|---|---|---|
| Animal | Weight (g) | ACE | Amplitude |
| Rat1 | 20 | 0.0107 | 0.0792 |
| Rat2 | 20 | 0.0136 | 0.0673 |
| Rat3 | 20 | 0.0215 | 0.1172 |
| Rat4 | 20 | 0.0069 | 0.1358 |
| Rat5 | 13 | 0.0649 | 0.1149 |
| Rat 6 | 13 | 0.0655 | 0.0803 |
| Standard Error Averages | 20g | 0.0132 | 0.0659 |
| 13g | 0.0652 | 0.0976 | |
Table 2.
The percentage differences between baseline average amplitudes and coherences and their respective minimum points after injury.
| PER-CENT REDUCTIONS FROM MAXIMUM PRE-INJURY BASELINES | |||
|---|---|---|---|
| Animal | Weight (g) | ACE | Amplitude |
| Rat 1 | 20 | 98.75 | 51.2 |
| Rat 2 | 20 | 83.35 | 78.31 |
| Rat 3 | 20 | 91.14 | 73.46 |
| Rat 4 | 20 | 93.57 | 76.74 |
| Rat 5 | 13 | 86.00 | 67.53 |
| Rat 6 | 13 | 94.87 | 64.33 |
| Averages | 20 g | 91.70 | 69.73 |
| 13g | 90.44 | 65.93 | |
We also calculated the average detection time after injury using absolute magnitude of changes in both ACE and amplitude for both 13 and 20 gram injury classes. For ACE we considered a positive injury detection to be six standard deviations (σ) below baseline where we calculated the baseline over the first 50 epochs before the acute injury period. We need on average 10 epochs for ACE injury classification and 19.88 epochs for amplitude (using the conventional standard 50% amplitude drop (Moller, 1995)). These values are indicated in Table 3. Using the paired sample t-test we can show that the differences between the ACE and amplitude changes are close to being significant at p<0.057. The 13g and 20g animal classes show some differences in the ACE detection time and this is significant at the p<0.02 level.
Table 3.
Registry of evoked potential change points for magnitude of coherence and amplitude are shown. ACE threshold for detection of change is baseline average – 6 standard deviations. The amplitude threshold for detection of change is the standard 50% reduction of baseline average. There are significant differences between the ACE and amplitude change points for the 20g weight class.
| AMPLITUDE VS. COHERENCE: MAGNITUDE DETECTION RESULTS | ||||
|---|---|---|---|---|
| Weight (g) | Epoch for Clipping | Delay in Epochs for Coherence | Delay in Epochs for Amplitude | |
| Rat 1 | 20 | 105 | 12 | 31.5 |
| Rat 2 | 20 | 160 | 3 | 15 |
| Rat 3 | 20 | 120 | 12.5 | 10.5 |
| Rat 4 | 20 | 70 | 12.5 | 22.5 |
| Rat 5 | 13 | 120 | 20 | 17.5 |
| Rat 6 | 13 | 85 | 33 | 30 |
| Averages: | ||||
| 20g | 10 | 19.88 | ||
| 13g | 26.5 | 23.75 | ||
Figure 4 shows ACE overlaid with the conventional amplitude trajectory during the injury for all four limbs in animal #6. We also illustrate the response of the first frequency coherence component at 9.77 Hz here. Though both ACE and amplitude show some drift, amplitude manifests a larger variability during baseline as seen in all four limbs, but particularly the left hindlimb. ACE, on the other hand maintains a high degree of stability and drops sharply during injury. However, ACE shows greater variability post-injury. In this 13g gram weight case ACE detection proceeds more slowly than the amplitude case. For this animal (rat #6), there ACE reaches its threshold 3 epochs after the amplitude does.
Figure 4.
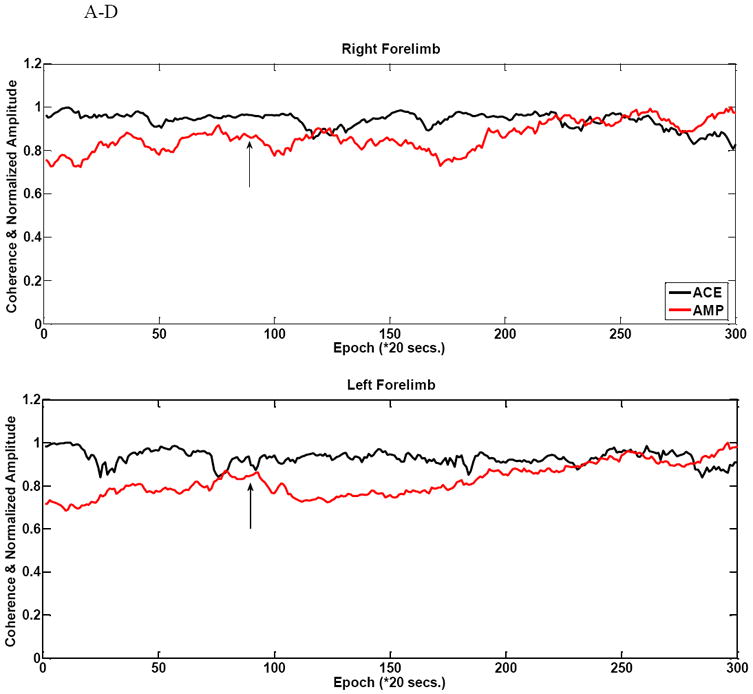
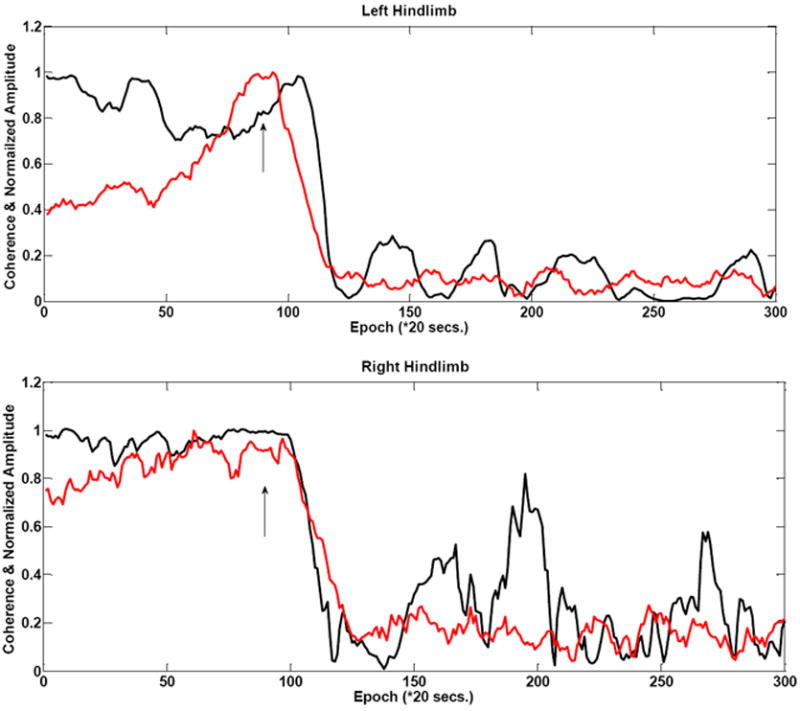
Figure 4 A-D shows comparative amplitude vs. ACE stability during baseline in a 13g weight (rat #6) injury animal in all four limbs. There is a comparatively larger amount of variability during the baseline period as seen for these amplitude measurements. There is some drift in the coherence estimate. This example shows a moderate decrease in ACE value with the injury induction as evidenced by slope change in the left hindlimb. The arrows indicate injury time.
The next figure highlights some of the behavior of the 20g weight injury animals. Figure 5A illustrates a case where baseline variability is still higher for the amplitude estimates. This is the left limb reactivity of animal #1. In this case the amplitude does not react in a straightforward fashion. There is little in terms of a marked decrease in amplitude when injury does occur. In fact the maximum amplitude occurs after the injury occurs.
Figure 5.
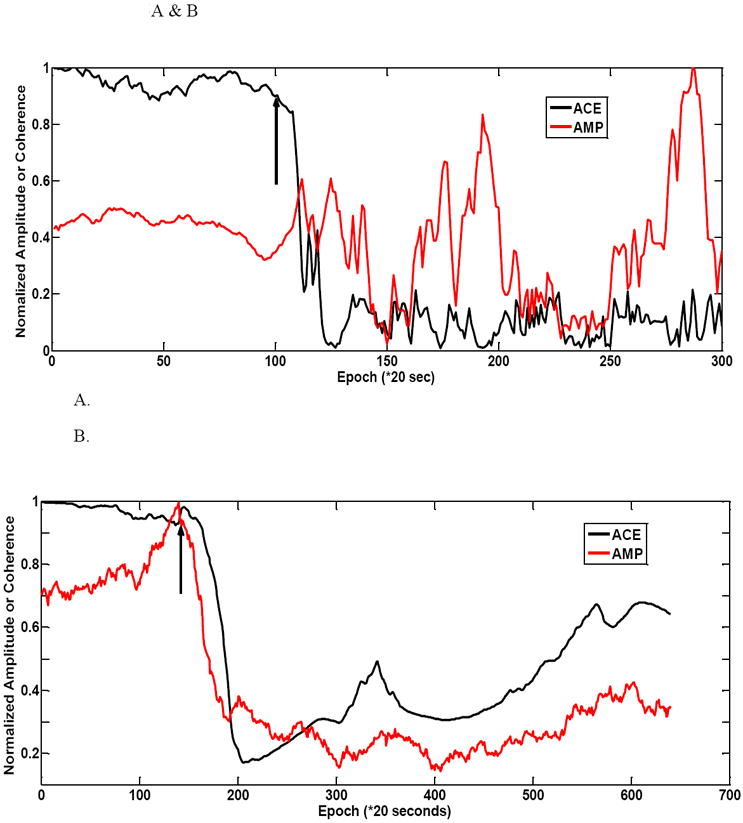
Figure 5 shows a couple of 20 g animal injury profiles. (A) the ACE value shows a rapid decrease in left hindlimb for rat #1. The amplitude parameter does not have a noticeable decrease after injury. It reaches its maximum after injury. There is much variability in the post-injury period. (B) shows another 20g weight animal (rat #2) example with a larger variability of amplitude during the baseline period. ACE still maintains a largely stable baseline period. In this example amplitude-based injury detection is faster than ACE. The right hindlimb is shown for this animal.
In figure 5B one can see the drift evident in the amplitude prior to injury. This is the right limb variability inherent in animal #2’s recording. The amplitude achieves its maximum right about the time of the injury and then falls. Even though the amplitude reacts faster than ACE once injury is induced, but because of baseline variability a judgment as to injury occurrence is difficult until amplitude reduction is sustained below simple baseline fluctuations. ACE remarkably stays stable during baseline once again and reacts in an ultimately faster decision than the amplitude. After the injury occurs there is more variability in the ACE estimate than the amplitude case.
Figure 6 shows the differences in shape between the baseline and injured evoked potentials. In the same animal we show the effect of a low vs. a high adaptation coefficient. This is for a left-side stimulated case. The right side case is shown in figure 7. Figure 8 shows the comparison for one animal between the low vs. high adaptation coefficient (μ) for the ACE results for the animal in figure 6. This is shown for the component at 29.31 Hz or the third frequency component. Here high μ is equal to 0.0001 and low is equal to 0.00001. As we expect there is much volatility for the high μ case. A small perturbation can cause many fluctuations of the coherence value. A tighter clamp on coherence transitions is maintained by the low μ case.
Figure 6.
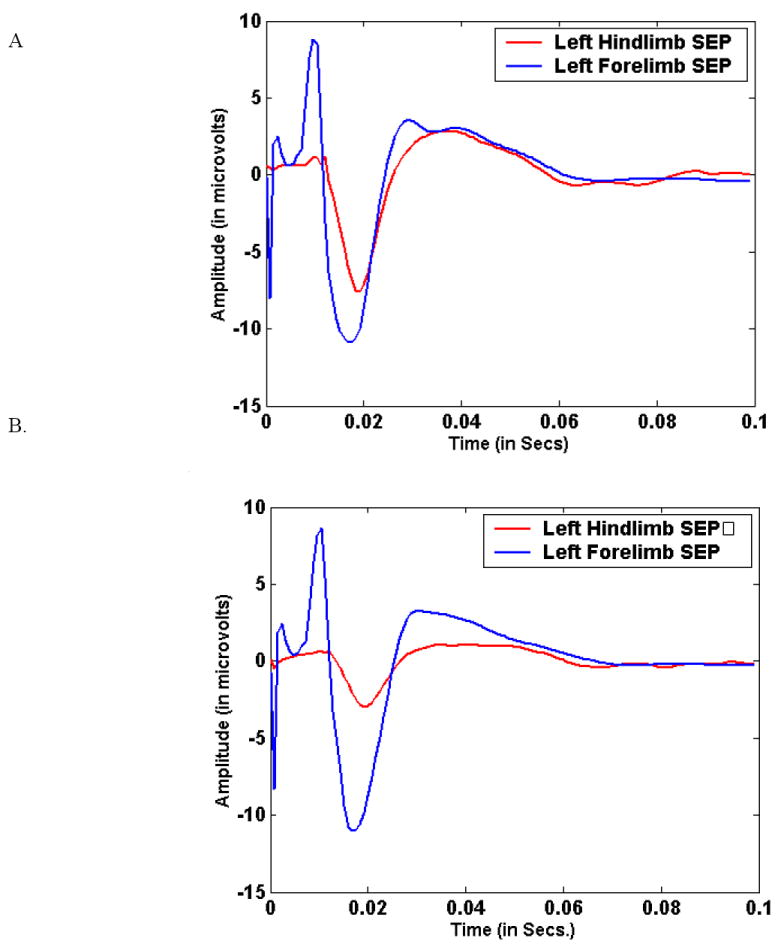
Figure 6(A) shows the left side-stimulated (right hemisphere recorded) during the pre-injury period in a single animal for both fore- and hind limb-stimulated cases. (B) shows the same for the immediate post-injury period. This is shown for animal #3.
Figure 7.
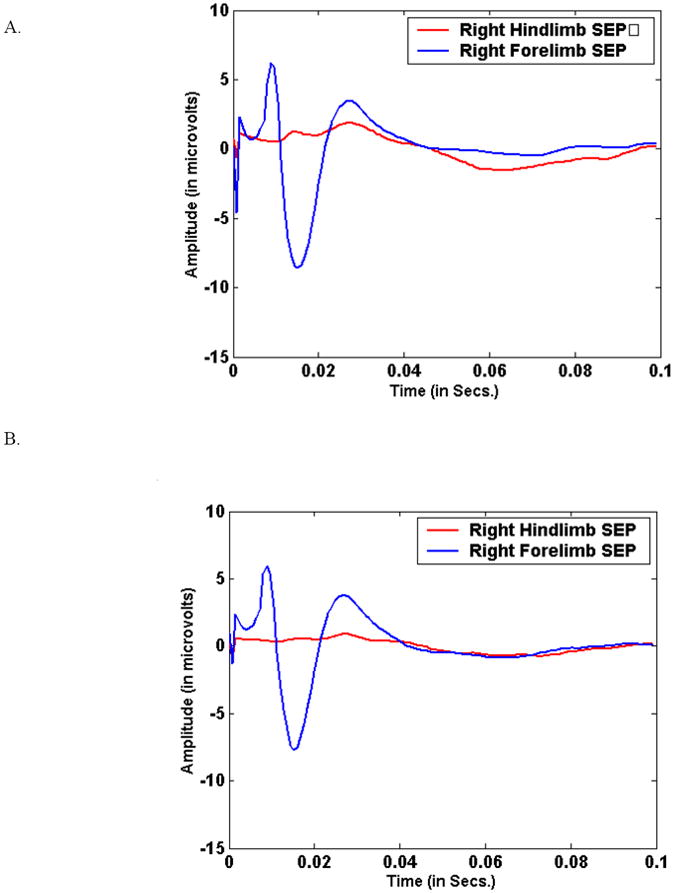
Figure 7(A) shows the right side-stimulated (left hemisphere recorded) during the pre-injury period in a single animal for both fore- and hind limb-stimulated cases for the same animal as figure 6. (B) shows the same for the immediate post-injury period.
Figure 8.
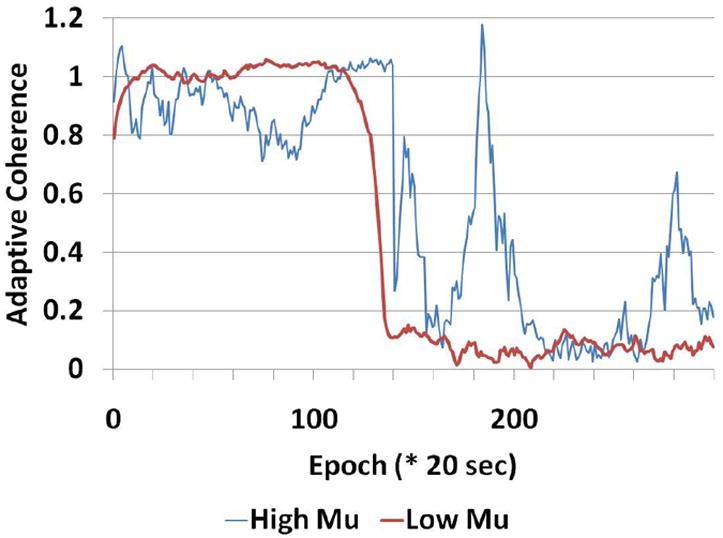
Figure 8 shows the comparison between high mu setting (mu=0.0001) and low mu (=0.00001). We can see that the larger mu causes larger spurious transitions than the smaller mu case. This is shown for animal #3.
The abrupt change of slope detection algorithm also indicated that the ACE algorithm shows slightly faster performance over simple amplitude. All six animals had an ACE-based detection within 20 average SEP signal averages of the actual clamping of the spinal cord. Three of these animals had a detection within 15 averages. For the amplitude algorithm there was a different case where there was no detection of a negative going slope. In addition we had two different cases where amplitude picks up the injury change before the ACE algorithm does. The average change duration for the coherence was 14 averages and for amplitude it was 15.8 averages. There were no differences between the 13 g and 20 g weight class groups. This is shown in Table 4.
Table 4.
Table 4 shows the abrupt change statistics for slope changes between adaptive coherence versus amplitude measurements. Change points based on the Farly-Hinich algorithm.
| SLOPE CHANGE DETECTION RESULTS | ||||
|---|---|---|---|---|
| Weight (g) | Epoch for Clipping | Delay in Epochs for Coherence | Delay in Epochs for Amplitude | |
| Rat 1 | 20 | 105 | 5 | 15 |
| Rat 2 | 20 | 160 | 20 | 30 |
| Rat 3 | 20 | 120 | 20 | 13 |
| Rat 4 | 20 | 70 | 17 | NA |
| Rat 5 | 13 | 120 | 19 | 9 |
| Rat 6 | 13 | 85 | 3 | 12 |
| Averages: | ||||
| 20g | 15.5 | 19.33 | ||
| 13g | 11 | 10.5 | ||
In figure 9 we show the results of our ROC curve examination. The amplitude measurement method found an AUC of 0.78. The adaptive coherence method has an AUC of 0.84. This increase can be easily seen on ROC curve. Using statistical testing we have shown that that we can a difference of 0.06 between detectors. At the power level of 70% power we have can detect the difference between coherence and amplitude detectors’ performances with those respective AUCs at an alpha of p=0.05. This AUC was based on 300 individual detection events. Six animals generated 120 non-injury events and 180 post-injury events. Interestingly this increase provides evidence that there are critical differences between the two detectors. Additionally we note that the sensitivity and specificity for the 50% amplitude detector was 46% and 83%, respectively. For the coherence case it is 73% sensitivity and 89% specificity using a threshold of 0.8%
Figure 9.
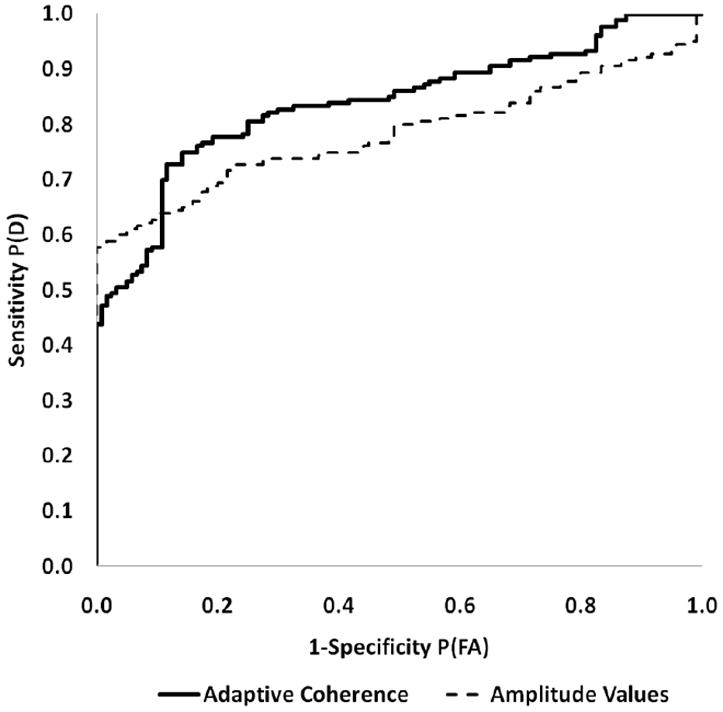
Figure 9 shows the Receiver Operating Characteristic comparison between adaptive coherence and amplitude injury detectors for slope change detection. There is a significant gain in area under the curve (AUC) at the p<.05 level for the number of detection measurements listed in the main text.
3. Discussion
This work examined the comparative performance estimates of two different injury indicators in an animal model of spinal cord injury. The adaptive coherence estimator was compared to conventional point estimates of the total signal amplitude. The focus of the paper was to look at baseline drift and instability of the point estimate of signal amplitude. Two major detector performance statistics show that the ACE algorithm is a worthy supplement to amplitude-only analyses of the SEP. From absolute magnitude studies we can see that ACE provides a faster detection time than amplitude. An abrupt change detection statistic points to a faster response than amplitude alone. A significant rise in the area for the ROC curve for ACE also underscores a performance enhancement with coherence and other morphological-based statistics (Al-Nashash et al., 2009). Adaptive filtering based coherence estimates allowed for using a template matching scheme after using a fixed reference signal for baseline. Both methods used averages signals. During baseline the ACE method has a much lower variance than does the simple amplitude estimation. Because of the lower variance during baseline, we expect to see a faster detection of change in SEPs resulting from our criterion for change detection which is based on the threshold of the mean coherence minus
The key facet of this work is that the SEP changes its fundamental structure or morphology with injury. It is not simply a smaller scaled version of the original baseline signal. When this is a subtle mismatch between baseline and injury signal components as indicated by signal shape, the coherence is able to respond and capture these whole signal changes. Here whole signal measurements are critical—particularly judgments about the structure of lower limb SEP. For coherence based measurements, consistent phase and shape are a critical determinant of reliable estimates. Shape changes are realizable in terms of both amplitude and phase alterations. If there are phase alterations these are immediately manifest in terms of a lowered coherence (Carter, 1987; Carter et al., 1983). Coherence results show large variability in injury as well since lowered coherence estimates are characterized by higher variability. What this study shows distinctly is that averaging the signal is still an essential ingredient in evoked potential processing. The parameter that we actually measure in those signal averages is what matters. The amplitude is a long established SEP parameter from those averages it may not be the most ideal.
In a real-time monitoring situation we expect to combine both amplitude and structural information so that a change detection method can capture alterations in evoked potential. Furthermore we expect the stimulation rate will be a lot faster in an actual intra-operative monitoring situation. This rate typically entails forming averages at a much faster rate. This would enable us to afford more detection events. Both of these indicators will allow for a speedier decision process with greater affirmation of actual change.
For our study, signal to noise considerations are important as well since at the current time we are using the average signal in all calculations. It has a large signal-to-noise ratio with which to start out. The slightest residual noise affects where peaks are “positioned” and the size of those peaks. Thus conventional estimates of peak-to-peak amplitude are highly variable—yet for coherence estimates we are dealing with signals with uncorrelated noises so that a small amount of noise does not affect the cross-spectral estimates. Noise may cause some distortion and decrease the signal coherence value from 1.0 as it largely affects the autospectra. With our constant adaptation coefficient, μ, that remains constant, our ACE algorithm is unaffected by short noise and artifacts which can only produce sporadic notches in trend during baseline. Since adaptive filtering measurements use “history of training”, i.e. they are run on more than one signal repetition, we see that one disadvantage of adaptive filtering is that it is essentially a conservative method of signal processing that does not respond well to change unless the adaptation coefficient is changed through its own adaptation process. This allows for an accommodating change and a rapid response under these circumstances. As we move toward examining single sweep SEPs by similar adaptive coherence measurements, we can use noise and artifact rejection techniques as well as matched filtering in the single sweep case to eliminate outliers.
We can make preliminary claims about the rate of detection using absolute magnitude of coherence vs. SEP amplitude. These are very close to being significant. At this time we cannot make any claims about the speed of detection with ACE vs. amplitude measurements through slope change detection. There are too few animals to make any significant claims of speed of detection even comparing the average speed of detection for ACE vs. amplitude given that there is one missing detection case for the raw amplitude. In addition there is the fact that the ACE algorithm is slower than the amplitude method for two different animals. A much larger study is required to prove beyond a reasonable doubt that ACE is faster than amplitude.
One disadvantage of our model is apparent—poor frequency resolution due to a short sequence filter length prior to taking the FFT. In previous descriptions of the ACE algorithm dealing with cerebral ischemia, there is little agreement among different individual frequency trajectories after injury. A voting system detected transitions among select frequencies and abruptly changed the linearity from 1 to zero. In the case of spinal cord injury, there is little need for the linearity index since most of the frequency components track one another well after injury so there is little dispersion among the components (Thakor et al., 1995).
Acknowledgments
We would like to acknowledge the generous support of the NIH through grant # R44-NS045407
Footnotes
Publisher's Disclaimer: This is a PDF file of an unedited manuscript that has been accepted for publication. As a service to our customers we are providing this early version of the manuscript. The manuscript will undergo copyediting, typesetting, and review of the resulting proof before it is published in its final citable form. Please note that during the production process errors may be discovered which could affect the content, and all legal disclaimers that apply to the journal pertain.
References
- Al-Nashash H, Fatoo NA, Mirza NN, Ahmed RI, Agrawal G, Thakor NV, All AH. Spinal cord injury detection and monitoring using spectral coherence. IEEE Trans Biomed Eng. 2009;56:1971–9. doi: 10.1109/TBME.2009.2018296. [DOI] [PubMed] [Google Scholar]
- Barros AK, Ohnishi N. MSE behavior of biomedical event-related filters. IEEE Trans Biomed Eng. 1997;44:848–55. doi: 10.1109/10.623054. [DOI] [PubMed] [Google Scholar]
- Braun J, Hanley DF, Thakor NV. Detection of neurological injury using time-frequency analysis of the somatosensory evoked potential Electroenceph. clin Neurophysiol/Evoked Potentials Section. 1996;100:310–8. doi: 10.1016/0168-5597(96)95115-1. [DOI] [PubMed] [Google Scholar]
- Brown RH, Nash CLJ. Standardization of evoked potential recording. In: Ducker TB, Brown RH, editors. Neurphysiology and Standards of Spinal Cord monitoring. Springer Verlag; New York: 1988. pp. 1–10. [Google Scholar]
- Cadzow JA, Solomon OM. Linear modeling and the coherence function. IEEE Trans Acoust Speech Signal Processing. 1987;ASSP-35:19–28. [Google Scholar]
- Carter GC. Coherence and time delay estimation. Proc IEEE. 1987;75:236. [Google Scholar]
- Carter GC, Knapp CH, Nuttall AH. Estimation of Magnitude-Squared Coherence Function via Overlapped Fast Fourier Processing. IEEE Trans Audio Electroacoustics. 1983;21:337–44. [Google Scholar]
- Cracco RQ, Bodis-Wollner I. Evoked Potentials. Frontiers of Clinical Neuroscience. 1986;3:421–7. [Google Scholar]
- Croft TJ, Brodkey JS, Nulsen FE. Reversible spinal cord trauma: a model for electrical monitoring of spinal cord function. J Neurosurg. 1972;36:402–6. doi: 10.3171/jns.1972.36.4.0402. [DOI] [PubMed] [Google Scholar]
- Davila CE, Srebro R. Subspace averaging of steady-state visual evoked potentials. IEEE Trans Biomed Eng. 2000;47:720–8. doi: 10.1109/10.844219. [DOI] [PubMed] [Google Scholar]
- Farley J, Hinich MJ. A Test for a Shifting Slope Coefficient in a Linear Model. J Amer Stat Assoc. 1970;65:1320–9. [Google Scholar]
- Grundy B. Intraoperative monitoring of somatosensory evoked potentials. Anesthesiology. 1983;58:72–87. doi: 10.1097/00000542-198301000-00011. [DOI] [PubMed] [Google Scholar]
- Hanley JA, McNeil BJ. A Method of Comparing the Areas under Receiver Operating Characteristic Curves Derived from the Same Cases. Radiology. 1983;148:839–43. doi: 10.1148/radiology.148.3.6878708. [DOI] [PubMed] [Google Scholar]
- McCallum JE, Bennett MH. Electrophysiologic monitoring of spinal cord function during intraspinal surgery. Surg Forum. 1975;26:469–71. [PubMed] [Google Scholar]
- McPherson RW. Intraoperative neurological monitoring. In: Rogers MC, editor. Principles and Practive of Anesthesiology. Mosby Year Book; St Louis, MO: 1993. [Google Scholar]
- Minahan R. Intraoperative neuromonitoring. The Neurologist. 2002;8:209–26. doi: 10.1097/00127893-200207000-00001. [DOI] [PubMed] [Google Scholar]
- Moller AR. Intraoperative Neurophysiologic Monitoring. Harwood Academic Publishers; Luxembourg: 1995. [Google Scholar]
- Nuwer MR. Evoked Potential Monitoring in the Operating Room. Raven Press; New York, N.Y: 1986. [Google Scholar]
- Riviere CN, Rader RS, Thakor NV. Adaptive canceling of physiological tremor for improved precision in microsurgery. IEEE Trans Biomed Eng. 1998;45:839–46. doi: 10.1109/10.686791. [DOI] [PubMed] [Google Scholar]
- Riviere CN, Reich SG, Thakor NV. Adaptive Fourier modeling for quantification of tremor. J Neurosci Methods. 1997;74:77–87. doi: 10.1016/s0165-0270(97)02263-2. [DOI] [PubMed] [Google Scholar]
- Rivlin AS, Tator CH. Effect of duration of acute spinal cord compression in a new acute cord injury model in the rat. Surgical Neurology. 1978a;10:38–43. [PubMed] [Google Scholar]
- Rivlin AS, Tator CH. Regional spinal cord blood flow in rats after severe cord trauma. Journal of Neurosurgery. 1978b;49:844–53. doi: 10.3171/jns.1978.49.6.0844. [DOI] [PubMed] [Google Scholar]
- Sherman D, Tsai YC, Rossell LA, Mirski MA, Thakor NV. Spectral Analysis of a Thalamus-to-Cortex Seizure Pathway. IEEE Trans BME. 1997;44:657–63. doi: 10.1109/10.605422. [DOI] [PubMed] [Google Scholar]
- Thakor NV, Kong X, Hanley DF. Nonlinear changes in brain’s response in the event of injury as detected by adaptive coherence estimation of evoked potentials. IEEE Trans Biomed Eng. 1995;42:42–51. doi: 10.1109/10.362920. [DOI] [PubMed] [Google Scholar]
- Vaz CA, Thakor NV. Adaptive Fourier estimation of time-varying evoked potentials. IEEE Trans Biomed Eng. 1989;36:448–55. doi: 10.1109/10.18751. [DOI] [PubMed] [Google Scholar]


