

Abstract
Large, publicly available collections of expressed sequence tags (ESTs) have been generated from Arabidopsis thaliana and rice (Oryza sativa). A potential, but relatively unexplored application of this data is in the study of plant gene expression. Other EST data, mainly from human and mouse, have been successfully used to point out genes exhibiting tissue- or disease-specific expression, as well as for identification of alternative transcripts. In this report, we go a step further in showing that computer analyses of plant EST data can be used to generate evidence of correlated expression patterns of genes across various tissues. Furthermore, tissue types and organs can be classified with respect to one another on the basis of their global gene expression patterns. As in previous studies, expression profiles are first estimated from EST counts. By clustering gene expression profiles or whole cDNA library profiles, we show that genes with similar functions, or cDNA libraries expected to share patterns of gene expression, are grouped together. Promising uses of this technique include functional genomics, in which evidence of correlated expression might complement (or substitute for) those of sequence similarity in the annotation of anonymous genes and identification of surrogate markers. The analysis presented here combines the application of a correlation-based clustering method with a graphical color map allowing intuitive visualization of patterns within a large table of expression measurements.
The development of distinct tissues and cell-types is a fundamental characteristic of the growth of higher organisms. Tissue and cellular differentiation, in turn, is highly dependent on specific patterns of gene expression and transcript accumulation.
In higher plants, a large volume of literature exists documenting spatial and temporal regulation of gene expression. It is increasingly clear that developmental pathways can be considered as modular, and that developmental transitions are accompanied by global changes in the expression of specific complements of genes (Doebley and Lukens 1998). For example, the intensively studied transition from etiolated to greening seedling involves coordinate regulation of many light-regulated genes (von Arnim and Deng 1996). Also increasingly clear, is the notion that complements of genes are best studied in parallel, which has become feasible with the development of new technologies (Schena et al. 1996, 1998; Wen et al. 1998).
Traditional approaches to the analysis of mRNA abundance, such as Northern blotting, tend to be limited by the number of transcripts that can be simultaneously analyzed. More recent innovations, such as hybridization to arrayed cDNA libraries or oligonucleotide chips permit simultaneous analysis of the abundance of thousands of transcripts (for review, see Brown and Botstein 1999). These latter approaches can be thought of as analog, because hybridization signal intensity reflects transcript abundance. In plants, the use of arrays of partially sequenced cDNAs has been successfully applied to the analysis of gene expression in light- and dark-grown seedlings of Arabidopsis (Desprez et al. 1998).
Digital analysis of gene expression can be achieved by generation of tags to expressed genes and transcript abundance inferred from the frequency of tags. This approach has been used with both conventional ESTs (Okubo et al. 1992; Lee et al. 1995; Takenaka et al. 1998) and in the SAGE technique with much shorter (10 bp) tags (Velculescu et al. 1995, 1997; Zhang et al. 1997). The availability of significant collections of expressed sequence tags from plant genomes presents an opportunity to analyze digital expression profiles for plant tissues and genes. Several studies have observed that the abundance of EST tags for many genes varies according to the tissue of origin of the cDNA library. (Uchimiya et al. 1992; Hofte et al. 1993; Umeda et al. 1994; Cooke et al. 1996; Yamamoto and Sasaki 1997). Because EST data is inherently noisy (Aaronson et al. 1996; Hillier et al. 1996; Wolfsberg and Landsman 1997), a rigorous statistical test was derived to assess the reliability of the identification of differentially expressed genes from EST counts sampled from different libraries (Audic and Claverie 1997). EST data has also been used to reveal alternative transcripts of the same gene, as well as their eventual library-specific distribution (Burke et al. 1998; Gautheret et al. 1998).
As of October 1998, there are ∼37,000 Arabidopsis and 27,000 rice publicly available EST sequences, as well as smaller collections from other plant species (http://www.ncbi.nlm.nih.gov/dbEST). An important difference between the Arabidopsis and rice ESTs (at least for the purposes described in this report) is that a large proportion of the Arabidopsis ESTs were generated from a single cDNA library, prepared from a mixture of tissues (Newman et al. 1994; Delseny et al. 1997), whereas the rice ESTs are more evenly derived from a set of tissue and organ-specific cDNA libraries, therefore making them a more suitable starting point for gene expression studies (Yamamoto and Sasaki 1997).
A significant proportion of ESTs show no similarity to sequences in existing databases (Adams et al. 1992; Claverie 1996). Ascribing functions to those anonymous sequences has therefore become one of the major bottlenecks in plant and animal genomics. One way of gaining functional information on anonymous genes is by use of the two-hybrid system (for review, see Brent and Finley 1997). According to this approach, direct physical interactions of the product of an unknown gene are used to reveal its relationships with the product of (hopefully) better-characterized ones. Using publicly-available rice ESTs as a test set, we show that a multidimensional analysis of EST data can provide similar types of information, albeit based on the concept of statistical rather than physical interactions. Functional relationships between genes may then be inferred from the mathematical identification of significant similarities between their expression patterns.
Using the rice ESTs available in dbEST (Boguski et al.1993) we have computed an expression profile for each gene represented by at least 5 ESTs in 10 different cDNA libraries. For each of those genes, the expression profile is therefore derived from 10 expression measurements (EST counts). Correlation analysis was then used to point out significant similarities in the expression profiles of genes as well as to generate a graphical representation of gene clusters exhibiting related expression patterns. Our results indicate that genes with similar functions, or tissues expected to share patterns of gene expression, can be recognized by use of this type of analysis. The multidimensional analysis of EST data, in a way quite parallel to microarray experiments (DeRisi et al. 1996; Eisen et al. 1998), may thus constitute a new approach to the functional annotation of anonymous genes and to a more global understanding of plant physiology.
RESULTS
EST Database and Contigs
A breakdown of the rice cDNA libraries represented in dbEST (as of 10/98) is shown in Table 1. Preliminary investigations in which expression profiles were generated from all libraries with >100 ESTs showed that the smaller libraries gave misleading results (data not shown). Therefore, of the 27 cDNA libraries that contribute to the EST set, only the 10 largest (representing 95% of the total ESTs) were used in the analysis presented here. These 10 cDNA libraries contribute varying numbers of ESTs to the dataset used; the difference between the largest and smallest rice cDNA libraries used here is approximately fivefold (library 1073 has 5094 ESTs, library 1009 has 890 ESTs).
Table 1.
Breakdown of Rice cDNA Libraries Represented in dbEST
| dbEST library identifier | Library description | Number of ESTs |
|---|---|---|
| 1073 | immature seed (5 days after pollination) | 5094 |
| 307 | green shoot (8 days old) | 3790 |
| 961 | callus | 3542 |
| 75 | callus | 3229 |
| 193 | etiolated shoot (8 days old) | 3148 |
| 499 | panicle (at flowering stage) | 2025 |
| 101 | seedling root | 1884 |
| 535 | panicle (at ripening stage) | 1478 |
| 1275 | acallus (H. Uchimiya) | 1431 |
| 1009 | panicle (shorter than 3 cm) | 890 |
| 967 | panicle (longer than 10 cm) | 365 |
| 1010 | immature leaf including apical meristem | 358 |
| 322 | FDRSC | 310 |
| 621 | etiolated leaf tissue | 132 |
| 966 | panicle (between 3 and 10 cm) | 74 |
| 968 | etiolated shoot | 43 |
| 1404 | late flower (panicle size 1–2 cm) | 42 |
| 1396 | etiolated leaf | 32 |
| 1281 | suspension culture | 29 |
| 466 | FDRRC | 13 |
| 1137 | bseed (A. Suzuki) | 6 |
| 969 | leaf (photoperiod insensitive) | 2 |
| 1395 | early flower (panicle size <1 cm) | 2 |
| 1321 | early embryogenesis | 2 |
| 1243 | — | 2 |
| 1176 | salt stressed | 2 |
| 1266 | cetiolated shoot (Y. Jiang) | 1 |
Data as of October 1998. For each library, the dbEST identifier is shown with a short description if available (taken from dbEST). Only the 10 cDNA libraries contributing significant numbers of ESTs (libraries 1073 to 1009) were further used in this study.
H. Uchimiya, University of Tokyo, Japan.
A. Suzuki, National Institute of Agrobiological Resources, Tsukuba, Japan.
Y. Jiang, Fudan University, Shanghai, China.
Rice ESTs were organized into clusters and contig (consensus) sequences derived by a protocol adapted from Gautheret et al. (1998) (see Methods). Selected statistics of the clustered set of rice ESTs are shown in Table 2.
Table 2.
Statistics of EST Clustering and Contiging
| (a) Preparation of rice EST clusters | |
| ESTs analyzed | 27877 |
| ESTs remaining after quality control | 27710 |
| Clusters | 3400 |
| Singletons | 11233 |
| (b) Breakdown of clusters with 5 or more ESTs | |
| With 5 or more ESTs | 707 |
| With 100 or more ESTs | 9 |
| With between 10 and 99 ESTs | 220 |
| With between 5 and 9 ESTs | 478 |
| (c) Contig sequence matches | |
| Contig sequences finding homolog | 602 |
| Contig sequences with no homolog | 105 |
Using all available ESTs as of October 1998.
ESTs from smaller cDNA libraries excluded; see Table 1.
Matches to SWISS-PROT/TrEMBL, at scores >100 (default scoring matrix).
Derivation of Expression Profiles
Expression profiles were derived for each of the 707 contigs with 5 or more constituent ESTs. The cDNA library of origin was scored for each constituent EST of each contig, producing a two-way, contig versus library, table of raw EST counts (see Fig. 1). The content of this table was the primary data for all subsequent computations.
Figure 1.
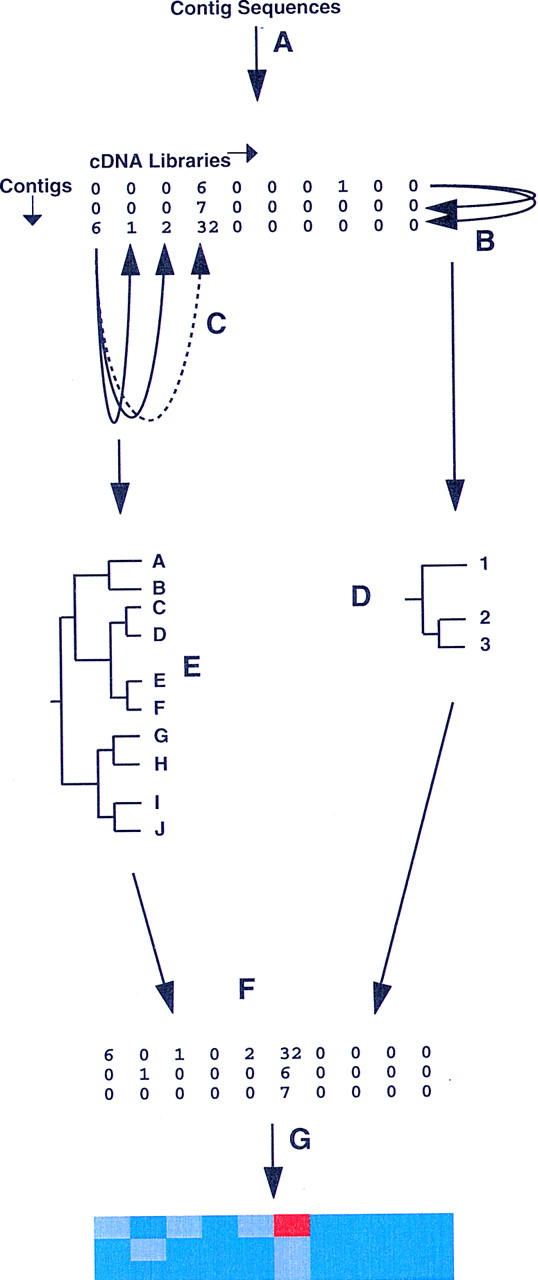
Overview of the procedure. (A)Derivation of expression profiles from each valid contig sequence (those representing five or more ESTs from the 10 cDNA libraries used) to form the primary data table in which contig sequence are arrayed in rows and cDNA libraries in columns. In the illustration, a hypothetical matrix of 3 contigs (1–3) by 10 libraries (A–J) is shown. (B,C) Pairwise calculation of similarity (Pearson correlation coefficient) between contig (row) and library (column) profiles, respectively. (D,E) Calculation of Euclidean distances for each contig/contig or library/library pair from Pearson coefficient matrices, and generation of contig (D) and library (E) dendrograms. (F) Separate reordering of rows (contigs) and columns (libraries) in the original data table, according to the hierarchical order in the contig and library dendrograms. In the reordered data table, similar contigs or similar libraries are adjacent. (G) Representation of the reordered data table as a clustered correlation map, in which the color in an individual cell reflects the underlying EST count.
In a preliminary investigation, an alternative protocol was explored in which the raw EST counts were further reduced to a binary scale, such that simply the presence or absence of a given gene in a given library was recorded (one or more EST=1, none=0). The subsequent statistical analysis of this binary data (with, e.g., Fisher's 2 × 2 exact test) was found to be much less sensitive and meaningful than the analyses performed with the raw EST counts. The remainder of this report, therefore, focuses on the identification of correlated expression patterns with a statistical analysis of actual EST counts.
Assessing the Pairwise Similarity Between Expression Profiles
The first aim of our analysis is to identify pairs of genes (represented here by EST contigs) exhibiting a similar, multicondition (i.e., cDNA library) expression pattern. For each gene, the data consists of 10 numbers (EST counts) defining an expression profile (see Fig. 1 for overview of entire procedure). If two genes are expressed in a coordinated manner, we expect their expression profiles to have similar shapes, that is, the two series of EST counts to follow the same up or down trend. Given that the absolute EST counts vary widely between contigs (the number of constituent ESTs per contig ranges between 308 and 5) and libraries (there is a fivefold difference between the number of ESTs contributed by the largest and by the smallest cDNA libraries—see Table 1), a meaningful measure of expression profile similarity had to be independent of those absolute numbers. Within these constraints, the Pearson linear correlation coefficient (see Methods) represents a natural, easy to compute, similarity measure. The value of this coefficient varies from −1 to 1; a value close to 1 indicates a high similarity of the compared expression profiles (i.e., proportionality between the EST counts of two genes), whereas a value close to zero indicates no coordinated expression. A useful property of this coefficient is its capacity to also point out pairs of genes exhibiting opposite expression behavior (anti-correlated profiles, for example, sequences expressed in mutually exclusive sets of libraries), potentially another form of biologically interesting gene coupling. In this latter case, the Pearson coefficient value approaches −1.
Finally, a significance level (P value) is associated with the computation of this correlation coefficient, allowing the evidence of pairwise coordinated gene expression to be ranked according to reliability [as with BLAST (Altschul et al. 1990) for sequence similarity].
To first confirm that computing Pearson's correlation coefficient is an appropriate way of identifying correlated expression profiles, groups of contigs with highly correlated profiles were analyzed. First, pairs of contigs with high correlation coefficients (in this case, r > 0.94), were identified within the 707 × 707 (symmetrical) matrix of pairwise gene expression profile correlation coefficients. These pairs of contigs were then organized into mutually matching clusters, whereby each profile in a cluster matches all of the others in the same cluster at the required stringency (r > 0.94). Table 3 shows two such clusters of contigs. The expression profile and putative identity is shown for each contig. Profiles in both groups of contigs are characterized principally by expression in libraries 1073 and 535 (immature seed and panicle at ripening stage). However, the contigs form two discrete clusters on the basis of linear correlation. Thus, for the group of contigs in Table 3a, expression is several fold higher in library 1073 than in library 535, whereas the converse is true for the group of contigs in Table 3b. Most of the contigs in the two clusters encode proteins with seed-related functions, in particular storage proteins, concurring with previous observations of over-representation of prolamin and glutelin transcripts in rice seed cDNA libraries (Liu et al. 1995; Yamamoto and Sasaki 1997).
Table 3.
Two Clusters of Correlated Contig Sequences a and b, with Highly Correlated (r > 0.94) Expression Profiles
| Contig | Putative identity | Library EST counts | |||||||||
|---|---|---|---|---|---|---|---|---|---|---|---|
| 1073 | 535 | 307 | 499 | 961 | 75 | 1275 | 193 | 101 | 1009 | ||
| (a) | |||||||||||
| 1 | PRO2_ORYSA 13-kD Prolamin | 293 | 15 | 0 | 0 | 0 | 0 | 0 | 0 | 0 | 0 |
| 4 | GLU5_ORYSA glutelin | 183 | 9 | 0 | 0 | 0 | 0 | 0 | 0 | 0 | 0 |
| 5 | GLU2_ORYSA glutelin type II | 145 | 28 | 0 | 0 | 0 | 0 | 0 | 0 | 0 | 0 |
| 7 | PRO1_ORYSA 10-kD prolamin | 145 | 10 | 0 | 0 | 0 | 0 | 0 | 0 | 0 | 0 |
| 12 | — | 74 | 0 | 0 | 0 | 0 | 0 | 0 | 0 | 0 | 0 |
| 15 | — | 63 | 0 | 0 | 0 | 0 | 0 | 0 | 0 | 0 | 0 |
| 34 | PRO7_ORYSA prolamin | 29 | 4 | 0 | 0 | 0 | 0 | 0 | 0 | 0 | 0 |
| 35 | GLU3_ORYSA glutelin type-A III | 27 | 3 | 0 | 0 | 0 | 0 | 0 | 0 | 0 | 0 |
| 41 | GLGB_ORYSA 1,4-α-glucan branching enzyme | 26 | 1 | 0 | 0 | 0 | 0 | 0 | 0 | 0 | 0 |
| 53 | GLGB_MAIZE 1,4-α-glucan branching enzyme IIB | 21 | 0 | 0 | 0 | 0 | 0 | 0 | 0 | 0 | 0 |
| 83 | — | 11 | 0 | 0 | 0 | 0 | 1 | 0 | 0 | 0 | 0 |
| 125 | PODK_MAIZE pyruvate phosphate dikinase | 12 | 0 | 0 | 0 | 0 | 0 | 0 | 0 | 0 | 0 |
| 148 | PHSL_VICFA α-1,4 glucan phosphorylase | 10 | 0 | 0 | 0 | 0 | 1 | 0 | 0 | 0 | 0 |
| 171 | ASPR_HORVU phytepsin | 10 | 0 | 0 | 0 | 0 | 0 | 0 | 0 | 0 | 0 |
| 209 | UGST_ORYSA granule-bound starch synthase | 8 | 1 | 0 | 0 | 0 | 0 | 0 | 0 | 0 | 0 |
| 304 | SUS2_HORVU sucrose synthase 2 | 6 | 1 | 0 | 0 | 0 | 0 | 0 | 0 | 0 | 0 |
| 366 | — | 6 | 0 | 0 | 0 | 0 | 0 | 0 | 0 | 0 | 0 |
| 367 | — | 6 | 0 | 0 | 0 | 0 | 0 | 0 | 0 | 0 | 0 |
| 378 | — | 5 | 1 | 0 | 0 | 0 | 0 | 0 | 0 | 0 | 0 |
| (b) | |||||||||||
| 3 | RA05_ORYSA seed allergenic protein RA5 | 59 | 170 | 0 | 0 | 0 | 0 | 0 | 0 | 0 | 0 |
| 20 | — | 9 | 57 | 0 | 0 | 0 | 0 | 0 | 0 | 0 | 0 |
| 52 | RA17_ORYSA seed allergenic protein RA17 | 5 | 21 | 0 | 0 | 0 | 0 | 0 | 0 | 0 | 0 |
| 95 | IAA1_HORVU α-amylase inhibitor BMAI-1 | 2 | 16 | 0 | 0 | 0 | 0 | 0 | 0 | 0 | 0 |
| 114 | P93615 ABA-induced plasma membrane protein | 2 | 14 | 0 | 0 | 0 | 0 | 0 | 0 | 0 | 0 |
| 282 | CDP1_ORYSA calcium-dependent protein kinase | 0 | 8 | 0 | 0 | 0 | 0 | 0 | 0 | 0 | 0 |
| 308 | P322_SOLTU probable protease inhibitor P322 | 1 | 7 | 0 | 0 | 0 | 0 | 0 | 0 | 0 | 0 |
| 481 | OLE1_ORYSA oleosin 16 kD | 0 | 6 | 0 | 0 | 0 | 0 | 0 | 0 | 0 | 0 |
| 488 | — | 0 | 6 | 0 | 0 | 0 | 0 | 0 | 0 | 0 | 0 |
Contigs are listed with a putative identification, if available, corresponding to the best match in the SWISS-PROT/TrEMBL databases (score > 100; default scoring matrix). The expression profile for each contig is shown for the 10 libraries used (identified by dbEST library identifiers), arranged in the same order as in the library dendrogram (see Fig. 2).
The Pearson correlation coefficient therefore permits fine-scale identification of sequences with correlated expression profiles.
Assessing the Pairwise Similarity Between cDNA Libraries
The degree of pairwise similarity between whole cDNA libraries can be similarly assessed with the Pearson correlation coefficient. The same table of multi-condition expression data is used, although with rows and columns exchanging roles. For each of the 10 sampled libraries, the profiles now consist of the 707 numbers (EST counts) characterizing the level of expression of each gene. If two tissues express a similar complement of genes, we expect the EST sampling of the corresponding cDNA libraries to exhibit similar profiles, hence, to be characterized by a high pairwise correlation coefficient. The computation of Pearson's coefficient between all cDNA libraries results in a 10 × 10 (symmetrical) matrix that will be used in building the graphical representation of the expression data.
A Two-Dimensional Graphical Representation Revealing Gene Clusters
The second aim of our study is to build a graphical representation of the whole table of multi-condition expression measurements, as a way to visualize clusters of genes obeying similar expression patterns.
To combine the library and contig data into a single representation, we adapted the clustered correlation approach pioneered by Weinstein et al. (1997) (Fig. 1). This technique involves reordering the results of multidimensional assays (in the latter study, N compounds vs. M tumors) so as to reveal discrete islands of regularities (e.g., different compounds affecting a similar subset of tumors, or different tumors affected by a common subset of compounds). This is performed by reordering the rows (and columns) of the data table so that the most similar ones are adjacent to each other. In our case, the data table consists of the expression measurements of 707 genes (rows) in 10 cDNA libraries (columns).
In the first step, a N × N row pairwise metric distance matrix is computed (see Methods) and then used to build a dendrogram that assembles all rows into a single tree. The rows are then reordered according to their hierarchical position in this tree. In our case, the contig/gene pairwise distance matrix is derived (see Methods) from the matrix of pairwise correlation coefficients described above. Adjacent genes then have similar expression profiles (Fig. 1). Given the large number of contigs (707), the complete contig dendrogram has not been reproduced here, although fragments are shown in Fig. 3, below. (The complete dendrogram and other data is available from the authors).
Figure 3.
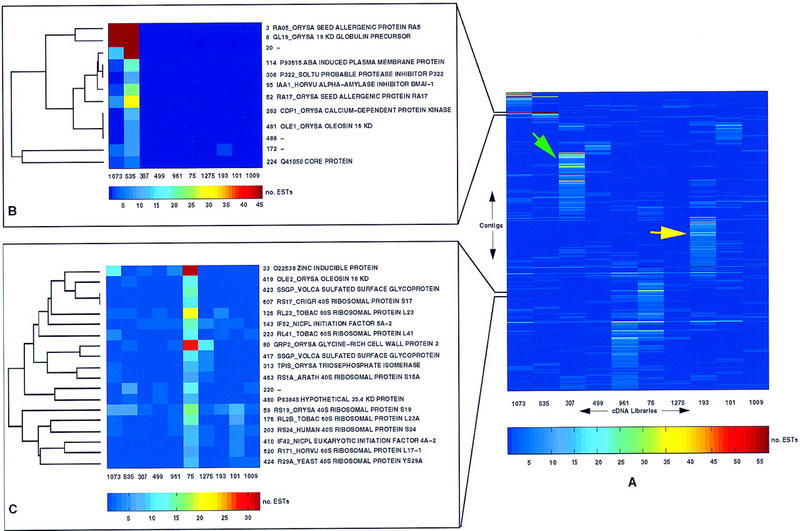
Clustered correlation map of the rice EST data. (A) The complete clustered correlation map of 707 contig sequences vs. 10 cDNA libraries is shown. Library identifiers (dbEST library identifiers, see Table 1) identify each library; contig identifiers are not shown in full, but are shown for each of the expanded regions in B and C. Absolute numbers of ESTs are represented according to the color scale shown below the map. Note that because of restrictions on the number of distinguishable colors, the color scale has been chosen so as to optimally represent a portion of the data (those cells with EST counts between 5 and 55; all cells with a value >55 are assigned the color red). The green and yellow arrows have been placed to show how the map might be used to identify groups of genes with particular expression patterns. In this case, the green arrow indicates a block of genes principally expressed in library 307 (green shoot, 8 days old) and the yellow arrow a block of genes principally expressed in library 193 (etiolated shoot, 8-days old). (B,C) Expanded regions of the clustered correlation map. To the right of each region, contigs are identified by contig number and putative identification (SWISS-PROT/TrEMBL identifier and description), if available. To the left of each region, the relevant portion of the dendrogram used to reorder the original data table is shown. Note the differences in color scale for A, B, and C, as the color scale was chosen in each case to optimally represent the required interval of EST counts.
The same procedure is used to assign pairwise distances to cDNA libraries (Fig. 1) and reorder them in the table of EST counts. Adjacent libraries are then those apparently expressing the most similar subsets of genes (Fig. 1). The tree derived from the library correlation analysis is shown in Figure 2. As would be predicted, libraries derived from similar tissue types (callus libraries 1275, 961, and 75) or libraries derived from overlapping tissues (library 535 from panicle at ripening stage and library 1073 from immature seed) cluster together. This validates our method, and suggests that the cDNA libraries analyzed are reliable sources of expression data.
Figure 2.

Dendrogram showing cDNA library similarities. Each library is identified by the dbEST library identifier and a short description.
Other nearest neighbours on the tree include libraries 499 and 307 (panicle at flowering and green shoot at 8-days old, respectively). Interestingly, library 193 (etiolated shoot 8-days old) and library 307 (green shoot at 8 days old), are not paired, suggesting significant differences in expression patterns between these tissues. This is explained by the massive induction of light-regulated transcripts that occurs during the greening process, which are present in green but not etiolated tissue. These differences are also illustrated in the clustered correlation map shown in Figure 3.
Once optimally reordered according to both contig and to library similarity, the expression measurement table can be graphically represented as a map, with the color in a given cell reflecting the underlying EST count (Fig. 1). Following the reordering of rows and columns, clusters of genes exhibiting coordinated expression appear as blocks of similar color, and are readily identified either by visual inspection, or automatically via the use of classical image-processing techniques.
Figure 3 shows the complete clustered correlation map generated from the rice data. To illustrate ways in which the data may be explored, two fractions of the map have been expanded and annotated with contig numbers and putative identities (Fig. 3B, C). These show that contigs in close proximity on the map may represent genes with related functions. In addition, regions indicated by arrows on the map correspond to clusters of contigs expressed more or less specifically in a particular library; for example the green arrow indicates contig sequences expressed at high levels in library 307 (green shoot, 8-days old), many of which encode chloroplast component precursors.
The clustered correlation map therefore enables expression patterns of interest to be selected prior to identification of specific sequences. The clustered correlation map and associated results are available from the authors.
DISCUSSION
This report presents a new protocol for the analysis of EST data aimed at discovering correlated patterns of gene expression between different tissues, with the rice EST database as a test set. Despite the inherent noise of EST data, and the relatively small size of the data set analyzed, our results show that coherent patterns of gene expression can be revealed. The approach permits both the association of tissues via their common patterns of gene expression and the association of genes via their tissue-dependent expression patterns.
The set of cDNA libraries used to generate the rice ESTs are sufficiently varied to cover each of the principal tissues in the plant life cycle (Yamamoto and Sasaki 1997). In addition, groups of libraries representing the same tissues at different developmental stages (e.g., libraries from panicle tissues) or the same tissue type under different growth conditions (e.g. libraries from callus tissue) are present within the 10 libraries analyzed in our study. By use of this data set, our methods show how whole transcriptomes from different tissues can be compared in a statistical manner. Tissues for which gene expression profiles would be expected to overlap, such as 1073 and 535 (immature seed and panicle at ripening stage, respectively), or 961, 75, and 1275 (all from callus), are found to have overlapping profiles. Similarly, genes with inter-related functions, such as those involved in seedling physiology shown in Table 3, are found to have correlated expression profiles. The strength of the method lies in the fact that clustering is based on expression profiles; prior knowledge of sequence identity is not required. Furthermore, the anonymous sequences in Table 3 (i.e., contigs 12, 15, 83, 366, 367, and 378 in the first cluster) illustrate how expression profile clustering might aid candidate gene selection; in this particular example, the anonymous sequences in Table 3 would be good candidates for identification of novel genes involved in seed metabolism.
Clustering genes by expression profile may also enable identification of novel regulatory elements, as genes with correlated profiles might be expected to have regulatory elements in common (DeRisi et al. 1997; Brazma et al. 1998). Other possible uses include the identification of surrogate markers (e.g., Figueroa et al. 1998; Johnson et al. 1998), whereby a conveniently assayed biomarker allows monitoring or prediction of a particular condition (e.g., a gene or cluster of genes whose expression profiles consistently correlate with an agricultural trait of interest).
Overall similarities between tissues are clearly revealed by the dendrogram or the two-dimensional clustered correlation map representation of expression profiles. These types of observations may contribute to a new understanding of the interrelationships between different tissues and developmental pathways. For example, it has long been hypothesized that leaves and certain floral organs derive from a common ancestral organ, an idea supported by documented instances of common regulatory processes during leaf and floral morphogenesis (Arber and Parkin 1907; Satina and Blakeslee 1941; Steeves and Sussex 1989; Bowman et al. 1993; Hofer et al. 1997). Large-scale studies of gene expression may support these hypotheses by identifying tissues with similar or overlapping patterns of gene expression.
The value of expression profiles from EST collections, and the potential for functional prediction are entirely dependent on the available data. In addition, certain assumptions are implicit when using EST collections for transcript profiling. First, to ensure that tag frequency correlates with the actual transcript abundance in a given tissue, the cDNA libraries should have been prepared in a comparable manner. For example, normalized cDNA libraries (e.g., Patanjali et al.1991), in which the frequencies of clones representing abundant and rare transcripts are normalized with respect to one another, are not suitable for a study of this type (although some large effect might still be detectable by a binary presence/absence coding of the original multi-condition EST counts). In addition, ESTs should be contributed to the databases without prior selection for novel sequences (in some cases redundancy within EST sets is reduced by first screening the existing EST set and then only submitting sequences not already present). Potential errors may also originate from the EST-clustering procedure. For instance, ESTs derived from the 5′ and 3′ ends of a long transcript may constitute discrete contigs. However, this is not anticipated to be a major problem in the technique presented here.
The potential of large-scale gene expression analysis is most often discussed in the context of hybridization techniques such as cDNA microarrays (see Duggan et al. 1999) or synthetic oligonucleotide arrays (for a recent review, see Lipshutz et al. 1999). These technologies have been applied in several systems including two independent studies of the yeast transcriptome (Wodicka et al. 1997; Eisen et al. 1998), the monitoring of 1000 human genes in activated human T-cells (Schena et al. 1996), and the analysis of the fibroblast transcriptional response to serum (Iyer et al. 1999). Studies have also been performed on subsets of Arabidopsis cDNAs (Schena et al. 1995; Desprez et al. 1998) and on a subset of human genes related to inflammation (Heller et al. 1997). These accomplishments should not hide the fact that the high-density microarray technology is still only marginally accessible to academic laboratories (Cheung et al. 1999). On the other hand, the established EST (Adams et al. 1992; Okubo et al. 1992) or SAGE (Velculescu et al. 1995) approaches have proven their capacity in monitoring gene expression in a large variety of experimental systems (Lee et al. 1995; Anderson and Seilhamer 1997; Madden et al. 1997; Velculescu et al. 1997; Zhang et al. 1997; He et al. 1998; Hibi et al. 1998; Takenaka et al. 1998; de Waard et al. 1999), including plants (Uchimiya et al. 1992; Hofte et al. 1993; Liu et al. 1995; Yamamoto et al. 1997). The EST approach is unique in allowing both expression measurements and the discovery of new genes at the same time, whereas microarray techniques are limited to a repertoire of previously identified sequences. Furthermore, ESTs have a wide range of applications including mapping and studies of colinearity (Sasaki 1996). Several studies have shown that EST/SAGE sampling experiments can reliably identify differentially expressed genes (Lee et al. 1995; Audic and Claverie 1997; He et al. 1998; Greller and Tobin 1999). In more recent work, it has been shown that the analysis of EST data can provide valuable insight into the existence and the expression patterns of alternative transcript forms (Burke et al. 1998; Gautheret et al. 1998). In the present article, we show that the analysis of this data can be extended beyond the simple recognition of differential expression to the identification of gene subsets exhibiting coordinated expression patterns.
From a statistical point of view, multicondition expression data obtained from hybridization arrays or cDNA tag sampling are quite similar. They both result in gene abundance estimates stored in a gene versus cDNA library table. Thus, it is expected that after a first step of signal processing (such as noise filtering, pixel detection, thresholding, and normalization) specific to the microarray technique involved, similar statistical treatment could be applied. In the case of EST or tag data, initial signal processing consists mainly of selecting genes and libraries for which total tag counts are large enough to eventually lead to statistically significant inferences (in our own study, selecting contigs representing five or more ESTs, and those cDNA libraries from which >800 ESTs have been generated). Our analysis is then quite similar to the approach independently followed by Eisen et al. (1998) to identify coordinated gene expression in yeast using cDNA microarrays. For instance, both use the Pearson correlation coefficient as the primary statistical parameter to quantify the similarity of expression profiles. However, slightly different metrics for the subsequent hierarchical clustering of genes were used; whereas Eisen et al. (1998) directly used the pairwise correlation coefficient between genes, we computed a true Euclidean distance from the whole gene versus gene correlation coefficient matrix. The distance between two genes is thus computed from the similarity of their expression with all other genes in the matrix, and not from a single pairwise correlation. This procedure, which minimizes the influence of random fluctuation in tag counting, might also serve in smoothing the noise of microarray pixel data. The sensitivity of expression analysis from EST data depends to an extent on the number of ESTs sequenced. Theoretically, expression profiles could be derived for even very weakly expressed genes if sufficient numbers of ESTs were generated. This contrasts with current limitations of microarray technology, in which sensitivity is limited by the quantity of RNA used per hybridization, making detection of very weakly expressed transcripts difficult (see Duggan et al. 1999).
The nature of our multicondition expression data also allowed us to perform hierarchical clustering of both rows (genes) and columns (cDNA libraries), resulting in a two-dimensional clustering (following Weinstein et al. 1997) indicative of both gene and library expression similarity. Similar genes are thus graphically clustered into islands of simple shape (Fig. 3). In a subsequent development of our display program, the visual recognition of these islands will be supplemented by standard image processing algorithms, an attractive alternative to the complexity of more abstract clustering algorithms.
With increased definition of EST collections, (e.g., cDNA libraries prepared from tighter developmental windows, or cDNA libraries prepared from specific cell types), digital expression profiles will become increasingly valuable sources of expression information. This information, alongside expression data from other large-scale approaches, has an important role to play in our efforts to assign function to anonymous sequences.
METHODS
EST Database and Contigs
Rice ESTs were extracted from GenBank version 107 with Batch Entrez at the National Center for Biotechnology Information (http://www.ncbi.nlm.nih.gov/Entrez/batch.html). dbEST (Boguski et al. 1993) reports were obtained with the Sequence Retrieval System (SRS) at the Human Genome Mapping Project (http://iron.hgmp.mrc.ac.uk/).
Rice ESTs were quality controlled and organized into contigs as described elsewhere (Ewing et al. 1999; http://igs-server.cnrs-mrs.fr/ewing). The protocol involved a classical preliminary cleaning of the EST data (vector removal, elimination of low quality sequences), a stringent pairwise comparison of all cleaned EST sequences, followed by the separate contiging of overlapping ESTs. Because our aim is a statistical analysis of gene expression profiles, contigs derived from fewer than five constituent ESTs were excluded from the study. Putative identities (Table 2) were assigned to every resulting contig sequence by querying them against the SWISS-PROT/TrEMBL (36.0) database (Bairoch and Apweiler 1998) with gapped BLASTx (Altschul et al. 1997).
Contig and Library Correlation Analysis
The similarity between contigs (genes) or cDNA library expression profiles was estimated by Pearson's r coefficient, quantifying the degree of linear correlation between two variables, X = (x1,x2,...,xN) and Y = (y1,y2,...,yN).
Given a sample of N pairs of score, r quantifies the extent to which we can make useful predictions on the value of Y from the knowledge of the corresponding X score. The measure of correlation, r, is computed as
 |
and has a value between −1 and +1. Values of r near to 0 indicate a low degree of correlation. Positive values of r indicate that high values of X are associated with high values of Y. Negative values of r indicate that low values of X are associated with high values of Y (anti-correlation) or vice versa.
The pairwise gene expression correlation coefficients were computed by the repetitive use of the above formula, in which X and Y are different genes associated with their corresponding EST counts (x1,x2, … ,xN) and (y1,y2,, … ,yN) measured in cDNA libraries 1,2 ,N (with N = 10). The result of these computations constitutes a 707 × 707 symmetrical matrix of correlation values and a matrix of pairwise gene distances was subsequently derived from it as described below.
Alternatively, a table of the pairwise library correlation coefficient was computed, now taking X and Y as different libraries associated with the EST counts (x1,x2, … ,xN) and (y1,y2, … ,yN) corresponding to the various genes 1,2, … ,N (with N = 707). The result of these computations constitutes a 10 × 10 symmetrical matrix of correlation values. As for the gene distance values, a matrix of pairwise library distances was derived as described below.
Hierarchical Classification of Genes and Libraries
The hierarchical classification (dendrogram) of objects requires the calculation of the distance between all pairs of objects. From the gene correlation matrix constructed previously (the elements of which are r values ranging from −1 to 1), a pairwise Euclidean distance matrix was derived as follows. The Euclidean distance d, between two sets, X = (x1,x2, … ,xN) and Y = (y1,y2, … ,yN) is simply computed as
 |
The above formula can then be used for all pairs of genes X and Y defined by their list of correlation coefficients (x1,x2, … ,xN) and (y1,y2, … ,yN).
By the same method, the 10 × 10 matrix of library correlation coefficients was used to derive pairwise distance values between libraries. The gene and library distance matrices were then used to build their associated dendrograms according to the UPGMA algorithm (Sokal and Michener 1958), implemented in the neighbor program (Kuhner and Felsenstein 1994). Dendrograms were plotted with the njplot program (Perriere and Gouy 1996). The order of contigs and libraries in their respective dendrograms were used to reorder the original data table. The reordered data table was then used as the basis for plotting the clustered correlation map, generated with Matlab 5.2 (MathWorks, Inc.).
Acknowledgments
The financial support of Novartis Crop Protection, Inc. is gratefully acknowledged. We also thank Dr David Robertson for help with dendrograms and Suzanne Dixon for reading the manuscript.
The publication costs of this article were defrayed in part by payment of page charges. This article must therefore be hereby marked “advertisement” in accordance with 18 USC section 1734 solely to indicate this fact.
Footnotes
E-MAIL ewing@igs.cnrs-mrs.fr; FAX 33 (0)4 91 16 45 49.
REFERENCES
- Aaronson J, Eckman B, Blevins R, Borkowski J, Myerson J, Imran S, Elliston K. Toward the development of a gene index to the human genome: An assessment of the nature of high-throughput EST sequence data. Genome Res. 1996;6:829–845. doi: 10.1101/gr.6.9.829. [DOI] [PubMed] [Google Scholar]
- Adams M, Dubnick M, Kerlavage A, Moreno R, Kelley J, Utterback T, Nagle J, Fields C, Venter J. Sequence identification of 2,375 human brain genes. Nature. 1992;355:632–634. doi: 10.1038/355632a0. [DOI] [PubMed] [Google Scholar]
- Altschul SF, Gish W, Miller W, Myers EW, Lipman DJ. Basic local alignment search tool. J Mol Biol. 1990;215:403–410. doi: 10.1016/S0022-2836(05)80360-2. [DOI] [PubMed] [Google Scholar]
- Altschul S, Madden T, Schaffer A, Zhang J, Zhang Z, Miller W, Lipman DJ. Gapped BLAST and PSI-BLAST: A new generation of protein database search programs. Nucleic Acids Res. 1997;25:3389–3402. doi: 10.1093/nar/25.17.3389. [DOI] [PMC free article] [PubMed] [Google Scholar]
- Anderson L, Seilhamer J. A comparison of selected mRNA and protein abundances in human liver. Electrophoresis. 1997;18:533–537. doi: 10.1002/elps.1150180333. [DOI] [PubMed] [Google Scholar]
- Arber E, Parkin J. On the origin of angiosperms. J Linnean Soc. 1907;38:29–80. [Google Scholar]
- Audic S, Claverie J-M. The significance of digital gene expression profiles. Genome Res. 1997;7:986–995. doi: 10.1101/gr.7.10.986. [DOI] [PubMed] [Google Scholar]
- Bairoch A, Apweiler R. Nucleic Acids Res. 1998;26:38–42. doi: 10.1093/nar/26.1.38. [DOI] [PMC free article] [PubMed] [Google Scholar]
- Boguski MS, Lowe TMJ, Tolstoshev CM. DbEST—database for “expressed sequence tags”. Nat Genet. 1993;4:332–333. doi: 10.1038/ng0893-332. [DOI] [PubMed] [Google Scholar]
- Bowman J, Alvarez J, Weigel D, Meyerowitz E, Smyth D. Control of flower development in Arabidopsis thaliana by apetala1 and interacting genes. Development. 1993;119:721–743. [Google Scholar]
- Brent R, Finley RL. Understanding gene and allele function with two-hybrid methods. Annu Rev Genet. 1997;31:663–704. doi: 10.1146/annurev.genet.31.1.663. [DOI] [PubMed] [Google Scholar]
- Brown PO, Botstein D. Exploring the new world of the genome with DNA microarrays. Nat Genet. 1999;21:33–37. doi: 10.1038/4462. [DOI] [PubMed] [Google Scholar]
- Burke J, Wang H, Hide W, Davison DB. Alternative gene form discovery and candidate gene selection from gene indexing projects. Genome Res. 1998;8:276–290. doi: 10.1101/gr.8.3.276. [DOI] [PMC free article] [PubMed] [Google Scholar]
- Cheung VG, Morley M, Aguilar F, Massimi A, Kucherlapati R, Childs G. Making and reading microarrays. Nat Genet (Suppl.) 1999;21:15–19. doi: 10.1038/4439. [DOI] [PubMed] [Google Scholar]
- Claverie J-M. Genomes, molecular biology and drug discovery. Chapter 4. Academic Press; 1996. Exploring the vast territory of uncharted ESTs; pp. 56–71. [Google Scholar]
- Cooke R, Raynal M, Laudie M, Grellet F, Delseny M, Morris P, Guerrier D, Giraudat J, Quigley F, Clabault G, et al. Further progress towards a catalogue of all Arabidopsis genes: Analysis of a set of 5000 non-redundant ESTs. Plant J. 1996;9:101–124. doi: 10.1046/j.1365-313x.1996.09010101.x. [DOI] [PubMed] [Google Scholar]
- Delseny M, Cooke R, Raynal M. The Arabidopsis thaliana cDNA sequencing projects. FEBS Lett. 1997;405:129–132. doi: 10.1016/s0014-5793(97)00184-1. [DOI] [PubMed] [Google Scholar]
- DeRisi JL, Penland L, Brown PO, Bittner ML, Meltzer PS, Ray M, Chen Y, Su YA, Trent JM. Use of a cDNA microarray to analyse gene expression patterns in human cancer. Nat Genet. 1996;14:457–460. doi: 10.1038/ng1296-457. [DOI] [PubMed] [Google Scholar]
- DeRisi JL, Iyer VR, Brown PO. Exploring the metabolic and genetic control of gene expression on a genomic scale. Science. 1997;278:680–686. doi: 10.1126/science.278.5338.680. [DOI] [PubMed] [Google Scholar]
- Desprez T, Amselem J, Caboche M, Hofte H. Differential gene expression in Arabidopsis monitored using cDNA arrays. Plant J. 1998;14:643–652. doi: 10.1046/j.1365-313x.1998.00160.x. [DOI] [PubMed] [Google Scholar]
- de Waard V, Berg BMM, Veken J, Heienbrok R, Pannekoek H, Zonneveld AJ. Serial analysis of gene expression to assess the endothelial cell response to an atherogenic stimulus. Gene. 1999;226:1–8. doi: 10.1016/s0378-1119(98)00577-0. [DOI] [PubMed] [Google Scholar]
- Doebley J, Lukens L. Transcriptional regulators and the evolution of plant form. Plant Cell. 1998;10:1075–1082. doi: 10.1105/tpc.10.7.1075. [DOI] [PMC free article] [PubMed] [Google Scholar]
- Duggan DJ, Bittner M, Chen Y, Meltzer P, Trent JM. Expression profiling using cDNA microarrays. Nat Genet (Suppl.) 1999;21:10–14. doi: 10.1038/4434. [DOI] [PubMed] [Google Scholar]
- Eisen M, Spellman P, Brown P, Botstein D. Cluster analysis and display of genome-wide expression patterns. Proc Natl Acad Sci. 1998;95:14863–14868. doi: 10.1073/pnas.95.25.14863. [DOI] [PMC free article] [PubMed] [Google Scholar]
- Ewing R, Poirot O, Claverie J-M. Comparative analysis of the Arabidopsis and rice expressed sequence tag (EST) sets. Silico Biol. 1999;1:18. http://www.bioinfo.de/isb/1999/o1/0018 [ http://www.bioinfo.de/isb/1999/o1/0018] ] [PubMed] [Google Scholar]
- Figueroa JA, Raad S, Tadlock L, Speights VO, Rinehart JJ. Differential expression of insulin-like growth factor binding proteins in high versus low Gleason score prostate cancer. J Urol. 1998;159:1379–1383. [PubMed] [Google Scholar]
- Gautheret D, Poirot O, Lopez F, Audic S, Claverie J-M. Alternative polyadenylation in human mRNAs: A large-scale analysis by EST clustering. Genome Res. 1998;8:524–530. doi: 10.1101/gr.8.5.524. [DOI] [PubMed] [Google Scholar]
- Greller LD, Tobin FL. Detecting selective expression of genes and proteins. Genome Res. 1999;9:282–296. [PMC free article] [PubMed] [Google Scholar]
- He TC, Sparks AB, Rago C, Hermeking H, Zawel L, Costa LT, Morin PJ, Vogelstein B, Kinzler KW. Identification of c-MYC as a target of the APC pathway. Science. 1998;281:1509–1512. doi: 10.1126/science.281.5382.1509. [DOI] [PubMed] [Google Scholar]
- Heller RA, Schena M, Chai A, Shalon D, Bedilion T, Gilmore J, Woolley DE, Davis RW. Discovery and analysis of inflammatory disease-related genes using cDNA microarrays. Proc Natl Acad Sci. 1997;94:2150–2155. doi: 10.1073/pnas.94.6.2150. [DOI] [PMC free article] [PubMed] [Google Scholar]
- Hibi K, Liu Q, Beaudry GA, Madden SL, Westra WH, Wehage SL, Yang SC, Heitmiller RF, Bertelsen AH, Sidransky D, Jen J. Serial analysis of gene expression in non-small cell lung cancer. Cancer Res. 1998;58:5690–5694. [PubMed] [Google Scholar]
- Hillier L, Lennon G, Becker M, Bonaldo M, Chiapelli B, Dietrich N, DuBuque T, Favello A, Gish W, Hawkins M, et al. Generation and analysis of 280,000 human expressed sequence tags. Genome Res. 1996;6:807–828. doi: 10.1101/gr.6.9.807. [DOI] [PubMed] [Google Scholar]
- Hofer J, Turner L, Hellens R, Ambrose M, Matthews P, Michael A, Ellis N. Unifoliata regulates leaf and flower morphogenesis in pea. Curr Biol. 1997;7:581–587. doi: 10.1016/s0960-9822(06)00257-0. [DOI] [PubMed] [Google Scholar]
- Hofte H, Desprez T, Amselem J, Chiapello H, Caboche M, Moisan A, Jourjon M, Charpenteau J, Berthomieu P, Guerrier D. An inventory of 1152 expressed sequence tags obtained by partial sequencing of cDNAs from Arabidopsis thaliana. Plant J. 1993;4:1051–1061. doi: 10.1046/j.1365-313x.1993.04061051.x. [DOI] [PubMed] [Google Scholar]
- Iyer V, Eisen M, Ross D, Schuler G, Moore T, Lee J, Trent J, Staudt L, Hudson J, Boguski M, Lashkari D, Shalon D, Botstein D, Brown PO. The transcriptional program in the response of human fibroblasts to serum. Science. 1999;283:83–87. doi: 10.1126/science.283.5398.83. [DOI] [PubMed] [Google Scholar]
- Johnson BJ, Estrada I, Shen Z, Ress S, Willcox P, Colston MJ, Kaplan G. Differential gene expression in response to adjunctive recombinant human interleukin-2 immunotherapy in multidrug-resistant tuberculosis patients. Infect Immun. 1998;66:2426–2423. doi: 10.1128/iai.66.6.2426-2433.1998. [DOI] [PMC free article] [PubMed] [Google Scholar]
- Kuhner MK, Felsenstein J. A simulation comparison of phylogeny algorithms under equal and unequal evolutionary rates. Mol Biol Evol. 1994;11:459–468. doi: 10.1093/oxfordjournals.molbev.a040126. [DOI] [PubMed] [Google Scholar]
- Lee N, Weinstock K, Kirkness E, Earlehughes J, Marmaros RFS, Glodek AJ, Adams M, Kerlavage A, Venter CFJ. Comparative expressed-sequence-tag analysis of differential gene-expression profiles in pc-12 cells before and after nerve growth- factor treatment. Proc Natl Acad Sci. 1995;92:8303–8307. doi: 10.1073/pnas.92.18.8303. [DOI] [PMC free article] [PubMed] [Google Scholar]
- Lipshutz RJ, Fodor SPA, Gingeras TR, Lockhart DJ. High density synthetic oligonucleotide arrays. Nat Genet (Suppl.) 1999;21:20–24. doi: 10.1038/4447. [DOI] [PubMed] [Google Scholar]
- Liu L, Hara C, Umeda M, Zhao Y, Okita T, Uchimiya H. Analysis of randomly isolated cDNAs from developing endosperm of rice (Oryza sativa): Evaluation of expressed sequence tags, and expression levels of mRNAs. Plant Mol Biol. 1995;29:685–689. doi: 10.1007/BF00041159. [DOI] [PubMed] [Google Scholar]
- Madden SL, Galella EA, Zhu J, Bertelsen AH, Beaudry GA. SAGE transcript profiles for p53-dependent growth regulation. Oncogene. 1997;15:1079–1085. doi: 10.1038/sj.onc.1201091. [DOI] [PubMed] [Google Scholar]
- Newman T, Bruijn F, Green P, Keegstra K, Kende H, McIntosh L, Ohlrogge J, Raikhel N, Somerville S, Thomashow M, et al. Genes galore: A summary of methods for accessing results from large-scale partial sequencing of anonymous Arabidopsis cDNA clones. Plant Physiol. 1994;106:1241–1255. doi: 10.1104/pp.106.4.1241. [DOI] [PMC free article] [PubMed] [Google Scholar]
- Okubo K, Hori N, Matoba R, Niiyama T, Fukushima A, Kojima Y, Matsubara K. Large scale cDNA sequencing for analysis of quantitative and qualitative aspects of gene expression. Nat Genet. 1992;2:173–179. doi: 10.1038/ng1192-173. [DOI] [PubMed] [Google Scholar]
- Patanjali SR, Parimoo S, Weisman SM. Construction of a uniform-abundance (normalised) cDNA library. Proc Natl Acad Sci. 1991;85:2444–2448. doi: 10.1073/pnas.88.5.1943. [DOI] [PMC free article] [PubMed] [Google Scholar]
- Perriere G, Gouy M. WWW-query: An online retrieval system for biological sequence banks. Biochimie. 1996;78:364–369. doi: 10.1016/0300-9084(96)84768-7. [DOI] [PubMed] [Google Scholar]
- Sasaki T. Rice cDNAs as a model for expressed genes of plants. Symp Soc Exp Biol. 1996;50:11–15. [PubMed] [Google Scholar]
- Satina S, Blakeslee A. Periclinal chimeras in Datura stramonium in relation to development of leaf and flower. Am J Bot. 1941;28:862–871. [Google Scholar]
- Schena M, Shalon D, Davis RW, Brown PO. Quantitative monitoring of gene expression patterns with a complementary DNA microarray. Science. 1995;270:467–470. doi: 10.1126/science.270.5235.467. [DOI] [PubMed] [Google Scholar]
- Schena M, Shalon D, Heller R, Chai A, Brown P, Davis R. Parallel human genome analysis: Microarray-based expression monitoring of 1000 genes. Proc Natl Acad Sci. 1996;93:10614–10619. doi: 10.1073/pnas.93.20.10614. [DOI] [PMC free article] [PubMed] [Google Scholar]
- Schena M, Theriault TP, Konrad K, Lachenmeier E, Davis RW. Microarrays: Biotechnology's discovery platform for functional genomics. Trends Biotechnol. 1998;16:301–316. doi: 10.1016/s0167-7799(98)01219-0. [DOI] [PubMed] [Google Scholar]
- Sokal R, Michener C. A statistical method for evaluating systematic relationships. Univ Kansas Sci Bull. 1958;28:1409–1438. [Google Scholar]
- Steeves T A, Sussex I M. Patterns in plant development. Cambridge, UK: Cambridge University Press; 1989. [Google Scholar]
- Takenaka M, Imai E, Kaneko T, Ito T, Moriyama T, Yamauchi A, Hori M, Kawamoto S, Okubo K. Isolation of genes identified in mouse renal proximal tubule by comparing different gene expression profiles. Kidney Int. 1998;53:562–572. doi: 10.1046/j.1523-1755.1998.00808.x. [DOI] [PubMed] [Google Scholar]
- Uchimiya H, Kidou S, Shimazaki T, Aotsuka S, Takamatsu S, Nishi R, Hashimoto H, Matsubayashi Y, Kidou N, Umeda M, Kata A. Random sequencing of cDNA libraries reveals a variety of expressed genes in cultured-cells of rice (Oryza sativa) Plant J. 1992;2:1005–1009. [Google Scholar]
- Umeda M, Hara C, Matsubayashi Y, Li H, Liu Q, Tadokoro F, Aotsuka S, Uchimiya H. Expressed sequence tags from cultured-cells of rice (Oryza sativa) under stressed conditions—analysis of transcripts of genes engaged in ATP-generating pathways. Plant Mol Biol. 1994;25:469–478. doi: 10.1007/BF00043875. [DOI] [PubMed] [Google Scholar]
- Velculescu V, Zhang L, Vogelstein B, Kinzler K. Serial analysis of gene expression. Science. 1995;270:484–487. doi: 10.1126/science.270.5235.484. [DOI] [PubMed] [Google Scholar]
- Velculescu V, Zhang L, Zhou W, Vogelstein B, Basrai M, Bassett D E, Hieter P, Vogelstein B, Kinzler K. Characterisation of the yeast transcriptome. Cell. 1997;88:243–251. doi: 10.1016/s0092-8674(00)81845-0. [DOI] [PubMed] [Google Scholar]
- von Arnim A, Deng X. Light control of seedling development. Annu Rev Plant Physiol Plant Mol Biol. 1996;47:215–243. doi: 10.1146/annurev.arplant.47.1.215. [DOI] [PubMed] [Google Scholar]
- Weinstein J, Myers T, Connor P, Friend S, Kohn KW, Fojo T, Bates S, Rubinstein L, Anderson N, Buolamwini J, et al. An information-intensive approach to the molecular pharmacology of cancer. Science. 1997;275:343–349. doi: 10.1126/science.275.5298.343. [DOI] [PubMed] [Google Scholar]
- Wen X, Fuhrman S, Michaels G, Carr D, Smith S, Barker J, Somogyi R. Large-scale temporal gene expression mapping of central nervous system development. Proc Natl Acad Sci. 1998;95:334–339. doi: 10.1073/pnas.95.1.334. [DOI] [PMC free article] [PubMed] [Google Scholar]
- Wodicka L, Dong H, Mittmann M, Ho MH, Lockhart DJ. Genome-wide expression monitoring in Saccharomyces cerevisiae. Nat Biotechnol. 1997;15:1359–1367. doi: 10.1038/nbt1297-1359. [DOI] [PubMed] [Google Scholar]
- Wolfsberg T, Landsman D. A comparison of expressed sequence tags (ESTs) to human genomic sequences. Nucleic Acids Res. 1997;25:1626–1632. doi: 10.1093/nar/25.8.1626. [DOI] [PMC free article] [PubMed] [Google Scholar]
- Yamamoto K, Sasaki T. Large scale EST sequencing in rice. Plant Mol Biol. 1997;35:135–144. [PubMed] [Google Scholar]
- Zhang L, Zhou W, Velculescu V, Kern S, Hruban R, Hamilton S, Vogelstein B, Kinzler K. Gene expression profiles in normal and cancer cells. Science. 1997;276:1268–1272. doi: 10.1126/science.276.5316.1268. [DOI] [PubMed] [Google Scholar]