

Abstract
We have generated and analyzed >50,000 shotgun clones from 1059 Fugu cosmid clones. All sequences have been minimally edited and searched against protein and DNA databases. These data are all displayed on a searchable, publicly available web site at http://fugu.hgmp.mrc.ac.uk/. With an average of 50 reads per cosmid, this is virtually nonredundant sequence skimming, covering 30%–50% of each clone. This essentially random data set covers nearly 25 Mb (>6%) of the Fugu genome and forms the basis of a series of whole genome analyses which address questions regarding gene density and distribution in the Fugu genome and the similarity between Fugu and mammalian genes. The Fugu genome, with eight times less DNA but a similar gene repertoire, is ideally suited to this type of study because most cosmids contain more than one identifiable gene. General features of the genome are also discussed. We have made some estimation of the syntenic relationship between mammals and Fugu and looked at the efficacy of ORF prediction from short, unedited Fugu genomic sequences. Comparative DNA sequence analyses are an essential tool in the functional interpretation of complex vertebrate genomes. This project highlights the utility of using the Fugu genome in this kind of study.
Despite massive investment in genome mapping and DNA sequencing over the last 10 years, large-scale sequencing of vertebrate genomes has been initiated only very recently. This is partly because the initial emphasis has been on developing mapping, sequencing, and assembly technologies and partly because sequence-ready contigs of large regions of the human genome have not been available. Many valuable lessons have been learned—at no small expense—from the bacterial, yeast, and, in particular, the Caenorhabditis elegans projects. It is also clear, however, that mammalian genomes may present additional problems relating to the generation of cloned DNA from some regions, sequence assembly of highly repetitive DNA, and the large size of the genomes involved.
To interpret much of the data, comparative sequencing of genomic regions from other vertebrates will be necessary. The identification of conserved sequences across species has always been a key technique in the identification of genes. In addition, sequence comparison in invertebrate projects has identified many genes by sequence similarity and in many cases has allowed speculation on function. Now that the resolution of genomes is approaching the single base pair, powerful analytical methods need to be used to define the many elements—both coding and non-coding—that are contained within the human genome.
Despite the need for comparison, there is little investment in other vertebrate sequencing projects at this time. Small regions of conserved synteny within the mouse genome have been pinpointed for complete genomic sequencing, and this will provide an opportunity to compare not only precise orders of genes but also regions in and around the coding sequence itself. This should lead to the identification of other conserved elements within the DNA sequence. However, the mouse, as a sequence model, has some disadvantages. The first is cost, as the mouse genome is about the same size as the human. Second, where comparative analyses have been performed between mouse and human genomic regions, there are many noncoding regions of similarity. Whereas this kind of comparison identifies a large number of potential regulatory sequences, it is unlikely that all of these have functional significance (for review, see Hardison et al. 1997). For example, comparative sequence analysis of human and murine genomic DNA across the Bruton's tyrosine kinase loci (Oeltjen et al. 1997) revealed 179 conserved elements with >60% identity across 50 bp or more, of which only 34 were coding exons. This represents 25% of the total human DNA analyzed, and it is unlikely that all of these are functional elements. The degree of conservation of noncoding sequence between syntenic regions of human chromosome 12p13 and mouse chromosome 6 are much higher still (Ansari-Lari et al. 1998). Furthermore, it is difficult to determine whether many of these regions are conserved due to differing rates of evolutionary divergence or because of functional significance without comparing these genomic regions in a third vertebrate. Given that many critical control elements are very small (<50 bp), there is clearly a need for direct comparison between genomic DNA from more divergent vertebrates. Although it is true that the significant differences in biology between fish and mammals means that a number of regulatory mechanisms will be different between the two (or completely absent in one or the other), preliminary comparisons between genomic regions in man and Fugu rubripes demonstrate just how much more clearly small, conserved elements are detected on such a clean background (Miles et al. 1998). With five times the divergence time between fish and mammals, compared with mouse and man, it is obvious that some comparisons will be much more meaningful statistically between the former pair.
The strategies used in obtaining the complete sequence of large genomes, whether from whole shotgun libraries or clone contigs, are remarkably uniform and involve a high rate of redundancy. This is necessary to have a high accuracy rate and is still more rapid and cost effective than other procedures. In contrast, the technique of sequence skimming or scanning has become popular when looking for specific genes through smaller contigs, the premise being that exons are hit by chance rather than through a directed effort. The success of this technique is related to the density of identifiable sequence elements (usually exons) and does not rely on a 100% accurate sequence. Recent studies suggest that twofold redundancy sequencing of the human genome is highly informative in terms of gene and EST identification (Bouck et al. 1998).
The genome of the pufferfish F. rubripes has been presented as a model vertebrate genome (Brenner et al. 1993). As a vertebrate, Fugu contains a similar gene set to man but in a genome eight times smaller. Fugu genes have the same structure as their mammalian counterparts but are generally much smaller and more densely packed throughout the genome. With an estimated density of one gene every 6-7 kb, the sequence scanning approach becomes highly successful and allows the identification of many genes within even moderate sized clones such as cosmids. The identification of two or more known genes on a cosmid clone allows comparisons of synteny with mammalian genomes.
We present data on the sequence scanning of over 1000 cosmid clones from a publicly available and well-characterized 7 × coverage whole genome Fugu cosmid library. Over 50,000 sequences have been generated from the inserts of these cosmids representing an essentially random set of genomic subclones or STSs. Because these sequences can be grouped together according to their parent cosmid clones, close-range physical linkage data are available. By using a combination of similarity searches against existing DNA databases and coding sequence prediction packages, we estimate that >40% of these sequences contain coding exons. This supports the expected figures for gene density in the Fugu genome.
We have developed a rapid and economical approach to sequence analysis of vertebrate genomes and generated a publicly accessible framework within which we have deposited the sequences as well as all related data. This technology puts genomic sequencing within the reach of more modestly funded labs and does not involve any form of complex automation. The 1059 cosmids scanned represent 24.4 Mb (6%) of the Fugu genome. This is equivalent to 180 Mb of the human genome.
RESULTS AND DISCUSSION
Sequence Generation and Processing
A total of 1059 cosmid clones have been sequence scanned. Cosmid clones were selected from an unamplified Fugu genomic cosmid library containing 76,000 clones (approximately sevenfold coverage of the Fugu genome). The library is available as a gridded filter set from the UK HGMP Resource Centre (http://www.hgmp.mrc.ac.uk). Of these cosmids, 82% were selected at random, whereas others were targeted via specific probes. The data set has been treated on the assumption that it forms a random sample of the Fugu genome, and comparison with data from Brenner et al. (1993) supports this view. A total of 52,668 sequences were generated from the inserts of the 1059 cosmids, giving an average of 50 sequence reads per cosmid clone. Taking the average insert size of the cosmids at 38–40 kb, this equates to 30%–50% single-pass coverage. Sequences were generated mainly by dye terminator cycle sequencing of unpurified PCR templates. This was made possible by using limiting concentrations of low annealing temperature (49°C) primers and dNTPs in the PCR reaction followed by a different high-annealing temperature (60°C) primer for the sequencing reaction (see Methods; Fig. 1). Sequences were transferred to a UNIX environment, where they were subjected to an automated clipping process that removed cloning vector, the original cosmid vector, and low quality sequences at both the 3′ and 5′ ends. Sequences were then searched against the EMBL database (Rodriguez-Tomé et al. 1996), and high-scoring matches against Escherichia coli sequences were removed (Fig. 1). All sequences and search results have been stored and are available via the World Wide Web (http://fugu.hgmp.mrc.ac.uk); sequences have been submitted to the EMBL GSS database.
Figure 1.

Flow diagram of sequence generation and processing. (Left) How the sequence templates are generated; (right) the processing of the sequences and their subsequent presentation on the web with associated BLAST results.
There was no manual editing of sequences, which were run for 3.5 hr at 3.0 kV on a PE Biosystems 377 sequencer. This gave an average read length of 650 bp, which, after 5′ end clipping, resulted in sequence reads up to 620 bp in length. Although sequences were clipped if the 3′ end of the subclone was reached, only minimal 3′ quality clipping was performed, to maximize the number of database matches. The justification for taking this approach is demonstrated in Figure 2, where, even when sequence quality is very poor, significant BLAST similarities may still be identified.
Figure 2.

001H15aC8 is a 619-bp sequence of very poor quality (10% Ns). However, it still shows a good match to the human PATCHED gene across two exons and one intron. Analysis of other clones from 001H15 confirms the presence of this gene on the cosmid.
Genome Characteristics
The data set was batch analyzed as outlined in Figure 3. Figure 4A summarizes the nucleotide composition of the genome, which has been calculated from the sequence data. The 52,668 sequences have an average length of 463 bp. The G+C content of 47.67% is significantly higher than mammalian figures of 40.3% (Thiery et al. 1976) and may reflect the higher proportion of coding sequence in the Fugu genome (Brenner et al. 1993.). The base count shows that A and T values are almost identical but that G and C values differ by nearly 1.5%. It is therefore likely that either G is undercalled or C is overcalled and represents a large proportion of the ambiguities. The percentage of uncalled bases, at 4.8%, is high for the data set, thus reflecting the long sequence reads and absence of editing. However, it is clear that most of the Ns (ambiguous bases) are either at the very beginning or toward the ends of the sequences as the average percentage of Ns between bases 50 and 450 in the sequences is <3%.
Figure 3.

Batch analysis of Fugu genomic sequences.
Figure 4.

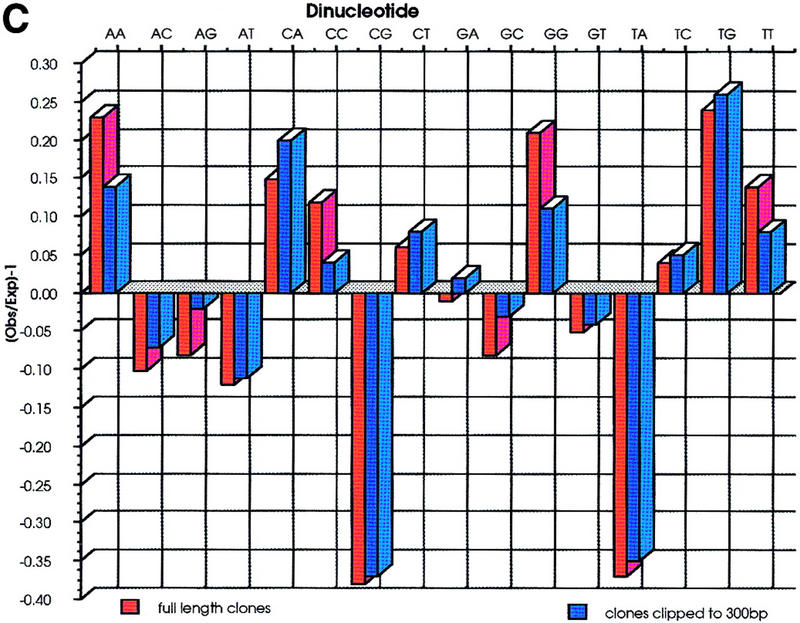
(A) A total of 52668 sequences were used to calculate the base frequencies. Ambiguous bases (Ns) were removed from the analysis on the assumption that they represent a roughly equal proportion of each of the 4 bases. (B) G+C content of each cosmid was calculated from the sequences derived from that cosmid. The G+C content of all sequences is also represented and shows a much wider distribution. (C) Dinucleotide frequencies are expressed as Observed (O)/Expected (E)-1. Negative values therefore correspond to dinucleotides that are suppressed, and positive values to those that are present at a frequency above that expected. Because the sequences have not been edited and have been allowed to run to 650 bp, there was concern that the quality of the data toward the end of sequences were poor. Therefore, the analysis was repeated after clipping all the sequences to 300 bp. The results are very similar to those from the whole data set, the only deviation being that the frequency of dinucleotides ApA, CpC, GpG, and TpT are slightly lower in the clipped data. This is due to broad peaks at the end of sequencing runs being mis-called as doublets of the same base.
The G+C content of cosmid clones (Fig. 4B) varies from 35% to 57% with >92% of cosmids having values between 42% and 52%. Another feature, reflected in the relative dinucleotide frequencies in Fig. 4C, is that the degree of CpG suppression in the Fugu genome is much less than in mammals. The CpG dinucleotide has an observed/expected value of 0.62, compared with 0.22 in man . It is not clear what relevance this has to CpG methylation in Fugu. The dinucleotide TpA is also suppressed in both Fugu and mammalian genomes (Smith et al. 1983), although the reason for this is unknown. It is well documented that the human genome contains G+C rich and G+C poor regions, known as isochores and that there is some correlation with gene density within these regions—the G+C rich regions having the highest gene densities. Cold blooded vertebrates, in particular teleost fish, have less well-defined isochores (Bernardi and Bernardi 1990), and high G+C content in the Fugu cosmids is most probably a direct result of a high proportion of coding DNA present rather than a general elevation in genome G+C content.
The Program Censor (Jurka et al. 1996) was used to detect microsatellites (repeat unit 1–6 bp) of ≥12 bp making results directly comparable to recent data for primates (Jurka and Pethiyagoda 1995) and an earlier study from Fugu [using a subset of the data used in this analysis (Edwards et al. 1998)]. All 501 possible microsatellite combinations were searched for and 227 different types were detected. The 20 most common are represented graphically in Figure 5 by the frequency (number of times) and abundance (total number of bases) with which they occur (as a percentage of total microsatellite DNA). Each named microsatellite in the graph includes all combinations thereof; so (C)n also includes its complement (G)n and (AGC)n also includes (GCA)n, (CAG)n, (GCT)n, (CTG)n, and (TGC)n. There was a total of 13,231 hits, incorporating 336,852 bp, from the 24.4 Mb sequenced. Microsatellite DNA therefore comprises 1.3% of total genomic DNA in Fugu. This equals one microsatellite (≥12 bp) every 1.9 kb, approximately three times more frequent than one every 6 kb estimated for man (Beckmann and Weber 1992). (AC)n repeats comprise over one-quarter of all repeats (3888/13231), occurring once every 6.6 kb. This is 4.5 times more frequent than in the human genome (Beckmann and Weber 1992), although the difference in size between the two genomes means that there are ∼60,000 (CA)n repeats in Fugu and ∼100,000 in man. The average length of a microsatellite in the Fugu genome is 25.5 bp, although different classes of microsatellites tend to vary from the mean; this is reflected by the difference in frequency and abundance scores, with generally shorter microsatellites having a higher frequency/abundance ratio.
Figure 5.
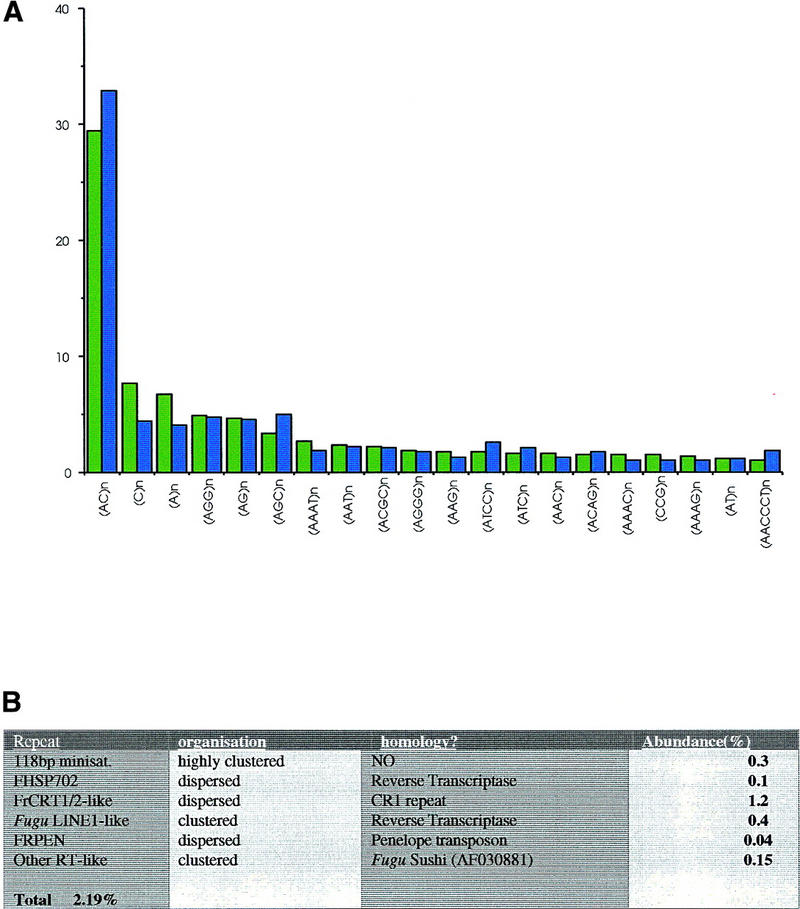
(A) Microsatellite abundance in the Fugu genome by relative frequency (green) and relative abundance (blue). (B) Table of other repeat families.
After masking of simple repeats, sequences were analyzed using the ICATOOL suite of programs (Parsons 1995; Parsons et al. 1992). Sequences were clustered by similarity, and any families with 20 or more members were searched against DNA and amino acid databases (Figure 5B). An extensive search against 15 repeat databases (Y. Edwards, unpubl.) revealed no significant homology to major vertebrate repeat sequences such as SINES, LINES, and Alus. There is only one frequently occurring minisatellite in the Fugu genome consisting of a highly clustered array of 118-bp units (Brenner et al. 1993). Two of the 1059 cosmids, 042G15 and 065M03, are composed entirely of this repeat. Two additional cosmids, 073H10 and 086L23, also contain a number of copies of this repeat, in addition to other repeat families. These cosmids comprise 0.3% of the total DNA analyzed, and it is hypothesised that these may represent centromeric regions. By random shotgun cloning, it would be expected that this 118-bp repeat array would be present in 2% of the genome (Brenner et al. 1993); however, it is possible that these regions are under-represented in the cosmid library. This minisatellite sequence has no homology with any sequence in the EMBL database. There are a number of other Fugu sequence families that show similarity to transposon or polyprotein (reverse transcriptase) sequences. The majority of these appear to be dispersed, occurring on numerous cosmids. However, although these elements tend to show a dispersed distribution, there are more frequent co-occurrences than would be expected by chance. It is therefore proposed that that the retroelements in Fugu tend to cluster (Poulter and Butler 1998; Poulter et al. 1999). One family, which has homology to the Drosophila Penelope transposon, appears to be highly clustered on just a few cosmids, although these cosmids also contain other sequences.
Gene Identification and Characterization through Sample Sequencing
The aim of the sequence scanning project was to cover ∼50% (20 kb) of each cosmid insert. This equates to ∼50 single reads of 500 bp, as at this level of coverage there is ∼20% redundancy. Figure 6 illustrates how genes are identified through this approach. Homologies are most readily identified at the amino acid level and allow sequence conservation to be identified across all organisms from bacteria to mammals. This is useful, as many of the scan clones only find similarities to nonvertebrate genes. Figure 7 shows one such match against Caenorhabditis elegans, Saccharomyces cerevisiae, and E. coli entries. To further confirm the validity of this match, there are at least three other sequence scan clones from 168A15 that hit regions of this gene. The SWISS-PROT and TREMBL databases now contain the entire sequences of both the C. elegans and S. cerevisiae genomes. Among these data are predicted genes which have been identified using organism-specific gene prediction programs. Many of these sequences are identified by cosmid identification, not by organism. The description files behind the maximal segment pair (MSP)–crunch (Sonnhammer and Durbin 1994) output files for SWISS-PROT and TREMBL were searched for organism names (C. elegans, S. cerevisiae, and Schizosaccharomyces pombe) and sorted according to probability scores. Of the 18% scanned clones that have significant (MSP–crunch) hits against databases, 30% had significant protein matches registered against C. elegans and 9% against yeast. Many of these sequences had no other BLAST match, thereby identifying novel vertebrate genes and validating the gene prediction output from these other organisms.
Figure 6.

Schematic representation of the scanning procedure. Cosmid clone DNA (including vector sequence (yellow)) is sonicated, end repaired, and subcloned into EcoRV-cut pBluescript. Recombinant inserts are PCR amplified and sequenced from one end, generating ∼500 bp of sequence. These sequences are randomly distributed across the cosmid clone (small black bars). Low quality, vector, and E. coli sequences are removed. One, 64-lane ABI377 sequence gel generates ∼50 good insert sequences providing 30%–50% coverage. An average Fugu cosmid clone will contain five to seven genes (represented as a–e); some are identifiable by BLAST homology at the protein level (fewer at the nucleotide level). The vertical colored bars represent the exons in the five genes and those with black dots above them are covered by the sequence scanning of this cosmid. Only the smallest genes are liable to be missed (gene b in this case). However, gene d has not been identified in other species as yet and so will not be recognized by BLAST searches (although gene prediction programs may do this) and some identified genes will show only low similarity with homologs across regions of the gene (e.g., the middle of gene a) and so may only give low BLAST scores.
Figure 7.
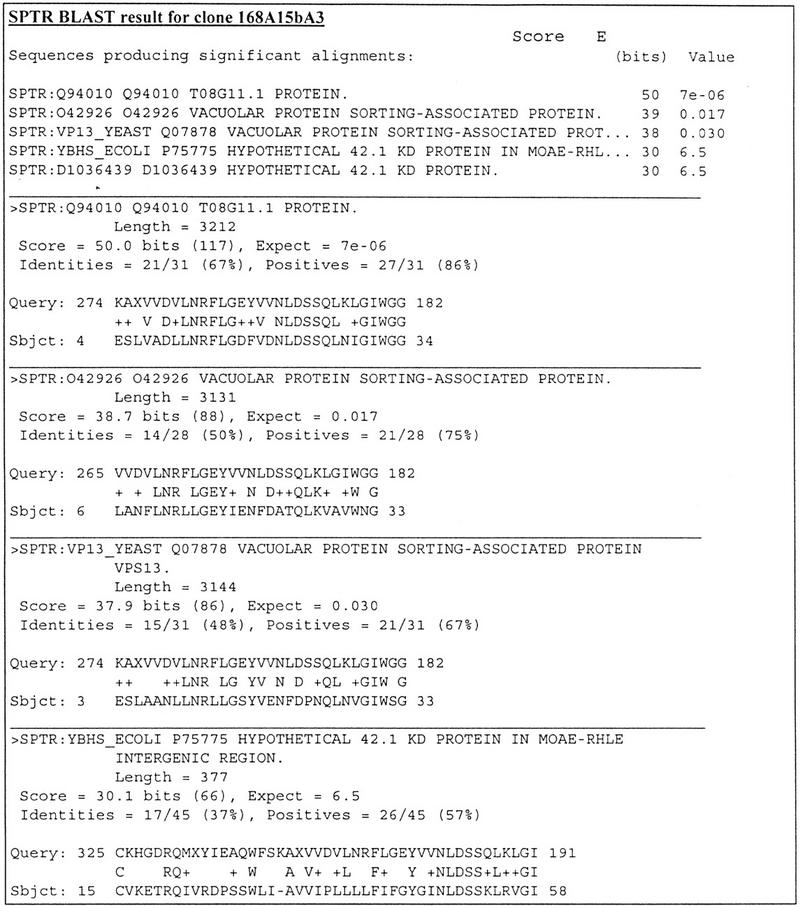
BLAST output for 168A15bA3. This clone shows similarity to a predicted C. elegans (T08G11.1) gene, two yeast genes, and an E. coli hypothetical gene. There are at least three other clones from cosmid 168A15 that also hit regions of this gene.
In many cases, the grouping of scanned clones from the same cosmid allowed the identification and confirmation of weak matches, such as those between different members of gene families. The minimal 3′ quality clipping of sequences means that many sequences in the Fugu database are 550–600 bp in length. This allows a limited study of exon structure. Figure 8 demonstrates a sequence scan clone where four exons are present. This is particularly relevant to the Fugu genome where the majority of introns are less than 100 bp.
Figure 8.
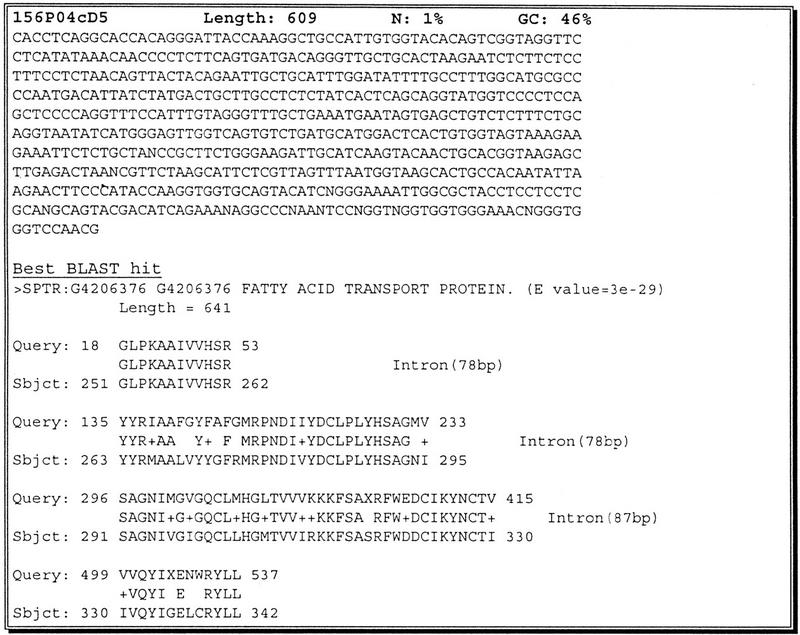
156P04cD5 is a 609 bp sequence that spans four exons and three introns of a fatty acid transport protein. All three of the introns are <100 bp in length.
Synteny with Mammalian Genomes
Sequences were pooled by parent cosmid so that gene content could be examined and compared with equivalent regions of the human genome. This has allowed regions of conserved synteny to be identified. In many cases, the Fugu region is much more compact than the equivalent region in man. There are a number of difficulties associated with assessing the degree of synteny that the Fugu genome shares with mammalian genomes at this high level of resolution. The majority of genes within vertebrate genomes belong to families where there may be two or more very similar members. In this case, given the limited coverage of this level of sequencing, it is often not possible to say that two genes are orthologous. Even in cases where there is very strong similarity to one gene, it is conceivable that there are other mammalian homologs, including perhaps the true ortholog, that have not as yet been identified and sequenced. With multigene families, it is often virtually impossible to assign orthologous comparative relationships until all members of the family have been sequenced in both organisms (Macrae and Brenner 1995). One of the ways in which orthology can be confirmed is by its position relative to other genes in the genome. However, it should be noted that it is still not possible to account for regional duplication in one or other of the two species, which confuses the ortholog/paralog debate even further.
It has been suggested recently that regional, or even whole genome, duplication has occurred in the ray-finned fish lineage, although most of the data relating to this argument are from zebrafish (Amores et al. 1998; Postlethwait et al. 1998; Gates et al. 1999), which has a large genome for a teleost (1700 Mb). The Cyprinid family contains both diploid and tetraploid representatives with a wide range of genome sizes (Schmidtke et al. 1979a,b), and it is thus likely that the constraints on regional duplications in some fish orders may be more relaxed than in others, or indeed, in mammals. From our estimations of gene density and gene size, as well as the total amount of coding sequence, it is difficult to see how the Fugu genome could accommodate large regions of genome duplication, although isolated, local duplications are probably a common feature of all vertebrate genomes and one source of genetic variation. Evidence from Hox cluster analyses suggests that the extent of duplication in Fugu, if any, is far less extensive than in Zebrafish (Kurosawa et al. 1999). We have not found large numbers of duplicated genes in the Fugu genome where there is only one copy in mammals.
Although there are now many transcripts mapped to chromosomal regions, many of these are ESTs, which are very difficult to assign as orthologous to sequences from other species. Despite the number of genes mapped, resolution is still low except in areas where there is full-length human genomic sequence. This means that although genes a, b, and c may have been mapped to the same chromosomal location in man, their order or whether genes d, e, f, g, and h lie between them may not be known. As the amount of genomic sequence increases, the ability to compare gene order at high resolution will improve and it will be more feasible to make estimates of the degree of synteny that Fugu shares with mammalian genomes.
Where there are more complete human data, there is variation in the degree of conservation of gene order and synteny. This is also reflected in the findings of others who have found complete conservation of gene order (Trower et al. 1996; Miles et al. 1998; Brunner et al. 1999), conservation of synteny but not necessarily gene order (Kehrer-Sawatzki et al. 1999; Gellner et al. 1999), and extensive differences in gene order within regions of conserved synteny (Gilley et al. 1999).
One of the Fugu cosmids scanned, 061J03, contains the Fugu ortholg of Bruton's tyrosine kinase gene (BTK), which in man maps to Xq21. Not only is there 100 kb of DNA sequence from the human genome covering this locus (accession no. U78027), but also a 90-kb mouse genomic sequence (accession no. U58105). The two regions have been the subject of in-depth comparative analysis (Oeltjen et al. 1997), and so we examined the gene content of Fugu cosmid 061J03 to look at the extent of conserved synteny and gene order compared with the mammalian genomes. Cosmid 061J03 has 47 scanned sequences derived from it (see http://fugu.hgmp.mrc.ac.uk/) and associated MSP–crunch outputs indicate at least 15 of these clones give significant matches with known protein sequences. Four of the clones give very good matches to the BTK gene (although there are also good matches against other tyrosine kinases), and one clone matches a region of the human α-galactosidase A gene (GLA), which is also contained on U78027. Another 061J03 clone matches the X-linked deafness dystonia protein sequence (U66035), which on closer inspection is the same as human BTK region clone fci–12 mRNA (U01922), which is contained once again in U78027. These data show strong conservation of synteny across this region. However, there are two other genes on the human sequence: FTP-3 which is the most 5′ gene on the human contig and so may not be represented on the Fugu cosmid, and a L44-like ribosomal protein gene (RPL36a), which is only 106 amino acids in length and so may have been missed at this level of coverage. Identification and inspection of an overlapping Fugu cosmid, 044D23, shows that a subclone 044D23aA4 does match the RPL36a gene. Although the scanning approach does not allow exact ordering of genes within the cosmid clone, there is strong evidence of conservation of synteny and gene order across this region.
In addition, cosmid 061J03 also contains matches to at least three other genes: a glycine receptor α gene (2 clones), OPA-containing protein 1 (KIAA0192; 4 clones), and a putative methionyl tRNA synthetase (3 clones). Although none of these are contained in the human BTK genomic sequence, there is an STS for a glycine receptor α (stSG21906), which maps to the same interval in GeneMap '99 (http://www.ncbi.nlm.nih.gov/genemap99/), and KIAA00192, which maps slightly more centromeric on the Xq21 boundary. There is no map position for the putative methionyl tRNA synthetase.
In summary, four genes from this region in the Fugu genome show conserved synteny and probably conserved gene order with a human region of Xq21 covered by U78027. Two other genes on cosmid 061J03 also map to Xq21, but it is not clear exactly where in terms of gene order. Finally, a seventh gene has no available mapping data associated with it. The presence of seven genes on one Fugu cosmid, including four that alone span 70–80 kb in the human genome, demonstrates the high gene density of the Fugu genome. Analysis of each of the 1059 cosmids in this way would be extremely labor intensive. At present there are no automatic ways of cross-referencing mapping data from different organisms, although there are a number of databases with search engines (such as GeneMap '99 and The Genome Database), which help. The aim of this project was to create and maintain a database from Fugu, not only of sequence data but also containing relevant BLAST data, which may be searched. In this way the database may be interrogated and analyses performed by external users as for cosmid 061J03 above.
In general, there is more than one identifiable gene on each cosmid analyzed. For the majority of cosmids, three databases were searched: TREMBL (Bairoch and Apweiler 1997), EMBL (Rodriguez-Tomé et al. 1996), and SWISS-PROT (Bairoch and Apweiler 1997). Filters were applied to mask simple sequence repeats. Matches against the DNA database are not as informative as those against the protein databases for a number of reasons. First, the degeneracy of the amino acid code means that DNA matches can be low scoring even when the amino acid sequences are quite similar. Second, the chances of random matches between amino acids are much lower than at the DNA level where 25% of bases will match by chance. Consequently, it is desirable to carry out tBLASTx searches against the DNA database (especially against all EST sequences). However, the size and redundancy of the databases makes this an expensive task in terms of computer power.
To simplify and accelerate the process, each cosmid was analyzed only for potential orthologs of mapped human genes. Cosmids were deemed to demonstrate conserved synteny if they contained two or more gene orthologs from the same chromosomal region in the human genome and no gene orthologs from a different chromosomal location. This was not possible in 67% of the cosmids because of lack of mapping data from the human genome or because there were not two identifiable genes on the cosmid with mapping data available. Of the remaining 33%, three-quarters showed conserved synteny and one-quarter did not (i.e., they contained identifiable genes that potentially map to different chromosomes in human. It is therefore possible to calculate that a breakpoint may exist, on average, once every four cosmids or once every 160 kb in the Fugu genome. As the human genome is approximately eight times larger, this equates to once every 1.2 Mb in the human genome or a total of 2500 breakpoints between the genomes. However, it is thought that this constitutes a gross overestimation for a number of reasons. First, it is possible that some of the cosmid clones identified as breakpoint clones are actually chimeric, resulting from the fusion of two fragments from different parts of the genome. Second, there are many cases where there are two or more genes, which are from the same chromosome, together with one from a different chromosome. This may not be a breakpoint but simply the insertion of a single gene from another part of the genome (i.e., synteny continues with the other genes on the cosmid in both directions). Third, the proposed human ortholog of the Fugu gene may have been assigned incorrectly, as the true ortholog has not yet been sequenced and therefore is not present in the databases. At the present time there is no way of calculating error margins for any of these, although chimerism is low in this library. A further reason for suspecting an overestimation of the frequency of breakpoints is that data from th linkage map of zebrafish, another teleost, indicates that the genome appears to share some very large regions of conserved synteny with mammalian genomes (Postlethwait et al. 1998). Although it is difficult to draw any statistical conclusions from the data set with regard to conservation of synteny, a general picture is emerging both from these data and other studies referred to above. There are regions of the genome where exact conservation of gene order has been maintained between Fugu and mammals. In general, however, there has been a degree of gene shuffling, and it would appear that this has been intrachromosomal rather than interchromosomal.
ORF Analysis
The sequence scanned fragments were analyzed using several ORF prediction programs. Only GeneMark (Borodovsky and McIninch 1993) gave credible results, and this probably reflects the size, and possibly the quality, of the sequence fragments generated in this type of project. However, it is notable that GeneMark is the only program for which there was a Fugu dicodon matrix available. ORFs determined by the program GeneMark using this matrix were useful in identifying novel exons likely to be present in the genomic sequences of Fugu that are not represented in the sequence data banks. A test set of Fugu sequence scan clones with known protein coding regions (as defined by good BLAST hits identified by the MSP–Crunch outputs) were used to assess the accuracy and efficiency of GeneMark; 59% of these coding regions were predicted by Genemark (Fig. 9). It was also estimated that 10% of the ORF predictions are wrong (due to homology with repeat sequences) and appropriate adjustments to the final ORF calculations were made. To calculate the per-centage coding sequence in the Fugu genome the average ORF/exon size was taken as 150 bp; however, many Fugu sequence scan clones contain more than one exon and so 100 randomly selected .orf files from Genemark were examined to determine the average number of ORFs predicted per sequence. After making a final adjustment, it was possible to recalculate the percentage coding sequence in the Fugu genome. This final figure of 17.4% equates to ∼70 Mb, or 70,000 genes with 1 kb of coding sequence per gene (Fig. 9). It should be noted that 58% of GeneMark output had no associated BLAST data. This is to be expected, as the databases do not contain a complete set of vertebrate coding sequence. Sequences that only had GeneMark output, but no associated BLAST data, were labeled as predicted exons; 16% of these gave weak BLAST hits against potential gene fragments, motifs, or hypothetical genes and zinc fingers. Although 40% of known exons wre not predicted in GeneMark definitive output files (.orf files), 88% of these sequences have predictions in the correct reading frame when the underlying composite files (.lst and .ps files) were screened, but these were not registered as significant under the program parameters.
Figure 9.

Percentage coding sequence in the Fugu genome as calculated from GeneMark ORF output. The Genemark program was run on all 52,668 sequences and the output of 964 of these, from 16 cosmids was used for the calculations of efficiency and accuracy. We have defined a correct Genemark prediction when a listed region of interest, and at least one exon prediction, is in the correct region and the reading frame of the sequence matches the confirmed BLAST hit.
This paper presents the analysis of a large data set of single pass sequence reads from the Fugu genome. These have been generated by low redundancy scanning of Fugu cosmids so that short-range linkage data could be collected on a large number of genomic regions spread throughout the genome. It demonstrates that the compact genome of Fugu is amenable to sequence scanning as a method of gene discovery, whole genome analysis, and linkage analysis. In addition, sequence scanning provides an economic alternative for the mapping and identification of regions of interest, which can then be subjected to full depth sequencing and more detailed analysis where appropriate.
METHODS
Shotgun Cloning and Sequence Generation
Cosmid DNA was isolated by alkaline lysis from 5- to 10-ml cultures (Birmboim and Doly 1979). One microgram of each DNA was digested with SacI and run on a 0.8% agarose gel for 5 hr at 100 V to determine overlapping, identical, or deleted clones. Where overlapping clones existed, a selection of cosmids approximating a minimal tiling path were used in further experiments. A Southern blot was prepared from the SacI digests and archived. One microgram of each cosmid DNA chosen after the SacI digests was sonicated to a size of 0.5–2.0 kb, end-filled with T4 DNA polymerase, PEG precipitated, and ligated into phosphatased blunt-ended EcoRV-cut pBluescript vector (Stratagene). The ligation was transformed using XL-2Blue MRF′-competent cells (Stratagene) and white colonies picked into 100 μl of TB (terrific broth) plus ampicillin. One 96-well culture plate was picked for each cosmid. pBluescript clone inserts were PCR amplified using limiting dilutions of dNTPs and primers with modified short T7/T3 primers under standard PCR cycling conditions. (T7 short, 5′-AATACGACTCACTATAG-3′; T3 short, 5′-ATTAACCCTCACTAAAG-3′; PCR cycle, 95°C for 20 sec, 49°C for 20 sec, and 72°C for 40 sec, repeated 35 times). (1.5 mm MgCl2, 28 μm dNTPs, 0.13 μm T7, and T3 primers, 1× NH4 commercial PCR buffer, 0.5 units of Taq). These PCR products were diluted by 150% and 5 μl run out on a 1.5% agarose gel. Products with larger inserts and single bands were chosen for sequencing. Generally, 64 products per cosmid were chosen for sequencing. Six microliters of each PCR product was used directly in the sequencing reaction, which consisted of half-reaction volumes of Perkin Elmer d-Rhodamine terminator mix. They were amplified using a modified Long KS primer and two-step PCR cycling conditions (Long KS, 5′-CTCGAGGTCGACGGTATCG-3′; PCR cycle, 95°C for 20 sec and 60°C for 2 min and 20sec, repeated 5 times). The sequenced products were ethanol precipitated and run out on 5% PAGE, 36-cm well to read, and 3.5-hr 4× run using an ABI PE 377 sequencer.
Raw Sequence Clipping
Sequencing gels were tracked and sequences transferred to a UNIX environment . A modified PREGAP script (Bonfield and Staden 1996) was then used to improve sequence quality prior to further analyses. Poor quality data generated at the beginning and end of a sequencing run was removed by introducing a standard left-hand clip 30 bp from the start of each sequence and a right-hand clip at 650 bp. Fragments were then screened against pBluescript and Lawrist 4 and contaminating vector sequences discarded. Short fragments that generated long strings of Ns at the end of a sequencing run were also clipped further using a PERL script. This searched for strings of >20 Ns in a moving window of 30 bp starting from the 3′ end of each sequence. If found, sequence up to the end of the window was removed. Only sequences >60 bp long and with <20% Ns were used in further analyses.
Homology Searches and Transfer to the Fugu Database
A PERL script was used to launch BLAST version 2.0 (Altschul et al.1997) homology searches against the against the SWISS-PROT (Bairoch and Apweiler 1997), TREMBL (Bairoch and Apweiler 1997), or more latterly SPTR (web page, http://bioinformer.ebi.ac.uk:80/newsletter/archives/4/sptr.html), and EMBL (Rodrigez-Tomé et al. 1996) and in-house Fugu databases. The results of these searches were analyzed using MSP–crunch (Sonnhammer and Durbin 1994), which allowed strong matches to existing sequences to be identified. Sequences showing homology to E. coli and pBluescript and Lawrist 4 vectors were not used in further analyses. All sequences and search results were added to the Fugu database and are available via the Fugu web pages at the HGMP (http://fugu.hgmp.mrc.ac.uk/).
Identification and Characterization of Microsatellites in the Fugu Genome
The purpose of this analysis was to identify microsatellites in the first instance and use the identified sequences in cluster analysis. A data bank of 501 theoretically possible microsatellites with a repeat unit of 1–6 bp was compiled. This data bank comprises 2-mononucleotide, 4-dinucleotide, 10-trinucleotide, 33-tetranucleotide, 102-pentanucleotide, and 350-hexanucleotide microsatellite classes and is identical to that compiled and used by Nadir et al. (1996), Jurka and Pethiyagoda (1995), and Edwards et al. (1998) in the survey of microsatellite sequences in human, primates, and Fugu, respectively. This data bank includes the overlapping components and the reverse complement of each microsatellite. For example, the CAG entry contains the six microsatellites with sequence CAG, AGC, GCA, CTG, GCT, and TGC repeats. Each of the 501 possible microsatellites were used to query Fugu DNA using the program Censor (Jurka et al. 1996). Microsatellites of 500 bp were used to query Fugu DNA sequences to establish the maximum lengths of each category of microsatellite found in Fugu. The Smith and Waterman (1981) algorithm in Censor was used to identify similar DNA fragments between query sequences and reference. The values of Censor parameters were defined to permit alignments with sequence identities in excess of 85% . This was sufficient to minimize erroneous classifications. Matches that were less than three repeat units long were filtered out and microsatellites with a minimum length of 12 bp were eliminated to prevent these repeats from forming families in subsequent gene clustering analysis.
Identification and Characterization of Minisatellites in the Fugu Genome
The aim was to identify the other two broad classes of repetitive elements (that is, the minisatellites and transposable elements), having a repeat size of 7 bp or more. The Fugu data set was first masked of microsatellite sequences using the output obtained using Censor (see above), as these would otherwise hinder the interpretation of clustering studies on the longer repeat units. Two clustering algorithms N2tool and ICAass from the ICAtools suite of programs (Parsons et al. 1992; Parsons 1995) were used to group similar sequences into clusters. N2tool was used to compare all sequences and cluster those sequences sharing local regions of similarity. This was then followed by ICAass, which performs an incremental clustering analysis of approximate subsequences (using output from N2tool) to search for global similarities and determine whether one DNA sequence is approximately repeated in another. Default parameters were used to determine local and global similarities. The clusters obtained were further characterized by examining the BLAST matches (SPTR and EMBL) of sequence scan clones within each cluster to establish whether the sequences were present in the genomes of other species or were Fugu specific.
Identification of Predicted Protein Coding Regions in the Fugu Genome
The predicted ORFs were defined by the program GeneMark (Borodovsky and McIninch 1993). GeneMark takes into account the correlations between bases using a phased fifth-order Markov chain model for determination of coding regions involving species-specific dicodon statistics. A Unix shell script was generated to run the GeneMark program on each of the Fugu DNA sequences using a Fugu-specific dicodon matrix file (Fugu_2.mat). (For more details, see Borodovsky and McIninch 1993.)
Acknowledgments
This work was supported by a Medical Research Council Project Grant.
The publication costs of this article were defrayed in part by payment of page charges. This article must therefore be hereby marked “advertisement” in accordance with 18 USC section 1734 solely to indicate this fact.
Footnotes
E-MAIL gelgar@hgmp.mrc.ac.uk; Fax 44 12 234 94512.
REFERENCES
- Altschul SF, Madden TL, Schaffer AA, Zhang J, Zhang Z, Miller W, Lipman DJ. Gapped BLAST and PSI-BLAST: A new generation of protein database search programs. Nucleic Acids Res. 1997;25:3389–3402. doi: 10.1093/nar/25.17.3389. [DOI] [PMC free article] [PubMed] [Google Scholar]
- Amores A, Force A, Yan YL, Joly L, Amemiya C, Fritz A, Ho RK, Langeland J, Prince V, Wang YL, Westerfield M, Ekker M, Postlethwait JH. Zebrafish hox clusters and vertebrate genome evolution. Science. 1998;282:1711–1714. doi: 10.1126/science.282.5394.1711. [DOI] [PubMed] [Google Scholar]
- Ansari-Lari MA, Oeltjen JC, Schwartz S, Zhang Z, Muzny DM, Lu J, Gorrell JH, Chinault AC, Belmont JW, Miller W, Gibbs RA. Comparative sequence analysis of a gene-rich cluster at human chromosome 12p13 and its syntenic region in mouse chromosome 6. Genome Res. 1998;8:29–40. [PubMed] [Google Scholar]
- Bairoch A, Apweiler R. The SWISS-PROT protein sequence data bank and its supplement TREMBL. Nucleic Acids Res. 1997;25:31–36. doi: 10.1093/nar/25.1.31. [DOI] [PMC free article] [PubMed] [Google Scholar]
- Beckmann JS, Weber JL. Survey of human and rat microsatellites. Genomics. 1992;12:627–631. doi: 10.1016/0888-7543(92)90285-z. [DOI] [PubMed] [Google Scholar]
- Bernardi G, Bernardi G. Compositional patterns in the nuclear genome of cold-blooded vertebrates. J Mol Evol. 1990;31:265–281. doi: 10.1007/BF02101122. [DOI] [PubMed] [Google Scholar]
- Birmboim HC, Doly J. A rapid alkaline extraction procedure for screening recombinant DNA. Nucleic Acids Res. 1979;7:1513–1523. doi: 10.1093/nar/7.6.1513. [DOI] [PMC free article] [PubMed] [Google Scholar]
- Bonfield JK, Staden R. Experiment files and their application during large-scale sequencing projects. DNA Sequence. 1996;6:109–117. doi: 10.3109/10425179609010197. [DOI] [PubMed] [Google Scholar]
- Borodovsky M, McIninch J. Genmark: Parallel gene recognition for both DNA strands. Comput Chem. 1993;17:123–133. [Google Scholar]
- Bouck J, Miller W, Gorrell JH, Muzny D, Gibbs RA. Analysis of the quality and utility of random shotgun sequencing at low redundancies. Genome Res. 1998;8:1074–1084. doi: 10.1101/gr.8.10.1074. [DOI] [PMC free article] [PubMed] [Google Scholar]
- Brenner S, Elgar G, Sandford R, Macrae A, Venkatesh B, Aparicio S. Characterization of the Pufferfish (Fugu) genome as a compact model vertebrate genome. Nature. 1993;366:265–268. doi: 10.1038/366265a0. [DOI] [PubMed] [Google Scholar]
- Brunner B, Todt T, Lenzner S, Stout K, Schulz U, Ropers HH, Kalscheuer VM. Genomic structure and comparative analysis of nine Fugu genes: Conservation of synteny with human chromosome Xp22.2–p22.1. Genome Res. 1999;9:437–448. [PMC free article] [PubMed] [Google Scholar]
- Edwards YJK, Elgar G, Clark MS, Bishop MJ. The identification and characterisation of microsatellites in the compact genome of the Japanese pufferfish, Fugu rubripes: Perspectives in functional and comparative genomic analyses. J Mol Biol. 1998;278:843–854. doi: 10.1006/jmbi.1998.1752. [DOI] [PubMed] [Google Scholar]
- Gates MA, Kim L, Egan ES, Cardozo T, Sirotkin HI, Dougan ST, Lashkari D, Abagyan R, Schier AF, Talbot WS. A genetic linkage map for zebrafish: Comparative analysis and localization of genes and expressed sequences. Genome Res. 1999;9:334–347. [PubMed] [Google Scholar]
- Gellner K, Brenner S. Analysis of 148 kb of genomic DNA around the wnt1 locus of Fugu rubripes. Genome Res. 1999;9:251–258. [PMC free article] [PubMed] [Google Scholar]
- Gilley J, Fried M. Extensive gene order differences within regions of conserved synteny between the Fugu and human genomes: Implications for chromosomal evolution and the cloning of disease genes. Hum Mol Genet. 1999;8:1313–1320. doi: 10.1093/hmg/8.7.1313. [DOI] [PubMed] [Google Scholar]
- Hardison RC, Oeltjen J, Miller W. Long human-mouse sequence alignments reveal novel regulatory elements: A reason to sequence the mouse genome. Genome Res. 1997;7:959–966. doi: 10.1101/gr.7.10.959. [DOI] [PubMed] [Google Scholar]
- Jurka J, Pethiyagoda C. Simple repetitive DNA sequences from primates: Compilation and analysis. J Mol Evol. 1995;40:120–126. doi: 10.1007/BF00167107. [DOI] [PubMed] [Google Scholar]
- Jurka J, Klonowski P, Dagman V, Pelton P. Censor: A program for identification and elimination of repetitive elements from DNA sequences. Comput Chem. 1996;20:119–121. doi: 10.1016/s0097-8485(96)80013-1. [DOI] [PubMed] [Google Scholar]
- Kehrer-Sawatzki H, Maier C, Moschgath E, Elgar G, Krone W. Characterization of three genes, AKAP84, BAW and WSB1, located 3′ to the Neurofibromatosis type 1 locus in Fugu rubripes. Gene. 1999;235:1–11. doi: 10.1016/s0378-1119(99)00222-x. [DOI] [PubMed] [Google Scholar]
- Kurosawa G, Yamada K, Ishiguro H, Hori H. Hox gene complexity in medaka fish may be similar to that in pufferfish rather than zebrafish. Biochem Biophys Res Commun. 1999;260:66–70. doi: 10.1006/bbrc.1999.0834. [DOI] [PubMed] [Google Scholar]
- Macrae AD, Brenner S. Analysis of the dopamine-receptor family in the compact genome of the Puffer Fish Fugu rubripes. Genomics. 1995;25:436–446. doi: 10.1016/0888-7543(95)80044-m. [DOI] [PubMed] [Google Scholar]
- Miles C, Elgar G, Coles E, Kleinjan DJ, van Heyningen V, Hastie N. Complete sequencing of the Fugu WAGR region from WT1 to PAX6: Dramatic compaction and conservation of synteny with human chromosome 11p13. Proc Natl Acad Sci. 1998;95:13068–13072. doi: 10.1073/pnas.95.22.13068. [DOI] [PMC free article] [PubMed] [Google Scholar]
- Nadir E, Margalit H, Gallily T, Ben-Sasson SA. Microsatellite spreading in the human genome: evolutionary mechanisms and structural implications. Proc Natl Acad Sci. 1996;93:6470–6475. doi: 10.1073/pnas.93.13.6470. [DOI] [PMC free article] [PubMed] [Google Scholar]
- Oeltjen JC, Malley TM, Muzny DM, Miller W, Gibbs RA, Belmont JW. Large-scale comparative sequence analysis of the human and murine Bruton's tyrosine kinase loci reveals conserved regulatory domains. Genome Res. 1997;7:315–329. doi: 10.1101/gr.7.4.315. [DOI] [PubMed] [Google Scholar]
- Parsons JD. Improved tools for DNA comparison and clustering. Comput Appl Biosci. 1995;11:603–613. doi: 10.1093/bioinformatics/11.6.603. [DOI] [PubMed] [Google Scholar]
- Parsons JD, Brenner S, Bishop MJ. Clustering cDNA sequences. Comput Appl Biosci. 1992;8:461–466. doi: 10.1093/bioinformatics/8.5.461. [DOI] [PubMed] [Google Scholar]
- Postlethwait JH, Yan YL, Gates MA, Horne S, Amores A, Brownlie A, Donovan A, Egan ES, Force A, Gong Z, et al. Vertebrate genome evolution and the zebrafish gene map. Nat Genet. 1998;18:345–349. doi: 10.1038/ng0498-345. [DOI] [PubMed] [Google Scholar]
- Poulter R, Butler M. A retrotransposon family from the pufferfish (Fugu) Fugu rubripes. Gene. 1998;215:241–249. doi: 10.1016/s0378-1119(98)00296-0. [DOI] [PubMed] [Google Scholar]
- Poulter R, Butler M, Ormandy J. A LINE element from the pufferfish (Fugu) Fugu rubripes which shows similarity to the CR1 family of non-LTR retrotransposons. Gene. 1999;227:169–179. doi: 10.1016/s0378-1119(98)00600-3. [DOI] [PubMed] [Google Scholar]
- Rodriguez-Tomé P, Stoehr PJ, Cameron GN, Flores TP. The European Bioinformatics Institute (EBI) databases. Nucleic Acids Res. 1996;24:6–13. doi: 10.1093/nar/24.1.6. [DOI] [PMC free article] [PubMed] [Google Scholar]
- Schmidtke J, Schmitt E, Matzke E, Engel W. Non-repetitive DNA sequence divergence in phylogenetically diploid and tetraploid teleostean species of the family cyprinidae and the order isospondyli. Chromosoma. 1979a;75:185–918. doi: 10.1007/BF00292207. [DOI] [PubMed] [Google Scholar]
- Schmidtke J, Schmitt E, Leipoldt M, Engel W. Amount of repeated and non-repeated DNA in the genomes of closely related fish species with varying genome sizes. Comp Biochem Physiol. 1979b;64:117–120. doi: 10.1016/0305-0491(79)90194-9. [DOI] [PubMed] [Google Scholar]
- Smith TF, Waterman MS, Stadler JR. Statistical characterisation of nucleic acid sequence functional domains. Nucleic Acids Res. 1983;11:2205–2220. doi: 10.1093/nar/11.7.2205. [DOI] [PMC free article] [PubMed] [Google Scholar]
- Smith TF, Waterman MS. Identification of common molecular sequences. J Mol Biol. 1981;147:195–197. doi: 10.1016/0022-2836(81)90087-5. [DOI] [PubMed] [Google Scholar]
- Sonnhammer ELL, Durbin R. A workbench for large scale sequence homology analysis. Comput Appl Biosci. 1994;10:301–307. doi: 10.1093/bioinformatics/10.3.301. [DOI] [PubMed] [Google Scholar]
- Thiery JP, Macaya G, Bernardi G. An analysis of eukaryotic genomes by density gradient centrifugation. J Mol Biol. 1976;108:219–235. doi: 10.1016/s0022-2836(76)80104-0. [DOI] [PubMed] [Google Scholar]
- Trower MK, Orton SM, Purvis IJ, Sanseau P, Riley J, Christodoulou C, Burt D, See CG, Elgar G, Sherrington R, et al. Conservation of synteny between the genome of the pufferfish (Fugu rubripes) and the region on human chromosome 14 (14q24.3) associated with familial Alzheimer disease. Proc Natl Acad Sci. 1996;93:1366–1369. doi: 10.1073/pnas.93.4.1366. [DOI] [PMC free article] [PubMed] [Google Scholar]