

Abstract
Human genome sequencing is accelerating rapidly. Multiple genome maps link this sequence to problems in biology and clinical medicine. Because each map represents a different aspect of the structure, content, and behavior of human chromosomes, these fundamental properties must be integrated with the genome to understand disease genes, cancer instability, and human evolution. Cytogenetic maps use 400–850 visible band landmarks and are the primary means for defining prenatal defects and novel cancer breakpoints, thereby providing simultaneous examination of the entire genome. Recent genetic, physical, and transcript maps use PCR-based landmarks called sequence-tagged sites (STSs). We have integrated these genome maps by anchoring the human cytogenetic to the STS-based genetic and physical maps with 1021 STS–BAC pairs at an average spacing of ∼1 per 3 Mb. These integration points are represented by 872 unique STSs, including 642 polymorphic markers and 957 bacterial artificial chromosomes (BACs), each of which was localized on high resolution fluorescent banded chromosomes. These BACs constitute a resource that bridges map levels and provides the tools to seamlessly translate questions raised by genomic change seen at the chromosomal level into answers based at the molecular level. We show how the BACs provide molecular links for understanding human genomic duplications, meiosis, and evolution, as well as reagents for conducting genome-wide prenatal diagnosis at the molecular level and for detecting gene candidates associated with novel cancer breakpoints.
Translating problems of human disease into the language of the human genome requires a unified resource that bridges DNA sequence through chromosome bands. Such a resource must link the three types of linear arrays that represent the human genome: database arrays (genetic and physical maps and ultimately DNA sequence), chromosome bands visible in single cells, and ordered clone arrays. Genome maps have been previously either STS-based, with marker order obtained using a combination of STS-content of large insert yeast artificial chromosome (YAC) clones, radiation hybrid (RH) mapping, and genetic mapping (Hudson et al. 1995; Deloukas et al. 1998), or BAC-based, with order obtained at 2–6 Mb through high resolution mapping by fluorescence in situ hybridization (FISH) with respect to human chromosome landmarks (Korenberg et al. 1992). During the course of these efforts, a strategy to integrate these maps was established. BACs are well suited for a permanent FISH-mapped and integrated clone resource in that they represent a stable and easily manipulated form of cloned DNA and produce bright, well defined signals on metaphase and interphase chromosome preparations (Korenberg and Chen 1995). We now report the construction of a genome-wide array of bacterial artificial chromosomes (BACs) that is integrated with the cytogenetic, genetic, and STS maps and characterized for homology to the remainder of the human genome by FISH.
RESULTS
Integrated BAC Framework of the Human Genome
One or more BACs were identified for 872 STSs (Table 1) or ∼1 STS marker BAC per 3 Mb throughout the genome. The majority of these STSs (642) are simple sequence length polymorphisms (SSLPs) from the human genetic map generated at Genethon (Table 1). The term STS–BAC pair describes the result of an independent experiment in which a BAC is tested and found to be positive with a single STS marker. Because some STSs identified multiple BACs, and in some cases, single BACs contained multiple STSs, the 1021 STS–BAC pairs represent 872 unique STSs and 957 BACs. BACs were not included in the resource when the STS failed to map to a unique position on the Whitehead (MIT) maps or when the STS result and the FISH data were discordant for chromosome assignment. Some discordant pairs were the result of multiple or independent clones occurring in different replicates of the BAC library. Apparent “true” discordance between the genetic and cytogenetic maps was observed for several reasons, including data entry errors, genome duplications, and putative chimeric clones. The 1021 STS–BAC pairs were used to generate integration points between the STSs and the cytogenetic maps (Fig. 1). Of the 957 BACs used to build the integrated map, 804 BACs yielded a FISH signal at only one chromosome band, sub-band, or band border and 153 (16%) BACs gave signals at more than one band. Data tables containing the identity of the BAC clones and the STSs, their respective FISH, genetic, or RH map positions, and subsets located near telomeres, are available at http://www.csmc.edu/genetics/korenberg/korenberg.html and http://www-genome.wi.mit.edu. Clones are available from Research Genetics (Huntsville, AL). Images stored on the optical drive are available by arrangement with the.
Table 1.
Source of STS Markers
| Genetic markers from Genethon | 642 |
| Weissenbach nonpolymorphic markers | 21 |
| ESTs | 83 |
| Known genes | 42 |
| Random WI STSs | 72 |
| CHLC markers | 10 |
| Others | 2 |
| Total | 872 |
Figure 1.
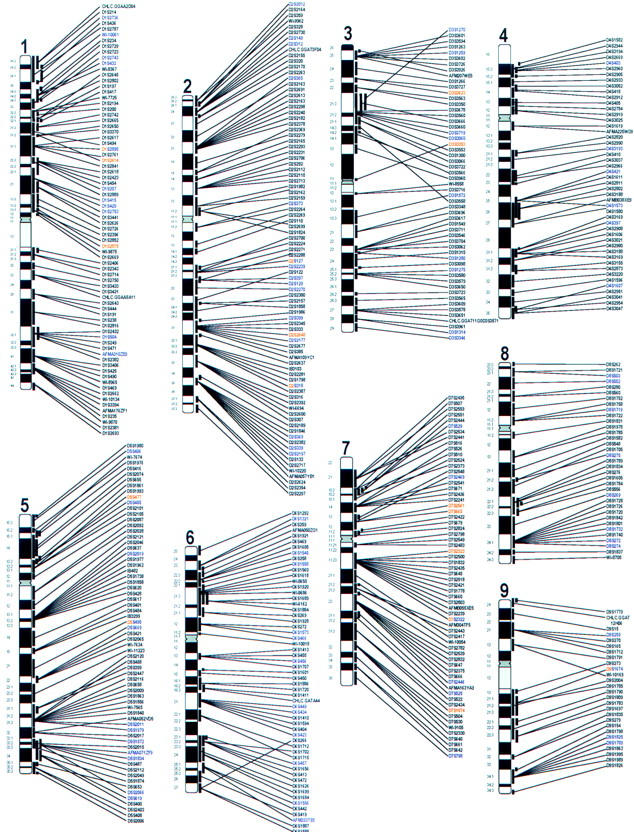
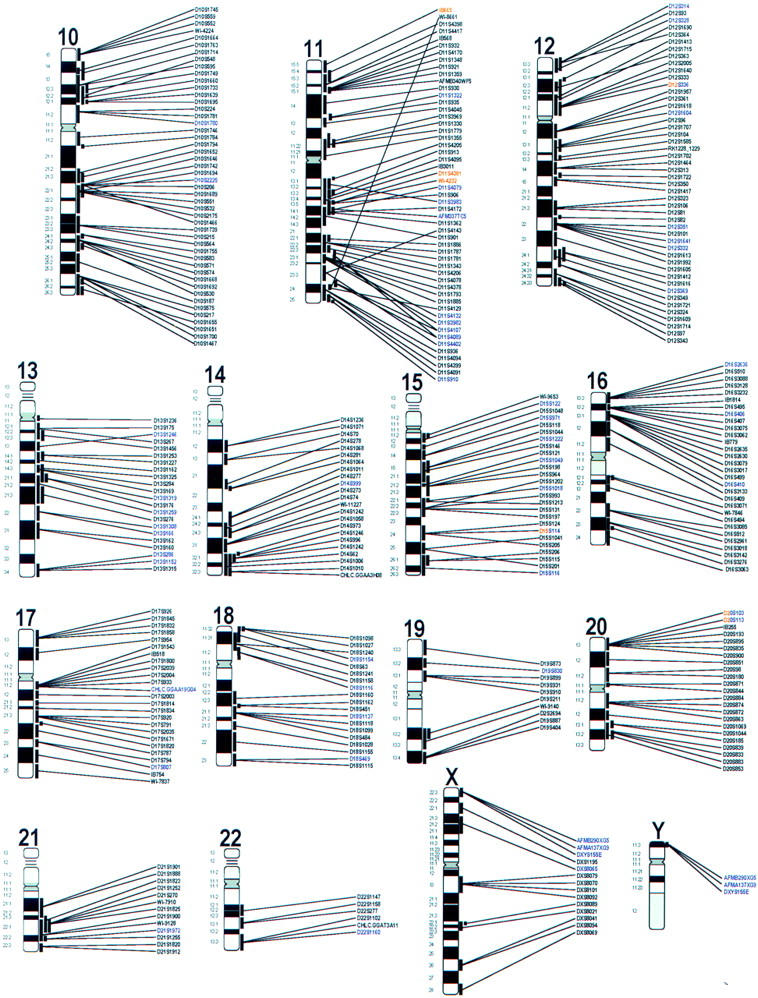
The length of the line indicates the resolution of the assignment, i.e., the outer boundaries of the band(s) within which the BAC signal is located as described in Methods. Although higher resolution may be obtained from the archived images, within a single band region, BACs are ordered by the genetic and RH maps (Hudson et al. 1995). Divergence from colinearity is discussed in the text. STSs in black denote BACs yielding signals at single sites; those in red denote BACs with signals at more than one site on a single chromosome; those in purple denote BACs with signals at more than one site located on two or more chromosomes; those red and purple denote BACs with signals at more than one site on a single chromosome as well as on two or more chromosomes. Human genome anatomy: integrated molecular cytogenetic BAC–STS map of the human genome. Features including BAC addresses, map positions and STS sources of the 1021 BAC–STS pairs represented by the and 872 STSs and 957 BACs that were used to construct the map are found in the table that can be viewed at web sites described in the text. The table includes the BAC addresses and map positions as well as STS sources and oligonucleotide sequences. In the map above, each STS listed represents one or more BACs that map by FISH to the positions indicated by the vertical lines to the right of each chromosome ideogram.
Table 2 displays the number of integration points per chromosome between the STS map and the cytogenetic map for all autosomes, the X chromosome, and the pseudoautosomal region of the X and Y chromosomes. Each point represents a FISH-mapped BAC containing at least one STS. The Y chromosome is under-represented largely because we did not screen with markers that had been assigned previously on the Y (Foote et al. 1992). Chromosome 19 and the X may be under represented due to a relative lack of SSLPs, to multisite STSs, or to lower BAC density on these chromosomes. The over-representation of chromosome 21 is due to the enrichment of BACs mapped previously on chromosome 21 in DNA pools screened (Hubert et al. 1997; J.R. Korenberg, X-N. Chen, Z. Sun, D. Noya, H. Shizuya, M. Simon, in prep.). Some large Giemsa-positive bands have only one or no BAC–STS pairs (i.e., 3p12, 4q13, 4q28, and 9q31), and some R bands have none (i.e., 7p22 and 4p16), perhaps both due to a bias in the distribution of SSLPs used or BACs and genomic organization in these regions. The repeat-containing regions at 1qh, 9qh, and 16qh are also devoid of STS–BAC pairs, possibly due to the lack of SSLPs.
Table 2.
Integration Sites per Chromosome and Location of pericentromeric and Most Telomeric Markers
| Chrom. | STSs (no.) | BACs (no.) | Genetic distance from most telomeric BACs to respective end of map (cM) | Pericent (cM) | |||
|---|---|---|---|---|---|---|---|
| from ptel | from qtel | ||||||
| 1 | 76 | 94 | 16.4 | D1S214 | 13.9 | D1S2693 | 4.6 (p12–q21.1) |
| 2 | 88 | 97 | 17.3 | D2S2164 | 37.5 | D2S2297 | 3.3 (p11.2–q11.2) |
| 3 | 55 | 64 | 25.4 | D3S3601 | 14.7 | D3S1314 | |
| 4 | 46 | 51 | 22 | D4S1582 | 13.1 | D4S3074 | 6.7 (p12–q12) |
| 5 | 67 | 77 | 6.2 | D5S1980 | 0 | D5S2006 | 0.2 (p12–q11.2) |
| 6 | 57 | 58 | 27.1 | D6S259 | 19.3 | D6SS1585 | 6 (p11.2–q13) |
| 7 | 66 | 66 | 28 | D7S2495 | 12.7 | D7S798 | 5.1 (p11.2–q11.21) |
| 8 | 35 | 40 | 4.9 | D8S262 | 10.9 | D8S1837 | 5.4 (p11.2–q11.2) |
| 9 | 27 | 26 | 0.1 | D9S1779 | 6.3 | D9S1826 | 6.6 (p13–q13) |
| 10 | 48 | 51 | 3 | D10S1745 | 0 | D10S1700 | 3.3 (p11.2–q11.2) |
| 11 | 54 | 54 | 16.7 | D11S932 | 10.5 | D11S910 | 9.3 (p11.21–q12) |
| 12 | 48 | 55 | 12.6 | D12S314 | 3.4 | D12S343 | 13 (p11.2–q12) |
| 13 | 22 | 25 | 4.2 | D13S1236 | 12.3 | D13S1315 | |
| 14 | 21 | 27 | 26.2 | D14S1071 | 3.9 | D14S1010 | |
| 15 | 26 | 29 | 6.3 | D15S122 | 26.5 | D15S116 | |
| 16 | 30 | 35 | 8.3 | D16S510 | 5.1 | D16S3063 | |
| 17 | 25 | 25 | 0.6 | D17S926 | 41.1 | D17S807 | |
| 18 | 19 | 20 | 5 | D18S1098 | 6.6 | D18S1115 | |
| 19 | 10 | 10 | 24.7 | D19S873 | 5 | D19S404 | |
| 20 | 22 | 23 | 2.9 | D20S103 | 13.1 | D20S853 | 1.5 (p11.1–q11.2) |
| 21 | 12 | 16 | 31.4 | D21S1901 | 1.3 | D21S1912 | |
| 22 | 6 | 5 | 26.5 | D22S1147 | 11 | D22S1160 | |
| X | 14 | 17 | 4.9 | AFMB290XG5 | 7.7 | DXS8069 | |
| Y | 3 (shared w/ X) | 3 (shared w/ X) | |||||
| Total | 873 | 965 | |||||
Genetic distances are given for marker-linked BACs mapping in bands closely flanking the centromeric regions. Meiotic interference in humans is suggested for chromosomes 1 and 9 but not 16, by comparison of the genetic distances between BAC–STS pairs that closely flank the centromere. For chromosome 1, only 4.6 cM is found between D1S2669 and D1S2343, mapping in 1p12 and 1q21, respectively, in comparison to 5 cM for two markers located within q21 (D1S2343 and D1S2714) and 40 cM between q21 and 125 (D2S2714 and D2S444), not likely matched by a 10-fold difference in DNA content. For chromosome 9, only 6.6 cM is found between D9S1791 and D9S273, mapping in 9p13 and 9q13, respectively, as compared with 22.1 cM from D9S273 and D9S1790, mapping in q13 and 122.1, respectively; and 35 cM between D9S154 and D9S1826, located at the centromeric and telomeric borders of q34, again, not likely 5-fold the DNA content, although differential chromatin condensation must clearly contribute to the difference. Support for interference was not found for chromosomes 2, 5, 7, and 10, for which STS-BACs closely flanked the apparent centromeric regions and were associated with small genetic distance. For chromosome 2, a distance of only ∼3 cM separates D2S2159 and D2S373/D2S2264, located in p11.2 and q11.2, respectively; see web site and Fig. 2). Definitive analyses over small distances will require physical and genetic maps such as that supporting interference across the chromosome 5 centromere (Puechberty 1999). Nonetheless, the current analyses support interference in the largest pericentromeric and heterochromatic blocks.
Reproducibility and Resolution
We have assessed the accuracy and resolution of the integrated STS–BAC maps. For the subset of 28 BACs that were mapped twice because they carry at least two different markers, all pairs mapped to the same band or sub-band. This is a stringent test of reproducibility. Also, the positions of BACs containing 43 previously mapped genes (Table 1) agree with the predicted locations (Fig. 1 and web site table), even with the expected bias in map position that is found at band borders due to the spread of stain or signal. Furthermore, the best estimate of the STS order (generated by the integrated genetic, STS-content, and RH map) correlates well with the cytogenetic positions of the FISH-mapped BACs.
True FISH resolution varies with chromosome length, band size, and structure and was therefore represented independently for each BAC (Fig. 1). Higher resolution BAC order is provided by the associated STSs and their links to the emerging genomic sequence. Therefore, regardless of standard cytogenetic resolution, these STS-linked BACs now provide resolution approaching that of the STSs. Visual inspection shows a small number of markers that map to different subchromosomal regions in the STS versus the FISH maps, some of which may be the result of errors in the genetic, RH, or YAC maps (Hudson et al. 1995). It is also possible that some STSs are low-copy repeats that identified nonoverlapping BACs or that some of these BACs may be chimeric. Alternatively, in the pericentromeric region of chromosomes 2 and 9, the inverted order of STSs versus BACs may reflect variation in the human population that may now be tested.
The reproducibility of map position within the resource was also examined by using the 102 STSs which identify two or more BACs. In 100 cases (98%), the FISH signals from the different BACs were localized to either the same (92), overlapping (7), or closely adjacent bands (1). Only the BACs from two STSs (D5S477 on 5p and IB665 on 11p) mapped to different locations separated by two bands on the same chromosome. For thirteen of the 102 STSs, different BACs members shared the band containing the confirmed STS site and a second signal was noted at a site on another chromosome (web site table). This points to limitations in precisely localizing some STS markers, possibly due to repeated regions. Repeats notwithstanding, the vast majority of the BACs are mapped to the correct subchromosomal position and therefore these multisite BAC–STS pairs provide links to cryptic human duplications.
The accuracy of the STS and genetic maps (Hudson et al. 1995) is also reflected in the subset of BACs containing two or more STSs. BAC 1004A13 located on 1p22.1–21, carries three STSs at the same RH map position but the genetic map position of one differs by ∼4 cM compared to the other two (129.3 vs. 133.0), suggesting a possible recombinational not spot. Nonetheless, most STS pairs on a single BAC were located within 1.0 cM, providing independent physical validation of the genetic map.
DISCUSSION
This work yields tools for the investigation of human cancers, as well as for chromosome structure and behavior. New probes have been produced for regions corresponding to the ends of the genetic maps (1000:1 likelihood of order), for example, for 5q, 9p, 10q; to regions beyond the genetic ends as determined by comparison of genetic and RH maps; for some markers located on neither the RH nor the genetic maps (Hudson et al. 1995); and for the telomeric bands in the regions of 39 telomeres (Fig. 1; Table 2 and web site table). Distances of the most distal STS-linked BACs from the ends of the genetic maps are given in Table 2. The integrated BAC map also places boundaries on the location of centromeres in the genetic framework maps (Fig. 1). We note preliminary evidence that suggests genetic interference (observation of less crossing over than expected from the physical distance) across the large blocks of pericentromeric and highly repetitive regions of chromosomes 1 and 9 (Table 2) and across the 2q14.1–21.3 region of human chromosome 2. This corresponds to the now inactive centromere of the ancestral chimpanzee fusion chromosome. In contrast, there is no evidence as yet to support interference across the active centromeres including chromosome 2 and others (i.e., 5, 7, and 11) for which closely flanking pericentromeric BACs were identified.
Single BACs that recognize probes lighting up multiple sites in the genome provide clues to duplicated DNA segments, human variation, and ultimately evolution. Some of these regions are suspected but not defined. For example, multisite BACs identify the pseudo-autosomal regions of Xp22.3 and Yp13.3; BACs mapping to both 16p13.3 and 21q22.2 may represent the region of the olfactory receptors that map only to these two bands (Trask et al. 1998). Multiple novel regions with duplications are defined (web site table; J.R. Korenberg, X-N. Chen, Z. Sun, D. Noya, H. Shizuya, and M. Simon, in prep.). BACs for D7S2323 in 7q11.2 and D7S2561 in 7p12–13 also generate signals in chromosome 7q22 and 7q11.2, respectively. These are regions that contain known homologous sequences, and are members of the PMS2 pseudogene family (Lengauer et al. 1998; Bellugi et al. 1999). Therefore, the independent STS-linked BACs that reveal either three or more sites, or second sites defined by independent clones, lead us to believe that these are regions of homology apart from previously characterized duplications (Trask et al. 1998; Eichler 1999). The STS linkage in these regions permits the definition of duplicated sequences and possibly genes as candidates for human genetic and acquired diseases (Lupski 1998). The power of our approach derives from the ability to simultaneously assess the entire genome for homology directly linked to related genes and sequences.
This STS-linked resource allows a suspected cancer or prenatal breakpoint to be pinpointed with flanking STS markers to within an average of ∼1.5 Mb (Chen et al. 1998). Once BAC–STS pairs are verified by independent techniques as reported here, sensitivity and visibility is provided by the molecular cytogenetic approach and the marker resolution is provided to these signals by the linkage to the higher resolution technique (STS, RH, and sequence order), obviating the necessity for fiber or interphase analyses except to resolve difficult regions and relationships to chromosome structure.
The STS order of each chromosome can now be made visible in a single experiment, as illustrated for chromosome 11 in Figure 2. Thirty STS-linked BACs were combined in 16 groups, each containing 1–3 BACs mapped to single bands, and were labeled and hybridized using standard direct methods. The resulting chromosomal image clearly represents the genetic map of chromosome 11. Using this four-color scheme, rearrangements can be defined among the 27 STS markers by changes in color patterns, both between and within groups. This analysis is independent of the quality of the metaphase preparation and extends below the limit of cytogenetic detection. Similarly, flanking markers of new genes can be mapped by using FISH and STS-linked subsets in this resource (Chen et al. 1998). In addition to providing order, the clones themselves are a source for additional markers as well as for the detailed analysis of the genomic regions containing these markers.
Figure 2.
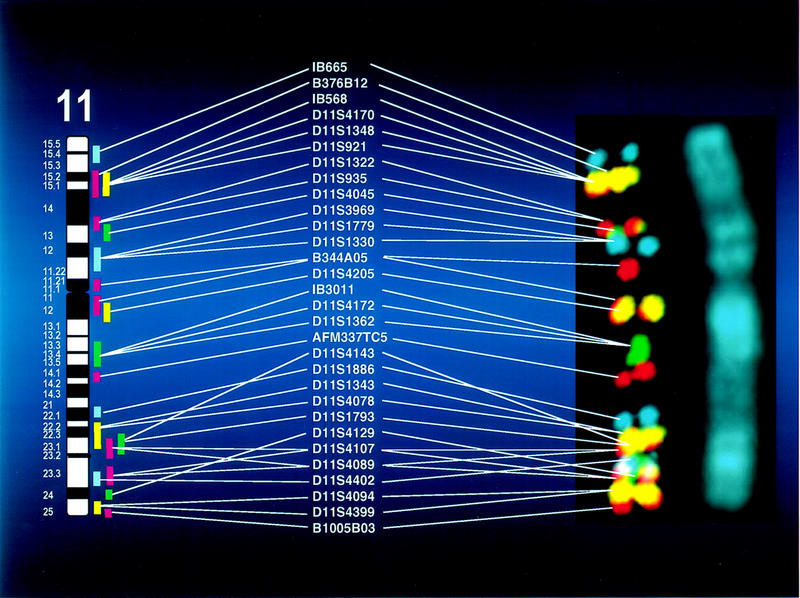
The visible genetic map of human chromosome 11. Thirty BACs for 27 STS markers on chromosome 11 were labeled with one of six color combinations in 1–3 groups. All DNAs were hybridized simultaneously and images were collected as described in Methods. The STS order is shown for comparison to the FISH order that was confirmed independently by both single and multicolor experiments. The green signals for D11S4143 are obscured by overlying signals that appeared to suggest a more distal location but were ordered by two-color analyses. BACs for markers D11S4107 and D11S4089 suggested multisite locations in q11.23 as shown. Three randomly mapped BACs (J. R. Korenberg, X-N. Chen, Z. Sun, D. Noya, H. Shizuya, and M. Simon, in prep.) were used as markers for the telomeric (B376B12, B1005B03) and centromeric (B344A05) regions.
Future efforts will focus on generating overlapping and interdigitated Visible Human Genome sets (including about one color-linked BAC marker per 500 kb), employing and integrating these sets with “chip” arrays, filling the gaps in the map, and increasing the density to one per 300–1000 kb.
Beyond Sequence
Within the next 2 years, most of the human genome sequence will be available to supplement the traditional tools of genetic analysis. The integrated BAC resource provides the entry points and physical resources needed for studies of human genetics and human variation, mutation analysis and DNA sequencing, chromosome structure, and gene discovery and diagnosis associated with cancer. To understand the chromosomal rearrangements that underlie many cancers, genomic diseases, and evolution, even the knowledge of all 3,000,000,000 nucleotides of human sequence will not diminish the need for a fully integrated molecular cytogenetic array. In mapping these BACs on chromosomes we have provided a bridge from biomedical problems to the molecular world.
METHODS
BAC Clone and STS Analysis
A subset of 17,700 clones were identified and pooled from the Caltech human BAC libraries A (Shizuya et al. 1992) and B (Kim et al. 1996), after sampling analyses by PFGE to determine transformation subsets with the larger inserts (data not shown). DNA representing pooled BAC clones was screened by PCR using automated systems at the Whitehead Institute/MIT Center for Genome Research. Initially, 2600 FISH-mapped clones were screened for STS content. Pools representing an additional 14,000 random human clones were later added to the screening process. Initially, only addresses of positive clones were transmitted between the laboratories, but the high rate of multiple independent clones present in the same well of the library plate led to ambiguous or discrepant STS versus FISH data. Therefore, the process was modified such that only bacterial stocks or DNAs derived from single colonies, for which PCR had confirmed the STS content, were transferred between laboratories.
Several schemes were used to generate BAC DNA pools for STS content screening. Initially, a simple two-level pooling scheme similar to one used for YAC screening at the Genome Center was utilized (Bell et al. 1995; Hudson et al. 1995). Subsequently, DNAs were combined using a five-dimensional pooling scheme that provides redundant PCR information to increase the yield of addresses from the screens (B. Birren, unpubl.). The STSs used to screen the BAC DNA pools were selected from the larger set of STSs mapped to the Whitehead Institute physical map or the Genethon genetic map (Dib et al. 1996).
BAC DNA Preparation and FISH Analysis
BAC DNA for FISH was prepared manually or by using an Autogen 740 automated DNA preparation device (Integrated Separation Systems, Natick, MA). Initially, BAC DNAs were prepared from cultures inoculated directly from the wells of the multiwell plates identified by the library screen. BAC DNA prepared manually was treated with RNase A and extracted with phenol/chloroform prior to labeling (Hubert et al. 1997), whereas DNA prepared by the Autogen was used directly. DNAs were labeled by nick translation in the presence of biotin-14–dATP or digoxigenin-11–dUTP, respectively using a nick translation labeling kit (GIBCO BRL). DNA samples were mapped in pairs on high-resolution human metaphase chromosomes by multicolor FISH and reverse banding (Korenberg and Chen 1995). For each BAC, 20–30 cells were examined, an initial map position was assigned, two to three chromosomal images were captured using a Photometrics Cooled-CCD camera (CH250) and BDS image analysis software (ONCOR Imaging, Inc., Gaithersburg, MD), and stored on an optical disc drive. All images were reviewed independently by a second cytogeneticist to determine final band assignment (400–850 bands) in accordance with ISCN (1995). Data were recorded on spreadsheets and transferred to a four-dimensional relational database of chromosome bands, constructed according to the levels of resolution assigned. The resolution is indicated on Figure 1. The FISH image shown in Figure 2 was performed using a different method. Four different nucleotides (rhodamine-4–dUTP, coumarin-4–dUTP, Cy5–dUTP, and fluorescein-11–dUTP) (Amersham Life Science) were used to directly label a total of 30 DNAs according to the manufacturer's instructions. One to three DNAs per band were grouped, each group was labeled with one of four dyes, and all were hybridized simultaneously (20–40 ng of each) with the order of colors designed to allow clear definition of overlaps. After an overnight hybridization samples were washed briefly. The first wash was in buffer containing 2× SSC and 50% formamide at 44°C for 5 min, followed by a wash in 2× SSC at room temperature for 2 min. Chromomycin A3 and distamycin were used for chromosome counterstaining to simultaneously detect signal and fluorescent banding (Korenberg and Chen 1995).
Acknowledgments
This work was supported in part by Department of Energy grants 92ER61402 and 96ER62294 (J.R.K.), National Institutes of Health (NIH) grants HD17449 and HD33113 (J.R.K.), and NIH award HG00098 (E.S.L.). J.R.K. holds the Geri and Richard Brawerman Chair in Molecular Genetics. T.J.H. is a recipient of a clinician–scientist award from the Medical Research Council of Canada. We thank Eric S. Lander for support and encouragement.
The publication costs of this article were defrayed in part by payment of page charges. This article must therefore be hereby marked “advertisement” in accordance with 18 USC section 1734 solely to indicate this fact.
Footnotes
E-MAIL julie.korenberg@cshs.org; FAX (310) 652-8010.
REFERENCES
- Bell CJ, Budarf ML, Nieuwenhuijsen BW, Barnoski BL, Buetow KH, Campbell K, Colbert AM, Collins J, Daly M, Desjardins PR, et al. Integration of physical, breakpoint and genetic maps of chromosome 22. Localization of 587 yeast artificial chromosomes with 238 mapped markers. Hum Mol Genet. 1995;1:59–69. doi: 10.1093/hmg/4.1.59. [DOI] [PubMed] [Google Scholar]
- Bellugi U, Lichtenberger L, Mills L, Galaburda D, Korenberg JR. Bridging cognition, brain and molecular genetics: Evidence from Williams syndrome. Trends Neurosci. 1999;22:197–207. doi: 10.1016/s0166-2236(99)01397-1. [DOI] [PubMed] [Google Scholar]
- Chen X-N, Knauf JA, Gonsky R, Wang M, Lai EH, Chissoe S, Fagin JA, Korenberg JR. From amplification to gene in thyroid cancer: A high-resolution mapped bacterial-artificial-chromosome resource for cancer chromosome aberrations guides gene discovery after comparative genome hybridization. Am J Hum Genet. 1998;63:625–637. doi: 10.1086/301973. [DOI] [PMC free article] [PubMed] [Google Scholar]
- Deloukas P, Schuler GD, Gyapay G, Beasley EM, Soderlund C, Rodriguez-Tome P, Hui L, Matise TC, McKusick KB, Beckmann JS, et al. A physical map of 30,000 human genes. Science. 1998;282:744–746. doi: 10.1126/science.282.5389.744. [DOI] [PubMed] [Google Scholar]
- Dib C, Faure S, Fizames C, Samson D, Drouot N, Vignal A, Millasseau P, Marc S, Hazan J, Seboun E, et al. A comprehensive genetic map of the human genome based on 5,264 microsatellites. Nature. 1996;380:152–154. doi: 10.1038/380152a0. [DOI] [PubMed] [Google Scholar]
- Eichler EE. Repetitive conundrums of centromere structure and function. Hum Mol Genet. 1999;2:151–155. doi: 10.1093/hmg/8.2.151. [DOI] [PubMed] [Google Scholar]
- Foote S, Vollrath D, Page D. The human Y chromosome: Overlapping DNA clones spanning the euchromatic region. Science. 1992;258:60–66. doi: 10.1126/science.1359640. [DOI] [PubMed] [Google Scholar]
- Hubert RS, Mitchell S, Chen X-N, Ekmekji K, Gadomski C, Sun Z, Noya D, Kim U-J, Chen C, Shizuya H. BAC and PAC contigs covering 3.5Mb of the Down syndrome congenital heart disease region between D21S55 and MX1 on Chromosome 21. Genomics. 1997;41:218–226. doi: 10.1006/geno.1997.4657. [DOI] [PubMed] [Google Scholar]
- Hudson TJ, Stein LD, Gerety SS, Ma J, Castle AB, Silva J, Slonim DK, Baptista R, Kruglyak L, Xu SH, et al. An STS-based map of the human genome. Science. 1995;270:1945–1954. doi: 10.1126/science.270.5244.1945. [DOI] [PubMed] [Google Scholar]
- Mitelman F, Karger S, editors. ISCN. An International System for Human Cytogenetic Nomenclature. 1995. . Basel, Switzerland. [Google Scholar]
- Kim UJ, Birren BW, Slepak T, Mancino V, Boysen C, Kang HL, Simon MI, Shizuya H. Construction and characterization of a human bacterial artificial chromosome library. Genomics. 1996;2:213–218. doi: 10.1006/geno.1996.0268. [DOI] [PubMed] [Google Scholar]
- Korenberg JR, Chen X-N. Human cDNA mapping using a high resolution R-banding technique and fluorescence in situ hybridization. Cytogenet Cell Genet. 1995;69:196–200. doi: 10.1159/000133962. [DOI] [PubMed] [Google Scholar]
- Korenberg JR, Schreck R, Yang-Feng T, Chen X-N. Fluorescence in situ Hybridization and the Human Genome. Trends Biotechnol. 1992;10:27–32. doi: 10.1016/0167-7799(92)90163-p. [DOI] [PubMed] [Google Scholar]
- Lengauer C, Kinzler KW, Vogelstein B. Genetic instabilities in human cancers. Nature. 1998;390:643–649. doi: 10.1038/25292. [DOI] [PubMed] [Google Scholar]
- Lupski JR. Genomic disorders: Structural features of the genome can lead to DNA rearrangements and human traits. Trends Genet. 1998;10:417–422. doi: 10.1016/s0168-9525(98)01555-8. [DOI] [PubMed] [Google Scholar]
- Puechberty J, Laurent AM, Gimenez S, Billault A, Brun-Laurent ME, Calenda A, Marcais B, Prades C, Ioannou P, Yurov Y, Roizes G. Genetic and physical analyses of the centromeric and pericentromeric regions of human chromosome 5: Recombination across 5cen. Genomics. 1999;56:274–287. doi: 10.1006/geno.1999.5742. [DOI] [PubMed] [Google Scholar]
- Shizuya H, Birren B, Kim U-J, Mancino V, Slepak T, Tachiiri Y, Simon M. Cloning and stable maintenance of 300-kilobase-pair fragments of human DNA in Escherichia coli using an F-factor-based vector. Proc Natl Acad Sci. 1992;89:8794–8797. doi: 10.1073/pnas.89.18.8794. [DOI] [PMC free article] [PubMed] [Google Scholar]
- Trask BJ, Friedman C, Martin-Gallardo CA, Rowen L, Akinbami C, Blankenship J, Collins C, Giorgi D, Iadonato S, Johnson F, et al. Large multi-chromosomal duplications encompass many members of the olfactory receptor gene family in the human genome. Hum Mol Genet. 1998;7:2007–2020. doi: 10.1093/hmg/7.13.2007. [DOI] [PubMed] [Google Scholar]