Abstract
E. coli FtsZ has no native tryptophan. We showed previously that the mutant FtsZ L68W gave a 2.5-fold increase in trp fluorescence when assembly was induced by GTP. L68 is probably buried in the protofilament interface upon assembly, causing the fluorescence increase. In the present study we introduced trp residues at several other locations and examined them for assembly-induced fluorescence changes. L189W, located on helix H7 and buried between the N- and C-terminal subdomains, showed a large fluorescence increase, comparable to L68W. This may reflect a shift or rotation of the two subdomains relative to each other. L160W showed a smaller increase in fluorescence, and Y222W a decrease in fluorescence, upon assembly. These two are located on the surface of the N and C subdomains, near the domain boundary. The changes in fluorescence may reflect movements of the domains or of nearby side chains. We prepared a double mutant Y222W/S151C and coupled ATTO-655 to the cys. The Cα of trp in the C-terminal subdomain was 10 Å away from that of the cys in the N-terminal subdomain, permitting the ATTO to make van der Waals contact with the trp. The ATTO fluorescence showed strong tryptophan-induced quenching. The quenching was reduced following assembly, consistent with a movement apart of the two subdomains. Movements of one to several Å are probably sufficient to account for the changes in trp fluorescence and trp-induced quenching of ATTO. Assembly in GDP plus DEAE dextran produces tubular polymers that are related to the highly curved, mini-ring conformation. No change in trp fluorescence was observed upon assembly of these tubes, suggesting that the mini-ring conformation is the same as that of a relaxed, monomeric FtsZ.
FtsZ, a homolog of eukaryotic tubulin, forms the cytoskeletal framework of the contractile ring that divides bacteria (1). In vitro FtsZ assembles into protofilaments that are structurally homologous to the protofilaments of the microtubule wall (2, 3). In some conditions the FtsZ protofilaments associate laterally to form sheets or bundles, but in many conditions they remain as single protofilaments, one subunit thick (4–6). Assembly of these one-stranded protofilaments shows characteristics of cooperative assembly, including a critical concentration and kinetics that fit a weak dimer nucleus (5, 7). Cooperative assembly is well understood for two- or multi-stranded filaments (8), but cooperativity of one-stranded protofilaments is more difficult to explain (4). Three groups have suggested that the appearance of cooperativity could be generated by a conformational change that favors assembly, and that is favored by the act of assembly itself (9–12). Experimental verification of conformational changes that might accompany assembly has been lacking. See (1) for a review of FtsZ.
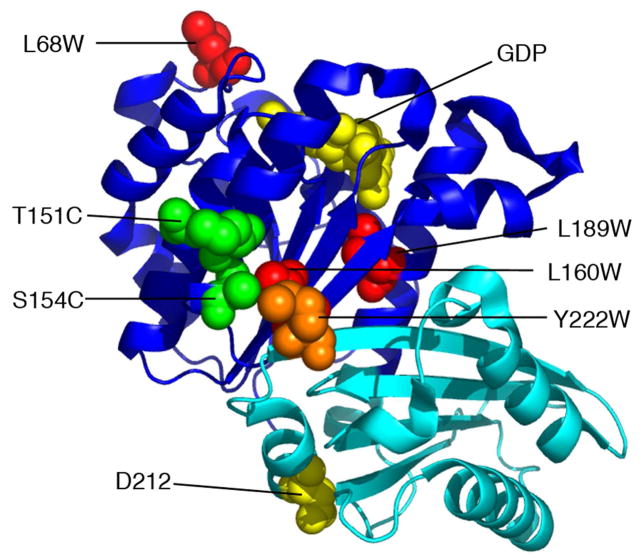
FtsZ has two globular subdomains, which are independently folding (13, 14) (Fig. 1). The N-terminal subdomain contains all amino acids of the protofilament interface on the plus-end side of the subunit, including the GTP-binding site. The C-terminal subdomain contains all interface amino acids on the minus-end side of the subunit, including the catalytic amino acids that stimulate GTP hydrolysis. The two subdomains are connected by a long helix, H7, which is sandwiched between them. Conformational changes might involve sliding or rotation of the two subdomains, or in more extreme models a complete separation. However, crystal structures of FtsZ from several different species, and with the nucleotide binding site occupied by GTP, GDP, or other ions, all show identical conformations (15). In particular, the two subdomains are in the same orientation in all crystal structures, an orientation that corresponds to the curved conformation in crystals of tubulin-stathmin (16). A recent study suggested that a number of hinge points exist within and between the two subdomains (17), and discovered some mutants that locked protofilaments into a curved conformation. Conformational changes within the subunits, in particular ones that might accompany assembly, have not yet been identified.
Figure 1.
Location of trp and cys mutants used in this study. The globular part of FtsZ comprises two subdomains (N-terminal dark blue, C-terminal cyan), which are independently folding (13, 14). GDP and the synergy residue D212 are shown in yellow spacefill. Three of the residues mutated to trp are shown in red spacefill. Y222 is in orange. The two residues mutated to cys (both in the presence of Y222W) are in green. The model is from the crystal structure of P. aeruginosa FtsZ, PDB 1ofu (39). The amino acids indicated are those of E. coli, some of which are different from the corresponding ones in P. aeruginosa.
FtsZ of most species has no natural tryptophan. In a previous study our lab mutated L68 of Escherichia coli FtsZ to trp (L68W) and found that the trp fluorescence emission increased 2.5 fold when the FtsZ assembled (5). L68 is on the loop T3 near the plus end interface, and we reasoned that the fluorescence increase was produced when the trp was partially buried in contact with the minus end of the subunit above. The L68W mutant was used as a measure of total assembly to investigate the kinetics.
We have now prepared several new mutants of E. coli FtsZ, each introducing a single trp. One trp is on helix H7 and buried between the N- and C-terminal subdomains. The others are on the surface of the N- and C-terminal subdomains near their interface. Each of these trp mutants showed a substantial change in fluorescence upon assembly, indicating a conformational change in the nearby environment. We explore the magnitude of the conformational changes and discuss their significance. The trp mutants described here provide sensitive new tools to assay assembly of FtsZ.
EXPERIMENTAL PROCEDURES
Proteins purification and Labeling
All studies were done with E. coli FtsZ. Mutants of FtsZ were constructed using site-directed mutagenesis in the plasmid pET11b-FtsZ. FtsZ proteins were expressed and purified as described previously (5, 7). Briefly, the soluble bacterially expressed protein was purified by 30% ammonium sulfate precipitation, followed by chromatography on a source Q 10/10 column (GE healthcare) with a linear gradient of 50–500 mM KCl in 50 mM Tris, pH 7.9, 1 mM EDTA, 10% glycerol. Peak fractions were identified by SDS-PAGE and stored at −80 °C.
For the FRET (fluorescence resonance energy transfer) assay the FtsZ mutant L189W/F268C was labeled with fluorescein 5-maleimide and tetramethylrhodamine 5-maleimide (Molecular Probes) for use as a pair (5). Briefly, a 5-fold molar excess of dye was incubated with FtsZ protein at room temperature for 2 hours. After adding 1 mM DTT, free dye was removed with a G-25 Quick Spin Protein Column (Roche Applied Science). The labeling efficiency was >90% for each fluorophore. Labeled protein was stored at −80 °C.
Before each experiment, a cycle of calcium assembly-disassembly was done to remove any inactive protein and remaining free probe. Briefly, FtsZ protein with 10 mM CaCl2 and 2 mM GTP was incubated for 5 min at 37 °C to assemble protofilament bundles. The FtsZ polymer was collected by centrifugation at 45,000 rpm for 30 min (Beckman TLA100 rotor). The pellet was resuspended and solubilized in assembly buffer without GTP and Ca, and centrifuged again to remove any insoluble protein. Most experiments were done in HMK buffer (50 mM HEPES pH 7.7, 5 mM MgAc, 100 mM KAc), and assembly was initiated by adding 0.1–0.5 mM GTP. Some experiments were done in MEK buffer (50 mM MES, pH 6.5, 1 mM EDTA, 100 mM KAc), or as noted. The protein concentration was determined using a BCA assay and corrected for the 75% color ratio of FtsZ/BSA, as descripted previously (18).
GTPase activity measurement
GTPase activity was measured using a continuous, regenerative coupled GTPase assay (19). In this assay, all free GDP in solution is rapidly regenerated into GTP, in a reaction that consumes one NADH per GDP. The GTP hydrolysis rate is measured by the decrease in absorption of NADH, in a Shimadzu UV-2401PC spectrophotometer, using the extinction coefficient 0.00622 μM−1cm−1 at 340 nm. Our assay mixture included 1 mM phosphoenolpyruvate, 0.8 mM NADH, 20 units/ml pyruvate kinase and lactate dehydrogenase (Sigma-Aldrich), and 0.2 mM GTP. A 3-mm path cuvette was used for measurement. Hydrolysis was plotted as a function of FtsZ concentration, and the slope of the line above the critical concentration (~1 μM for all mutants) was taken as the hydrolysis rate. Measurements were made in a thermostatically controlled cell at 25° C.
Fluorescence measurement
Fluorescence measurements were taken with a Shimadzu RF-5301 PC spectrofluorometer. FtsZ assembly kinetics were measured following addition of GTP to 0.5 mM, using an Applied Photophysics RX 2000 Rapid Kinetics System stopped-flow mixing accessory. All fluorescence measurements were taken in a thermostatically controlled cell at 25 °C.
For most tryptophan mutants, trp emission spectra were measured between 300 nm to 420 nm, with excitation at 295 nm. Assembly kinetics were monitored by measuring the tryptophan emission at 340 or 350 nm, with excitation at 295 nm. For the FRET assay, assembly was tracked using the decrease in donor fluorescence at 515 nm, with excitation at 470 nm as described previously (5).
Photoinduced electron transfer (20) or Tryptophan-Induced Quenching (21)
Some fluorophores can be efficiently quenched by a tryptophan that is close enough to form van der Waals contacts and perhaps ring stacking. We constructed FtsZ double mutants T151C/Y222W and S154C/Y222W, in which cys is close to the trp (10 and 7 Å between the Cα’s). We labeled the cys with the fluorescent dye ATTO-655-maleimide (Fluka) or BODIPY FL N-(2-aminoethyl)maleimide (BODIPYaem; Molecular Probes). For assembly experiments, the labeled FtsZ protein was diluted with a 9-fold excess of unlabeled protein to avoid the formation of FtsZ bundles. ATTO fluorescence spectra were measured between 660 nm and 750 nm, with excitation at 650 nm, and assembly kinetics were measured at the ATTO emission peak 680 nm, with excitation at 650 nm. BODIPY fluorescence spectra were measured between 500 nm and 600 nm with excitation at 490 nm, and assembly kinetics were measured at the peak 515 nm, with excitation at 490 nm. All measurements were taken at 25 °C.
Electron Microscopy
FtsZ filaments were imaged by negative stain electron microscopy (EM). Approximately 10 μL of sample in the appropriate buffer was incubated with GTP for 1~2 min and applied to a carbon-coated copper grid. Samples then were negatively stained with 2% uranyl acetate and photographed using a Philips 301 electron microscope at 50,000X magnification. Specimens of DEAE dextran assembly were made after 2–5 min of assembly.
RESULTS
Design of trp mutants and measure of steady state fluorescence before and after assembly
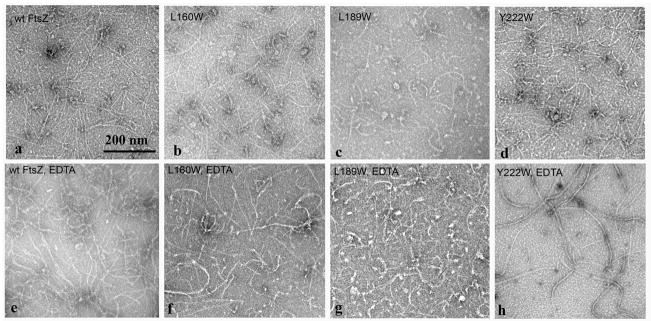
We constructed three single trp mutants at positions indicated in Fig. 1. We also included the previously described L68W in some experiments. L189W is on helix H7; it is sandwiched between the N- and C-terminal subdomains, and appears to be completely buried in a spacefilling model (not shown). L160W and Y222W are on the N- and C-terminal subdomains respectively, close to the boundary between the two subdomains. L160 is partly covered by an overlapping side chain in the Pseudomonas structure, while Y222 (M223 in Pseudomonas) seems almost completely exposed. L68 is completely exposed on the upper protofilament interface in the FtsZ monomer. All trp mutants assembled well and had good GTP hydrolysis activities. Fig. 2a-d shows the negative stain EM pictures of FtsZ filaments assembled in HMK buffer (pH 7.7, 100 mM KAc, 5 mM MgAc); Fig. 2e-h shows assembly in MEK buffer (pH 6.5, 100 mM KAc, 1 mM EDTA). We used pH 6.5 for assembly in EDTA buffer because assembly is weak (high critical concentration) in EDTA at pH 7.7. FtsZ-L189W assembled into one-stranded protofilaments or small bundles, which were somewhat shorter than those of wild type FtsZ (Fig. 2c). L160W and Y222W assembled protofilaments indistinguishable from wild type FtsZ (Fig. 2).
Figure 2.
Negative stain EM of 5 μM assembled wild type FtsZ and single trp FtsZ mutants in the presence of 5 mM MgAc, pH 7.7 (a-d), or 10 μM FtsZ in presence of 1 mM EDTA, pH 6.5 (e-h). The scale bar is 200 nm.
We began our studies using L189W protein that had been purified without any added nucleotide, and we discovered a curious effect. Upon adding GTP there was a rapid rise in fluorescence, followed by a slow decline over 300–500 s. Adding GDP caused only the slow decline (data not shown). But if GDP was added first and fluorescence allowed to stabilize, an excess of GTP now caused a rapid rise to a plateau, which was stable until the GTP was exhausted. This suggested that protein purified and stored in the absence of nucleotide adopted some inactive conformation or aggregation state that could be reversed (over a period of minutes) by adding GDP. This may be related to the pronounced lag in GTP hydrolysis seen in early studies, which could be reversed by pre-incubation with any of several nucleotides (22). We have not seen this effect with other trp mutants, so it may be peculiar to L189W; alternatively, it may be a property common to FtsZ but only reported by L189W. We have resolved this problem by subjecting the protein to a cycle of assembly in Ca, as described in Methods, prior to each experiment. Following assembly and pelleting, the protein retains one molecule of GDP bound to each FtsZ, plus a small excess trapped in the pellet. Using the step of Ca assembly we obtained very reproducible fluorescence changes that seemed to follow assembly.
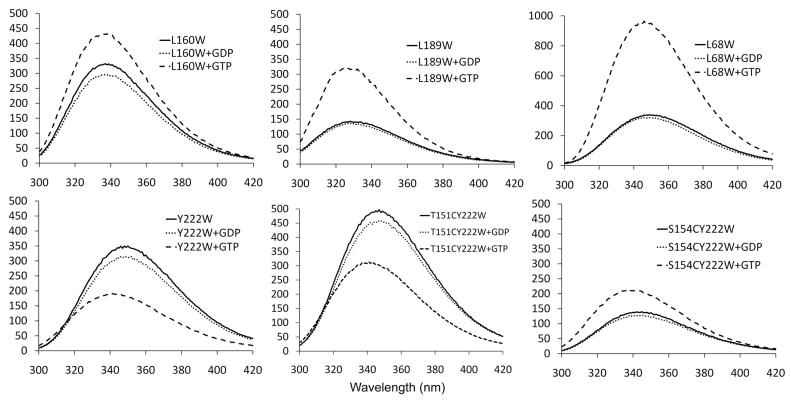
We first characterized the trp fluorescence at steady state (Fig. 3). Each protein was subjected to a round of Ca assembly, the pellets were resuspended in HMK buffer and diluted to the same concentration, 5 μM. The emission peak prior to assembly varied from 350 nm for L68W to 330 nm for L189W. In most cases there was a less than 5 nm blue shift following assembly, and for Y222W the blue shift was 10 nm. The most striking change was in the emission intensity upon assembly. L68W gave the largest change, increasing three-fold (consistent with our previous report of a 2.5-fold increase in MMK buffer, pH 6.5 (5). L189W had a peak emission less than half that of L68W before assembly, but it also showed a 2.5-fold increase upon assembly. L160W showed a moderate increase, while Y222W showed a significant decrease in emission intensity. The overall conclusion is that each of the four trp mutants examined here showed a significant change in trp emission intensity upon assembly in GTP.
Figure 3.
Steady state emission spectra of the different mutants. Each mutant protein was diluted to 5 μM concentration, excited at 295 nm, and the emission spectrum recorded with no addition and with 1/20 volume of GDP or GTP (to 0.2 mM final concentration). Spectra were recorded after 1 min to achieve steady state. The small decrease upon addition of GDP is due partly to dilution and partly to the weak absorption by GDP at 295 nm. Note that the scale for L68W is twice that of the other panels.
We made two other trp mutants, F182W and L199W, located on the top and bottom of the H7 helix. These showed no GTPase or assembly and were abandoned.
Critical concentration and kinetics of assembly of the trp mutant L189W
When assembly of L189W was initiated by adding 0.1 mM GTP, there was a very rapid fluorescence increase up to a plateau (Fig 4a). We determined the critical concentration by plotting the plateau fluorescence against the total FtsZ concentration (Fig. 4b). A plot of GTPase vs FtsZ concentration also gave a straight line with a similar intercept (Fig. 4b). From these two assays we deduce a critical concentration of 0.8–1.0 μM for L189W. This is the same as wild type FtsZ (7, 23, 24). The critical concentration of the mutant L68W was 0.1 μM (7), indicating that this trp mutation in the protofilament bond interface significantly enhanced the affinity. The GTPase of L189W was higher than that of wild type - 9 GDP per min per FtsZ (Fig. 4a), vs 5–7 for wild type FtsZ at 25 °C (25).
Figure 4.
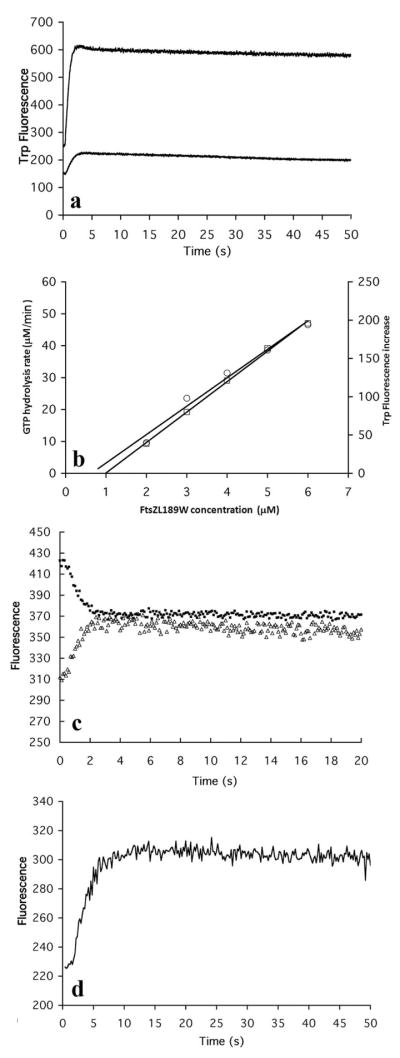
(a) Time course of assembly of L189W measured by trp fluorescence. The FtsZ concentration was 2.5 μM and 5 μM for the lower and upper curves. (b) L189W has a critical concentration 0.8-1 μM, measured by both GTP hydrolysis rate (left ordinate, circles) and trp fluorescence increase (right ordinate, squares). (c) The assembly of L189W/F268C measured by increasing trp fluorescence (lower curve) and by decreasing donor fluorescence in FRET (upper curve). (d) Assembly of 10 μM L189W in EDTA buffer measured by trp fluorescence increase.
Following addition of GTP, the fluorescence of L189W increased rapidly to a plateau, which was reached in about 3 s (Fig 4a,c). This is 2–4 times faster than the kinetics of L68W, and of F268C labeled for FRET (5, 7). We wondered if the rapid fluorescence increase of L189W might be reporting a conformational change linked to GTP binding or some pre-assembly steps, rather than to assembly of protofilaments. To test whether the trp fluorescence followed assembly, we constructed a double mutant L189W/F268C, which we could label with fluorescent probes to assay assembly by FRET (7). We tracked assembly of a sample at 5 μM concentration using FRET (decrease in donor fluorescence), and then tracked a duplicate sample by trp fluorescence (Fig. 4c). The kinetics of the two curves were identical, reaching a plateau in 2.5–3.0 s. We conclude that the trp fluorescence of L189W is indeed tracking assembly, and that the assembly of this trp mutant is substantially faster than assembly of L68W and F268C.
We also checked the assembly kinetics of L189W in MEK buffer (50 mM Mes, 100 mM KAc, 2.5 mM EDTA, pH 6.5), where the chelation of Mg blocks GTP hydrolysis but permits assembly. Following addition of GTP the trp fluorescence increased to a plateau (Fig 4d). This assembly was somewhat slower than in pH 7.7 buffer with Mg. Also assembly in MEK had a much higher critical concentration; there was no assembly at 5 μM, and the curve shown was for 10 μM. We conclude that the FtsZ conformational change reported by the trp fluorescence is due to assembly, and is independent of GTP hydrolysis.
Surface-exposed trp mutants near the subdomain boundary
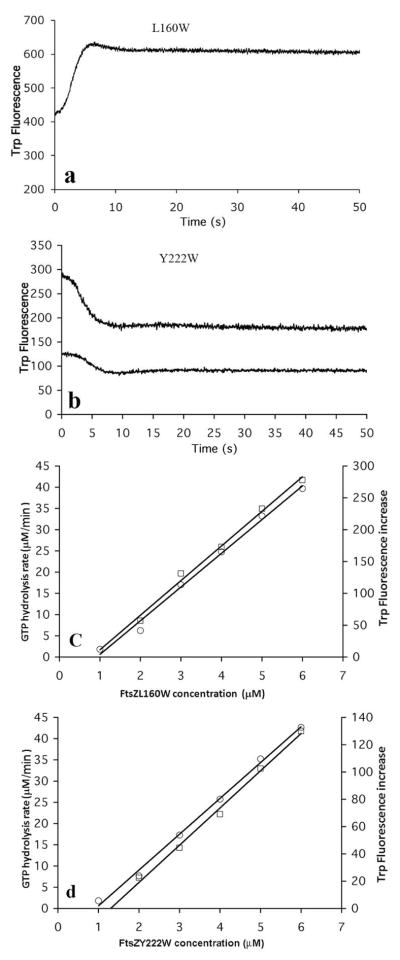
To explore further possible conformational changes during assembly, we constructed two new single trp mutants, L160W and Y222W. L160 is in the N-terminal and Y222 in the C-terminal subdomain, and each is close to the interface between the two subdomains (Fig. 1). Each of these trp mutants showed fluorescence changes after initiating assembly by adding GTP. The trp fluorescence of L160W increased about 50% during assembly, while that of Y222W decreased (Fig. 5a, b). The kinetics of assembly of each of these mutants was 2–4 times slower than for L189W, and very similar to L68W and F268C. Plotting the fluorescence change at plateau, and the GTPase activity, as a function of total FtsZ concentration, we found that both Y222W and L160W had critical concentrations around 1 μM (Fig 5c-d), the same as wild type FtsZ. Both mutant proteins could assemble into filaments in EDTA buffer, pH 6.5 when the concentration was above 5 μM (not shown). The GTP hydrolysis rate of these two mutants was similar to that of wild type.
Figure 5.
trp fluorescence during assembly showed an increase for 5 μM L60W (a) and a decrease for 2.5 μM and 5 μM Y222W (b). The critical concentrations of L160W (c) and Y222W (d) are around 1 μM measured by both GTP hydrolysis rate and trp fluorescence changes.
Subdomain movements reported by changes in tryptophan quenching of ATTO and BODIPY
To explore further the movements of the N- and C-terminal subdomains relative to each other, we turned to a technique termed Photoinduced-Electron Transfer (20), or Tryptophan-Induced Quenching (21). In this technique the fluorescent dye ATTO or BODIPY is attached to a cys that is close to a trp, and its fluorescence is quenched when it forms a close contact with the indole ring of the trp. For this we used the trp in Y222W in the C-terminal subdomain, as the quencher, and we created cys mutations in the N-terminal subdomain for attachment of the fluorophores. We constructed two FtsZ double mutants: Y222W/S154C and Y222W/T151C. The distance between the alpha carbons was 7.2 Å for Y222W/S154C, and 10.0 Å for Y222W/T151C. Both ATTO-655 and BODIPYaem have a long linker (comprising the maleimide plus 4-6 N and C atoms (21)) between the cys attachment and the fluorophore, which should easily span these distances. Each of the double mutants assembled with kinetics similar to the Y222W single mutant as measured by changes in trp fluorescence (not shown).
Before attaching the ATTO we made a new discovery, that introducing the cys residues substantially altered the trp fluorescence of 222W. T151C, which is 10 Å away, caused the trp fluorescence to increase in the unassembled state; assembly caused a drop in fluorescence (Fig. 3), similar to the case for the single Y222W mutant. S154C, which is 7.2 Å away, caused a substantial decrease in fluorescence in the absence of assembly; upon assembly the fluorescence increased (Fig. 3), the opposite of the single Y222W mutant. These effects are addressed in the Discussion.
We then labeled the cys of T151C/Y222W with ATTO-655 maleimide. The labeled mutant showed a strong quenching of the ATTO fluorescence in the native protein, as indicated by the very large increase in fluorescence upon denaturation in urea (Fig. 6a). We then tested how the quenching was affected by assembly. In preliminary assays we found that when the protein was highly labeled with ATTO it formed bundles in which the ATTO fluorescence was decreased by auto-FRET (data not shown), as previously observed for fluorescein-labeled FtsZ (26). These bundles also had a significantly decreased GTPase. To avoid these effects we mixed 1 part of ATTO-labeled FtsZ with 9 parts unlabeled FtsZ. Figure 6a shows that ATTO fluorescence increased about 60% upon assembly, suggesting that 151C moved away from 222W, resulting in decreased quenching of ATTO. This increase was small compared to the complete loss of quenching in urea, suggesting that the movement was small. The increase in ATTO fluorescence occurred with essentially the same kinetics as assembly measured by trp fluorescence (Fig. 6b).
Figure 6.
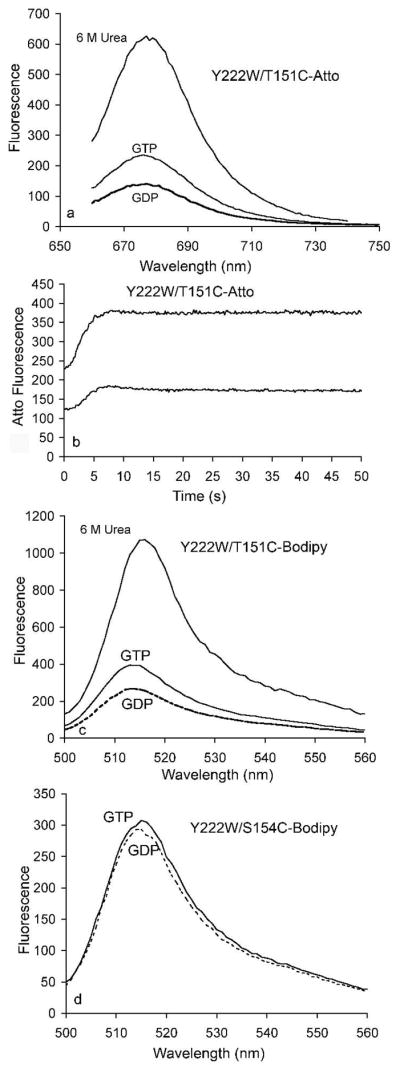
Assembly-induced change in tryptophan-induced quenching. The cys of Y222W/T151C, where the alpha carbons of W and C are 10 Å apart, was labeled with ATTO-655 or BODIPYaem and examined for quenching. (a) ATTO fluorescence in GDP was substantially quenched in the native FtsZ relative to urea-denatured FtsZ. Adding GTP to induce assembly reduced the quenching, indicated by increased fluorescence emission. (b) Time course of ATTO fluorescence during assembly, at 5 μM (upper curve) and 2.5 μM (lower curve) FtsZ. (c) Quenching of BODIPYaem fluorescence in the Y222W/T151C mutant was very similar to that of ATTO. (d) BODIPYaem-labeled Y222W/T154C, where the W and C are only 7.2 Å apart, showed an insignificant fluorescence increase after adding GTP to induce the assembly.
We repeated these experiments with the S154/Y222W mutant. In this case we also obtained a large quenching of ATTO fluorescence before assembly; however there was essentially no change upon assembly. We suggest that the closer distance of the 154–222 pair (the Cα atoms are 7.2 Å apart) allows for full quenching even after the small subdomain movement that accompanies assembly. This is consistent with the observations of Mansoor et al, who found substantial quenching of ATTO when the W-C distance was 7.5 Å, and reduced but variable quenching for a distance of 10-11 Å (21).
Very similar results were obtained with the BODIPYaem label. When attached to 151C, the BODIPYaem fluorescence was strongly quenched in GDP, and fluorescence increased about 60% after assembly in GTP (Fig. 6c). When attached to 154C the BODIPYaem showed similar strong quenching, but no change in fluorescence upon assembly. As with the ATTO this suggests that the 7.2 Å spacing of 154-222 is too short for the subdomain movements to reduce the quenching.
Trp mutants with no change in fluorescence
We tested three mutants, L10W, T65W and T162W, that showed normal assembly but no change in trp fluorescence (data not shown). T162 is at the interface of the two subdomains and only two amino acids away from L160, which gave a 50% increase in fluorescence upon assembly. L160 (L161 in the Pseudomonas crystal structure) in the N-terminal subdomain is partly covered by and in contact with M223 (in the Pseudomonas crystal structure) in the C-terminal subdomain, whereas T162 (T163 in Pseudomonas) is exposed on the surface and makes no contact with the C-terminal subdomain. The absence of a fluorescence change for L160W may be due to this absence of contact.
T65 is close to the L68, which gave a 2.5-fold fluorescence increase. The equivalent mutation in Methanococcus jannaschii FtsZ, T92W, gave a 30% increase in fluorescence when the nucleotide was changed from GDP to GTP (27). That measurement was done in the absence of Mg, which prevents assembly of M. jannaschii FtsZ (at the 2 μM concentration tested), and was interpreted to show a movement of the T3 loop caused by the gamma phosphate of GTP. We repeated the measurement of our T65W of E. coli FtsZ at 0.5 μM FtsZ, which is below the critical concentration and therefore lacking assembly, and at 5 μM FtsZ, which assembled normally. We saw no change in fluorescence in either case after adding GTP. This suggests that the movement of the T3 loop upon GTP binding is not a universal mechanism across FtsZ’s.
Acrylamide quenching
Tryptophans that are exposed to the solvent are readily quenched by adding acrylamide to the solvent, while trp buried in the interior of a subunit are not (28). We tested the quenching of four trp mutants with 100 mM acrylamide, in GDP and GTP. As shown in Table 1, the largest quenching was of Y222W and L68W in GDP, consistent with spacefilling models showing them exposed on the surface. The quenching of L68W was 45% in GDP, and only 19% in GTP, consistent with this trp becoming buried in the protofilament interface. Y222W quenching dropped from 50% in GDP to 30% in GTP, suggesting that the conformational change partially buries it. L189W was the least sensitive to acrylamide quenching, 21% and 13% in GDP and GTP. L160W showed 25% quenching in both GDP and GTP; this suggests that the increase in trp fluorescence upon assembly is caused by movement of nearby side chains without changing the exposure to solvent.
Table 1.
Tryptophan fluorescence of FtsZ trp mutant (L189W, L160W, Y222W and L68W) quenched by 100 mM acrylamide with or without assembly in GTP. The numbers in columns 2,3,5,6 are the fluorescence emission intensity in arbitrary units, but all scaled together. The quenching % is the percent reduction in acrylamide.
| Mutant | GDP | GDP Acrylamide | Quenching % – GDP | GTP | GTP Acrylamide | Quenching % – GTP |
|---|---|---|---|---|---|---|
| L189W | 131 | 104 | 20.6% | 317 | 275 | 13.2% |
| L160W | 260 | 196 | 24.6% | 347 | 260 | 25.1% |
| Y222W | 302 | 150 | 50.3% | 180 | 126 | 30.0% |
| L68W | 390 | 214 | 45.1% | 1004 | 817 | 18.6% |
A disulfide lock blocks FtsZ activity
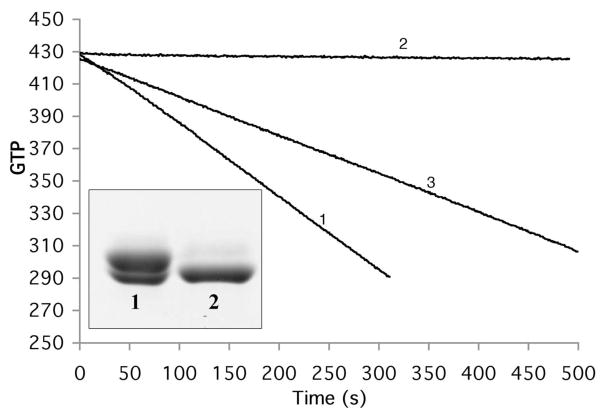
To further test the importance of domain movements, we prepared a double cysteine mutant S154C/Y222C. The alpha carbons of these two amino acids (the same used above for a trp/cys mutant) are 7.2 Å apart, which means that they should be able to form a disulfide bond. This could inhibit the relative motion of the N- and C-terminal subdomains. Fig. 7a shows non-reducing SDS-PAGE analysis of disulfide bond formation. Following normal purification the protein ran as two bands, indicating partial formation of disulfide (however, since the GTPase was equal to wild type FtsZ, it seems likely that the partial disulfide formed after the addition of SDS, and that the purified double cys mutant had no disulfide). We then added 50 μM copper sulfate to catalyze oxidation of the disulfide, and the pattern shifted to a single band with faster migration on the gel, a characteristic of an intramolecular crosslink. Fig. 7b shows that 5 μM double cys mutant had a GTPase activity of 26 min−1, which is similar to that of 5 μM wild type FtsZ. There was little change when tested in the presence of DTT. Following treatment with copper sulfate to form the disulfide bond, the GTPase activity was zero. When this protein was subsequently treated with DTT, the GTPase activity recovered to 15 min−1, 57% of the initial activity. Assembly of protofilaments was confirmed by EM for the untreated protein and protein treated by copper sulfate and then DTT. The disulfide-locked FtsZ also failed to assemble either by itself or in DEAE dextran (see next section). These results suggest that the disulfide bond locked the protein into a conformation that was incapable of assembly.
Figure 7.
GTP hydrolysis of S154CY222C with and without disulfide bond formation assayed by consumption of NADH. The negative slope is proportional to the rate of GTP hydrolysis . Before treatment with CuSO4 the rate was 26 GTP/min (for 5 μM protein, line 1). After treatment with CuSO4 the slope was zero, indicating a complete loss of GTP hydrolysis (line 2). When the protein was subsequently treated with DTT, hydrolysis was recovered to 57% (line 3). The inset shows SDS-PAGE analysis of disulfide bond formation of S154C/Y222C. The protein purified by the normal procedure shows two closely spaced bands (lane 1); following treatment with 50 μM CuSO4 the upper band is converted to the lower band, which runs faster because of the intramolecular disulfide (lane 2).
Assembly of the curved conformation produces no change in trp fluorescence
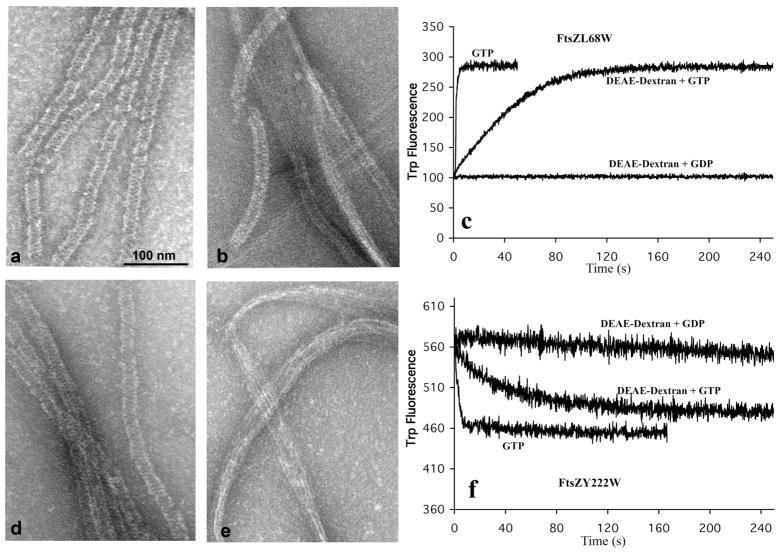
The polycation DEAE dextran stabilizes FtsZ polymers and can drive polymerization in either GTP or GDP. In GTP the polymers are sheets or bundles of straight protofilaments, sometimes mixed with tubes (29, 30). In GDP the polymers are exclusively tubes (29). The tubes have a diameter of 24 nm, the same as mini rings, and are interpreted to be made of protofilaments in the curved conformation (29). We used DEAE dextran assembly to test whether a conformational change accompanied the assembly of tubes.
All four trp mutants assembled into tubular polymers with 10 μM FtsZ (0.4 mg/ml) and 0.15 mg/ml DEAE-dextran in HMK buffer with 0.5 mM GDP (Fig. 8). Assembly with GTP produced a mixture of straight sheets and bundles with some tubular polymers (Fig 8b,e). Assembly in GTP plus DEAE dextran gave a rise in fluorescence for L68W and a decrease for Y222W. This was the same magnitude as for assembly without DEAE dextran, but much slower (Fig. 8c,f). Assembly of L68W and Y222W in GDP produced no detectable change in fluorescence (Fig. 8c,f). Similar results were obtained with L189W and L160W (data not shown). This suggests that the conformation of FtsZ subunits before assembly is the same as the curved conformation in tubular polymers.
Figure 8.
L68W and Y222W polymerization in DEAE dextran. L68W assembled into tubes in DEAE-dextran in GDP (a) and assembled into bundles, sheets plus a few tubes with GTP (b). (c) Assembly of L68W in GDP plus DEAE dextran produced no change in trp fluorescence; assembly in GTP plus DEAE dextran produced a large increase in trp fluorescence, although the increase was much slower than in GTP alone. (d-f) Y222W assembled structures similar to L68W in DEAE dextran; a drop in fluorescence accompanied assembly in GTP, but there was no change in fluorescence for assembly in GDP plus DEAE dextran.
DISCUSSION
If a protein-protein association buries a surface-exposed trp in the interface, the fluorescence of the trp is frequently altered. This change in trp fluorescence can serve to follow the association reaction and report even rapid kinetics. For example, the association of barnase and barstar results in a 20% decrease in total trp fluorescence, and this has been widely used to study kinetics (31). We found that an FtsZ mutant containing a single trp at amino acid 68 (L68W) showed a 2.5-fold increase in trp fluorescence when the FtsZ was induced to assemble by addition of GTP (5). We interpreted this to result from the trp being partially buried in the interface between subunits in the protofilament. This large increase in fluorescence made this mutant an ideal tool to explore kinetics of assembly. The only caveat was that L68W assembled with higher affinity than wild type FtsZ, having a critical concentration about 10 times lower (5). It did, however, complement an FtsZ null, and so could function for cell division.
In the present study we have examined the fluorescence of tryptophans introduced at three new sites. One of these, L189W, gave a large increase in fluorescence upon assembly, comparable to L68W. Two additional trp mutations also showed substantial changes in fluorescence upon polymerization. These three trp mutants provide additional tools to assay assembly of FtsZ, with L160W being especially attractive because its critical concentration and kinetics appear to be the same as wild type FtsZ.
Tryptophan fluorescence is readily quenched by several amino-acid side chains, with cysteine having the strongest activity (32). Consistent with this, we found that introducing a cys at 154, whose alpha carbon is only 7.2 Å from that of 222, caused a two-fold decrease in the fluorescence of 222W in the monomeric state. This cys side chain is close enough to contact the indole ring and cause substantial quenching. In this case polymerization caused an increase in fluorescence, consistent with the quenching cys moving away. The interpretation is more complicated for T151C/Y222W, which are 10 Å apart, where the introduction of cys caused the fluorescence of monomeric FtsZ to increase. Perhaps this cys is too far away to effectively quench, but its introduction caused a rearrangement of other side chains that reduce quenching. These two cys mutants show how sensitive the trp fluorescence can be to small changes in the nearby surface side chains.
A movement of the N-terminal subdomain relative to the C-terminal subdomain was confirmed by ATTO quenching, which also suggested that 151C moved away from 222W upon assembly. The ATTO quenching has not been subject to quantitation, but it seems most consistent with the movements being small. T151 is 10 Å away from Y222 in the relaxed subunit, and may move 1–2 Å farther away upon assembly. S154 is only 7 Å from Y222, and there was no change in ATTO quenching for this pair upon assembly. We suggest that for this closer pair the small movements can be accommodated by the flexibility of the ATTO linker, without disrupting the contact of ATTO and trp. We note that the change in ATTO fluorescence provides yet another tool to assay assembly. This should be especially useful for interactions involving proteins with their own multiple trp.
Martin-Galiano et al (17) have recently presented a theoretical analysis of FtsZ, looking for hinge regions that might support conformational changes. They identified several potential modes, which involved rotational and closure movements both between and within the N- and C-terminal subdomains. Their first consensus movement would have T151 rotating away from Y222, consistent with our interpretation of the ATTO quenching. Based on this analysis, they made several point mutations that altered assembly, some producing spiral polymers that are likely related to the curved conformation discussed below. None of their mutations corresponded to those in our study.
Diaz-Espinoza et al (33) searched for flexible and rigid zones of FtsZ based on B factors of published crystal structures. They made three mutants, replacing phe with trp: F275W and F135W in flexible zones, and F40W in a more rigid zone. In spite of the fact that each of these amino acids is largely buried, none of the mutations, significantly destabilized the folding of FtsZ, and they each complemented the FtsZ null. Another mutant, I294W was not functional but a double mutant I294W/F275A was. They concluded that flexibility in this S9 strand “has a dramatic effect on the functionality of the protein.” This study did not look for fluorescence changes upon assembly.
The formation of a disulfide bond bridging the N- and C-terminal subdomains in the mutant S154C/Y222C completely blocked assembly and GTP hydrolysis. The disulfide did not form spontaneously upon air oxidation, but required catalysis by copper sulfate. This suggests that in the relaxed subunit the thiols were not optimally positioned to make the disulfide. The copper catalysis may have forced the FtsZ into a strained conformation that inactivated it. The movements to achieve this should be small, and importantly they should not have affected the top and bottom surfaces, which form the protofilament interface. This is additional evidence that it is not just these interfaces that are needed for assembly, but conformational flexibility within the subunit is also important.
Protofilaments of tubulin and FtsZ have two distinct conformations – straight and highly curved (30). For tubulin there are high resolution structures of the straight conformation from EM crystallography of Zn sheets (34), and of a curved conformation in a crystal structure of a tubulin-stathmin complex (35). The curved conformation is produced partly by a bend between subunits, but there is also an intra-subunit conformational change between the straight and curved protofilaments. Specifically there is a tilt of 8 or 11 degrees (for the α and β tubulins) between the N- and C-terminal subdomains (the latter is termed the intermediate domain for tubulin) (16). Crystals of γ tubulin showed a tilt of the two subdomains similar to that of the curved conformation of β tubulin (36, 37). Bacterial tubulin BtubA/B also showed a tilt of the subdomains equivalent to the curved conformation of tubulin-stathmin (38). Importantly, about a dozen crystal structures of FtsZ, from different species and with different nucleotide content, all show a subdomain tilt equivalent to the curved conformation (15).
Our data provide new evidence that the relaxed conformation of FtsZ monomers is the same as that in curved protofilaments. In contrast to the substantial changes in fluorescence produced with four different trp mutants when assembled into straight protofilaments, none of these mutants showed any detectable change in fluorescence when assembled with GDP into the curved conformation in DEAE dextran tubes. We should note that there is a second curved conformation that produces toroids ~200 nm in diameter. This “intermediate curved conformation” has been discussed elsewhere (1). The curved conformation that we are discussing here is the one that makes the mini rings and DEAE dextran tubes, which are 24 nm in diameter (29). These appear to be structural homologs of tubulin rings.
It has been proposed that a change from a low to high affinity conformation might generate the apparent cooperativity of protofilament assembly (9–12). The conformational changes that we have documented here may be induced primarily by small movements of nearby side chains, and they accompany the 8–11 degree rotation of the subdomains that occurs in straight protofilaments of tubulin. L189W, which is sandwiched between the two subdomains, should be especially sensitive to this rotation, and indeed it showed a very large change in fluorescence upon assembly. It is still not clear, however, how these small movements in side chains, or even the larger rotation of the subdomains, might translate into a high affinity conformation that would generate apparent cooperativity. Structural evidence or suggestions at the level of specific side chains are still needed to advance this theory.
Acknowledgments
Supported by NIH grant GM66014 to HPE.
Abbreviations and Textual Footnotes
- FRET
fluorescence resonance energy transfer
- EM
electron microscopy
- DEAE-dextran
Diethylaminoethyl-dextran
- trp
tryptophan
- BODIPYaem
BODIPY FL N-(2-aminoethyl)maleimide
References
- 1.Erickson HP, Anderson DE, Osawa M. FtsZ in Bacterial Cytokinesis: Cytoskeleton and Force Generator All in One. Microbiol Mol Biol Rev. 2010;74:504–528. doi: 10.1128/MMBR.00021-10. [DOI] [PMC free article] [PubMed] [Google Scholar]
- 2.Erickson HP, Taylor DW, Taylor KA, Bramhill D. Bacterial cell division protein FtsZ assembles into protofilament sheets and minirings, structural homologs of tubulin polymers. Proc Natl Acad Sci U S A. 1996;93:519–523. doi: 10.1073/pnas.93.1.519. [DOI] [PMC free article] [PubMed] [Google Scholar]
- 3.Löwe J, Amos LA. Tubulin-like protofilaments in Ca2+-induced FtsZ sheets. The EMBO journal. 1999;18:2364–2371. doi: 10.1093/emboj/18.9.2364. [DOI] [PMC free article] [PubMed] [Google Scholar]
- 4.Romberg L, Simon M, Erickson HP. Polymerization of FtsZ, a bacterial homolog of tubulin. Is assembly cooperative? J Biol Chem. 2001;276:11743–11753. doi: 10.1074/jbc.M009033200. [DOI] [PubMed] [Google Scholar]
- 5.Chen Y, Bjornson K, Redick SD, Erickson HP. A rapid fluorescence assay for FtsZ assembly indicates cooperative assembly with a dimer nucleus. Biophysical journal. 2005;88:505–514. doi: 10.1529/biophysj.104.044149. [DOI] [PMC free article] [PubMed] [Google Scholar]
- 6.Huecas S, Llorca O, Boskovic J, Martin-Benito J, Valpuesta JM, Andreu JM. Energetics and geometry of FtsZ polymers: nucleated self-assembly of single protofilaments. Biophysical journal. 2008;94:1796–1806. doi: 10.1529/biophysj.107.115493. [DOI] [PMC free article] [PubMed] [Google Scholar]
- 7.Chen Y, Erickson HP. Rapid in vitro assembly dynamics and subunit turnover of FtsZ demonstrated by fluorescence resonance energy transfer. J Biol Chem. 2005;280:22549–22554. doi: 10.1074/jbc.M500895200. [DOI] [PMC free article] [PubMed] [Google Scholar]
- 8.Erickson HP. Cooperativity in protein-protein association: the structure and stability of the actin filament. J Mol Biol. 1989;206:465–474. doi: 10.1016/0022-2836(89)90494-4. [DOI] [PubMed] [Google Scholar]
- 9.Huecas S, Schaffner-Barbero C, Garcia W, Yebenes H, Palacios JM, Diaz JF, Menendez M, Andreu JM. The Interactions of Cell Division Protein FtsZ with Guanine Nucleotides. J Biol Chem. 2007;282:37515–37528. doi: 10.1074/jbc.M706399200. [DOI] [PubMed] [Google Scholar]
- 10.Dajkovic A, Lan G, Sun SX, Wirtz D, Lutkenhaus J. MinC spatially controls bacterial cytokinesis by antagonizing the scaffolding function of FtsZ. Curr Biol. 2008;18:235–244. doi: 10.1016/j.cub.2008.01.042. [DOI] [PubMed] [Google Scholar]
- 11.Lan G, Dajkovic A, Wirtz D, Sun SX. Polymerization and bundling kinetics of FtsZ filaments. Biophysical journal. 2008;95:4045–4056. doi: 10.1529/biophysj.108.132837. [DOI] [PMC free article] [PubMed] [Google Scholar]
- 12.Miraldi ER, Thomas PJ, Romberg L. Allosteric models for cooperative polymerization of linear polymers. Biophysical journal. 2008;95:2470–2486. doi: 10.1529/biophysj.107.126219. [DOI] [PMC free article] [PubMed] [Google Scholar]
- 13.Oliva MA, Cordell SC, Lowe J. Structural insights into FtsZ protofilament formation. Nat Struct Mol Biol. 2004;11:1243–1250. doi: 10.1038/nsmb855. [DOI] [PubMed] [Google Scholar]
- 14.Osawa M, Erickson HP. Probing the domain structure of FtsZ by random truncation and insertion of GFP. Microbiology (Reading, England) 2005;151:4033–4043. doi: 10.1099/mic.0.28219-0. [DOI] [PubMed] [Google Scholar]
- 15.Oliva MA, Trambaiolo D, Lowe J. Structural insights into the conformational variability of FtsZ. J Mol Biol. 2007;373:1229–1242. doi: 10.1016/j.jmb.2007.08.056. [DOI] [PubMed] [Google Scholar]
- 16.Ravelli RB, Gigant B, Curmi PA, Jourdain I, Lachkar S, Sobel A, Knossow M. Insight into tubulin regulation from a complex with colchicine and a stathmin-like domain. Nature. 2004;428:198–202. doi: 10.1038/nature02393. [DOI] [PubMed] [Google Scholar]
- 17.Martin-Galiano AJ, Buey RM, Cabezas M, Andreu JM. Mapping flexibility and the assembly switch of cell division protein FtsZ by computational and mutational approaches. J Biol Chem. 2010;285:22554–22565. doi: 10.1074/jbc.M110.117127. [DOI] [PMC free article] [PubMed] [Google Scholar]
- 18.Lu C, Stricker J, Erickson HP. FtsZ from Escherichia coli, Azotobacter vinelandii, and Thermotoga maritima - quantitation, GTP hydrolysis, and assembly. Cell Motil Cytoskel. 1998;40:71–86. doi: 10.1002/(SICI)1097-0169(1998)40:1<71::AID-CM7>3.0.CO;2-I. [DOI] [PubMed] [Google Scholar]
- 19.Ingerman E, Nunnari J. A continuous, regenerative coupled GTPase assay for dynamin-related proteins. Methods Enzymol. 2005;404:611–619. doi: 10.1016/S0076-6879(05)04053-X. [DOI] [PubMed] [Google Scholar]
- 20.Doose S, Neuweiler H, Sauer M. Fluorescence quenching by photoinduced electron transfer: a reporter for conformational dynamics of macromolecules. Chemphyschem. 2009;10:1389–1398. doi: 10.1002/cphc.200900238. [DOI] [PubMed] [Google Scholar]
- 21.Mansoor SE, Dewitt MA, Farrens DL. Distance mapping in proteins using fluorescence spectroscopy: the tryptophan-induced quenching (TrIQ) method. Biochemistry. 2010;49:9722–9731. doi: 10.1021/bi100907m. [DOI] [PMC free article] [PubMed] [Google Scholar]
- 22.Mukherjee A, Dai K, Lutkenhaus J. Escherichia coli cell division protein FtsZ is a guanine nucleotide binding protein. Proc Natl Acad Sci U S A. 1993;90:1053–1057. doi: 10.1073/pnas.90.3.1053. [DOI] [PMC free article] [PubMed] [Google Scholar]
- 23.Mukherjee A, Lutkenhaus J. Dynamic assembly of FtsZ regulated by GTP hydrolysis. The EMBO journal. 1998;17:462–469. doi: 10.1093/emboj/17.2.462. [DOI] [PMC free article] [PubMed] [Google Scholar]
- 24.Gonzalez JM, Jimenez M, Velez M, Mingorance J, Andreu JM, Vicente M, Rivas G. Essential cell division protein FtsZ assembles into one monomer-thick ribbons under conditions resembling the crowded intracellular environment. J Biol Chem. 2003;278:37664–37671. doi: 10.1074/jbc.M305230200. [DOI] [PubMed] [Google Scholar]
- 25.Chen Y, Erickson HP. FtsZ filament dynamics at steady state: subunit exchange with and without nucleotide hydrolysis. Biochemistry. 2009;48:6664–6673. doi: 10.1021/bi8022653. [DOI] [PMC free article] [PubMed] [Google Scholar]
- 26.Chen Y, Anderson DE, Rajagopalan M, Erickson HP. Assembly dynamics of Mycobacterium tuberculosis FtsZ. J Biol Chem. 2007;282:27736–27743. doi: 10.1074/jbc.M703788200. [DOI] [PMC free article] [PubMed] [Google Scholar]
- 27.Diaz JF, Kralicek A, Mingorance J, Palacios JM, Vicente M, Andreu JM. Activation of Cell Division Protein FtsZ. Control of switch loop T3 conformation by the nucleotide gamma-phosphate. J Biol Chem. 2001;276:17307–17315. doi: 10.1074/jbc.M010920200. [DOI] [PubMed] [Google Scholar]
- 28.Eftink MR, Ghiron CA. Exposure of tryptophanyl residues in proteins. Quantitative determination by fluorescence quenching studies. Biochemistry. 1976;15:672–680. doi: 10.1021/bi00648a035. [DOI] [PubMed] [Google Scholar]
- 29.Lu C, Reedy M, Erickson HP. Straight and curved conformations of FtsZ are regulated by GTP hydrolysis. J Bacteriol. 2000;182:164–170. doi: 10.1128/jb.182.1.164-170.2000. [DOI] [PMC free article] [PubMed] [Google Scholar]
- 30.Erickson HP, Stoffler D. Protofilaments and rings, two conformations of the tubulin family conserved from bacterial FtsZ to alpha/beta and gamma tubulin. Journal of Cell Biology. 1996;135:5–8. doi: 10.1083/jcb.135.1.5. [DOI] [PMC free article] [PubMed] [Google Scholar]
- 31.Schreiber G, Fersht AR. Interaction of barnase with its polypeptide inhibitor barstar studied by protein engineering. Biochemistry. 1993;32:5145–5150. doi: 10.1021/bi00070a025. [DOI] [PubMed] [Google Scholar]
- 32.Chen Y, Barkley MD. Toward understanding tryptophan fluorescence in proteins. Biochemistry. 1998;37:9976–9982. doi: 10.1021/bi980274n. [DOI] [PubMed] [Google Scholar]
- 33.Diaz-Espinoza R, Garces AP, Arbildua JJ, Montecinos F, Brunet JE, Lagos R, Monasterio O. Domain folding and flexibility of Escherichia coli FtsZ determined by tryptophan site-directed mutagenesis. Protein Sci. 2007;16:1543–1556. doi: 10.1110/ps.072807607. [DOI] [PMC free article] [PubMed] [Google Scholar]
- 34.Nogales E, Wolf SG, Downing KH. Structure of the αβ tubulin dimer by electron crystallography. Nature. 1998;391:199–203. doi: 10.1038/34465. [DOI] [PubMed] [Google Scholar]
- 35.Gigant B, Curmi PA, Martin-Barbey C, Charbaut E, Lachkar S, Lebeau L, Siavoshian S, Sobel A, Knossow M. The 4 A X-ray structure of a tubulin:stathmin-like domain complex. Cell. 2000;102:809–816. doi: 10.1016/s0092-8674(00)00069-6. [DOI] [PubMed] [Google Scholar]
- 36.Aldaz H, Rice LM, Stearns T, Agard DA. Insights into microtubule nucleation from the crystal structure of human gamma-tubulin. Nature. 2005;435:523–527. doi: 10.1038/nature03586. [DOI] [PubMed] [Google Scholar]
- 37.Rice LM, Montabana EA, Agard DA. The lattice as allosteric effector: structural studies of alphabeta- and gamma-tubulin clarify the role of GTP in microtubule assembly. Proc Natl Acad Sci U S A. 2008;105:5378–5383. doi: 10.1073/pnas.0801155105. [DOI] [PMC free article] [PubMed] [Google Scholar]
- 38.Schlieper D, Oliva MA, Andreu JM, Lowe J. Structure of bacterial tubulin BtubA/B: Evidence for horizontal gene transfer. Proc Natl Acad Sci U S A. 2005 doi: 10.1073/pnas.0502859102. [DOI] [PMC free article] [PubMed] [Google Scholar]
- 39.Cordell SC, Robinson EJ, Lowe J. Crystal structure of the SOS cell division inhibitor SulA and in complex with FtsZ. Proc Natl Acad Sci U S A. 2003;100:7889–7894. doi: 10.1073/pnas.1330742100. [DOI] [PMC free article] [PubMed] [Google Scholar]


