Abstract
Analysis procedures are needed to extract useful information from the large amount of gene expression data that is becoming available. This work describes a set of analytical tools and their application to yeast cell cycle data. The components of our approach are (1) a similarity measure that reduces the number of false positives, (2) a new clustering algorithm designed specifically for grouping gene expression patterns, and (3) an interactive graphical cluster analysis tool that allows user feedback and validation. We use the clusters generated by our algorithm to summarize genome-wide expression and to initiate supervised clustering of genes into biologically meaningful groups.
The advent of oligonucleotide arrays and cDNA microarrays (Fodor et al. 1993; Schena et al. 1995; Lockhart et al. 1996) has enabled biologists to measure the expression levels of thousands of genes in parallel. These technologies have raised many exciting questions in experimental design and data analysis. One type of experiment involves monitoring gene expression while a cell undergoes some biological process. The yeast Saccharomyces cerevisiae makes an excellent organism for this type of experiment because its genome has been sequenced and all of the ORFs have been determined. Some of the processes in yeast that have recently been explored are the diauxic shift (DeRisi et al. 1997), sporulation (Chu et al. 1998) and the cell cycle (Cho et al. 1998; Spellman et al. 1998). Each study determines the expression level of every ORF at a series of time points. The resulting data set must be analyzed to determine the roles of specific genes in the process of interest.
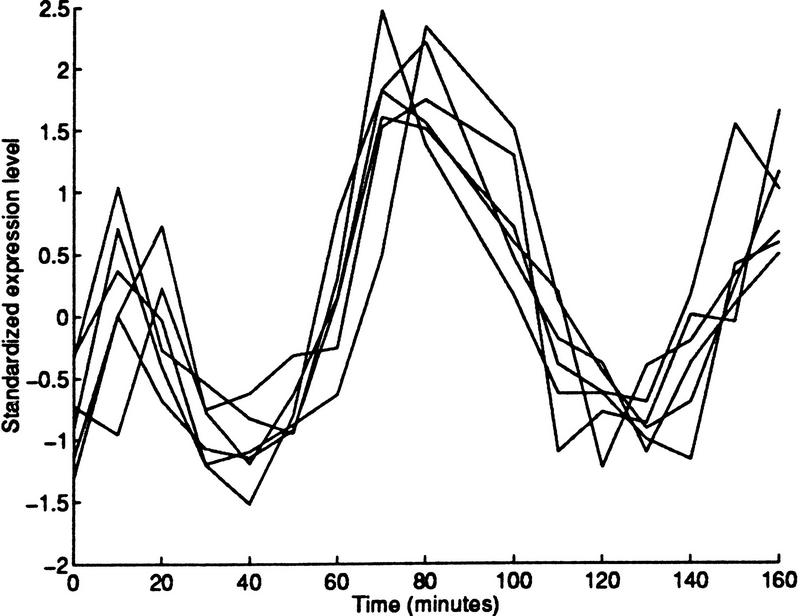
Once the expression levels have been determined by experimental means, it is important to find genes with similar expression patterns (coexpressed genes). There are two reasons for interest in coexpressed genes. First, there is evidence that many functionally related genes are coexpressed (Eisen et al. 1998; Spellman et al. 1998). For example, genes coding for elements of a protein complex are likely to have similar expression patterns. Figure 1 illustrates one such case. Hence, grouping ORFs with similar expression levels can reveal the function of previously uncharacterized genes. The second reason for interest in coexpressed genes is that coexpression may reveal much about the genes' regulatory systems. For example, if a single regulatory system controls two genes, then we might expect the genes to be coexpressed. In general, there is likely to be a relationship between coexpression and coregulation. In this work, we present a systematic analysis procedure to identify, group, and analyze coexpressed genes. The procedure is applied to the seventeen time-point mitotic cell cycle data (Cho et al. 1998) available at http://genomics.stanford.edu/yeast/cellcycle.html.
Figure 1.
Expression levels of the six members of the MCM protein complex: MCM2, MCM3, MCM6, CDC46, CDC47, and CDC54. The data have been standardized by subtracting the mean and dividing by the standard deviation.
Processing the Data
A brief description of the cell cycle experiment is necessary to understand the data set. The detailed experimental protocol is given in the original work (Cho et al. 1998). Cells in a yeast culture were synchronized, and culture samples were taken at 10-min intervals until 17 observations were obtained. This corresponds to the yeast undergoing approximately two cell cycles. The mRNA was isolated from each of the samples, converted to cDNA, and fluorescently labeled.
Arrays, containing oligonucleotides (oligos) complementary to each of the yeast ORFs, were then used to assess the quantity of various transcripts. This was done by allowing the fluorescently labeled cDNA to hybridize to the oligos on the arrays and then measuring the intensity of fluorescent marks. Studies (Wodicka et al. 1997) show that the transcription level of a specific gene is roughly proportional to the intensity of the fluorescent signal left on the complementary spot of the oligo array. The intensities are scaled in an attempt to account for the differences in hybridization properties of arrays used in the experiment. It is these scaled intensities that are reported in Cho et al. (1998) as the expression levels of the ORFs at the seventeen time points.
Prior to initiating any analysis, we removed the data corresponding to control sequences that were placed on each array for calibration purposes. In addition, we removed data corresponding to ORFs annotated to reflect the fact that there was a problem with probe design that could lead to cross-hybridization, loss of signal, or reduced accuracy. At this stage, 5914 ORFs remained from the original 6218. Another filtering step was the removal of the column of data corresponding to the 90-min time point, after correspondence with a coauthor (M. Campbell, pers. comm.) of the cell cycle study revealed that the data for this time point may not be dependable.
A final filtering step was the removal of the ORFs that were either expressed at very low levels or did not vary significantly across the time points. There is no meaningful way to group these ORFs. Some of them may not be genes, but rather, random sequences that begin with a start codon and end with a stop codon; the expression values of these ORFs simply reflect background hybridization. Others may be genes with such low expression level that they cannot be distinguished from the background level, or constitutively expressed genes. The ORFs whose expression values across the time points had mean or variance in the lower 25% of the data were removed by this filtering step. The threshold was chosen after viewing plots of expression levels of individual ORFs, and examining the distributions of mean and variance of expression values for the entire data set. Analogous filtering schemes include accepting only those ORFs that show at least an n-fold change in expression level throughout the time horizon (Tamayo et al. 1999). At the conclusion of the filtering stage, expression values of 4169 ORFs at 16 time points remained.
The filtering procedure is justified by the fact that the value at any time point only roughly reflects the true expression level, that is, the quantity of mRNA present. Variability is inherent in the hybridization, the image processing, and the proportionality between fluorescence signal and mRNA level. However, deleting data can result in the loss of much valuable information. Therefore, we chose a filtering procedure that rejects many unreliable and uninformative data points, while accepting the majority of ORFs. Once more is known about the variation of expression measurements, it will be possible to design filters that distinguish actual changes in expression level from background noise and measurement error. In the absence of such information, several different filters should be attempted and subjective filtering parameters should be chosen on the basis of the specific data set.
Once the data set has been filtered, we find that it is useful to scale the expression level of each gene to have mean zero and variance one. This captures the notion that the expression patterns of two genes may be similar in shape, even though one is expressed at a much higher level than the other. We will refer to a data set that has been scaled in this manner as the standardized data.
Many of the ORFs that pass through the filter are yeast genes. Because this is not always the case, we will use the general term ORF, unless we are discussing a characterized gene.
Expression Similarity
After the data set has been filtered, the ORFs with similar expression patterns (i.e., patterns that rise and fall concordantly) must be determined. The first step is to select a pairwise measure of coexpression. The measure should assign high scores to coexpressed ORFs and low scores to ORFs with unrelated expression patterns. Possible measures include correlation, rank correlation, Euclidean distance, and the angle between vectors of observations.
In gauging the performance of a measure, one might consider taking gene pairs that are known to be coregulated or functionally related, and computing the score of each pair. These scores could then be compared with the scores of unrelated gene pairs. The measure that gives high scores only to related genes would be chosen. Unfortunately, none of the measures mentioned above consistently give high scores only to related gene pairs. In fact, not all related genes are coexpressed, and some unrelated genes have similar expression patterns. Because there is a connection between coexpression and functional relation, coexpressed genes provide excellent candidates for further study. However, the connection is complex, and it cannot be used to identify the best choice of similarity measure. An alternate way to select a measure is needed.
One intuitive method for selecting a measure is to plot the expression data for many ORF pairs and determine whether the plots that look similar are scoring well. With this method we are measuring coexpression directly without any assumptions concerning gene function or regulation. It turns out that this simple heuristic does well in rating the measures, and suggests improved measures that have not been considered previously.
We found that most measures scored curves with similar expression patterns well, but often gave high scores to dissimilar curves. We will refer to a pair that is dissimilar, but receives a high score from the similarity measure, as a false positive. The correlation coefficient performed better than the other measures, but still resulted in many false positives. The intuition behind using correlation as a measure is as follows. If the expression level of an ORF at each time point is viewed as a coordinate, then the standardized expression level of each ORF at all t time points describes a point in t dimensional space, and the Euclidean distance between any two points in this space can be computed. It can be shown that the two points for which the distance is minimized are precisely the points that have the highest correlation. In other words, highly correlated ORF pairs are close. We note that simply using Euclidean distance without standardizing the data is ineffective, because ORF pairs whose expression patterns have the same shape but different magnitudes will not score well.
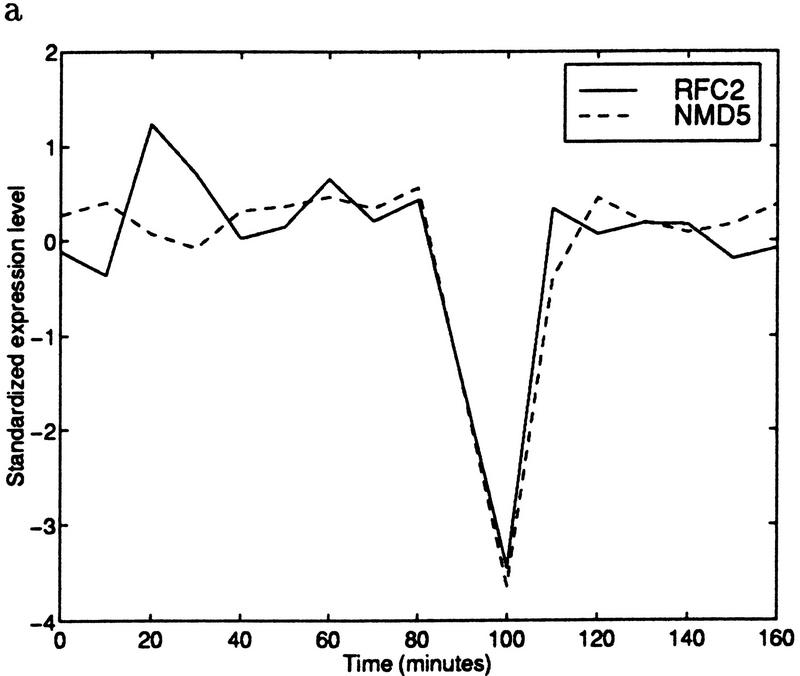
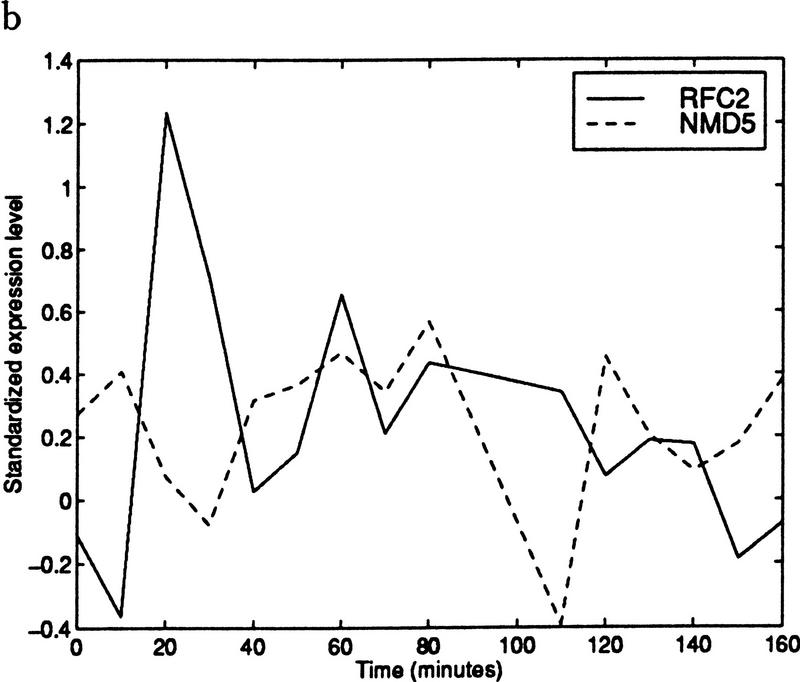
Despite this intuitive reasoning, the issue of false positives needs to be resolved. We found that many of the false positives occurred because of an outlier effect. If the expression levels of two ORFs are completely unrelated at all but one of the time points, and both ORFs have a high peak or valley at the remaining time point, then the correlation coefficient will be very high. For example, Figure 2 shows the expression data of two genes with a very high correlation coefficient when all of the time points are considered. Removing the single outlier from consideration results in a negative correlation. An outlier of this type can occur because of experimental error.
Figure 2.
(a) Standardized expression data for YJR068W (RFC2) and YJR132W (NMD5). The gene pair has a correlation coefficient of 0.87. (b) Standardized expression data for the same two genes with time 100 removed. Using only the remaining points results in a correlation coefficient of −0.29. (Solid line) RFC2; (broken line) NMD5.
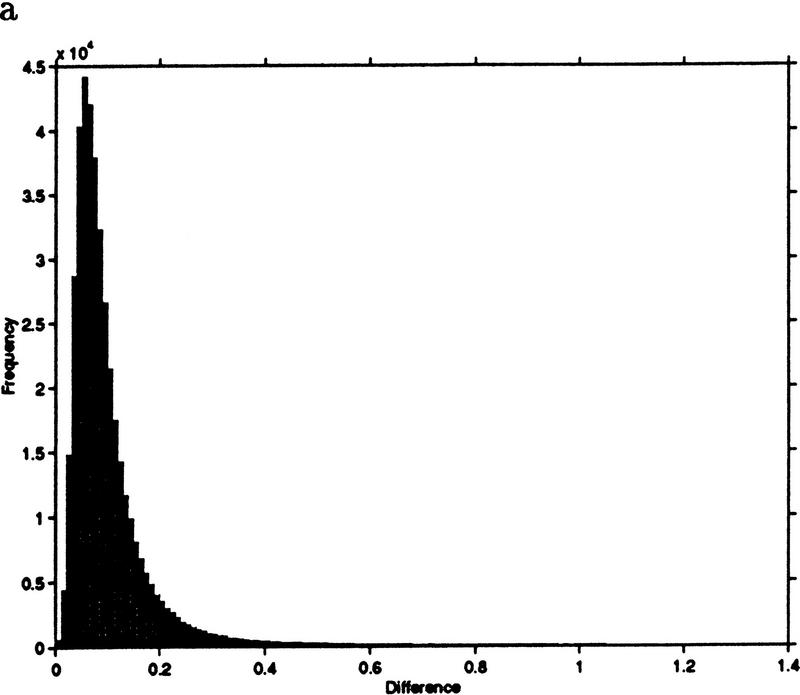
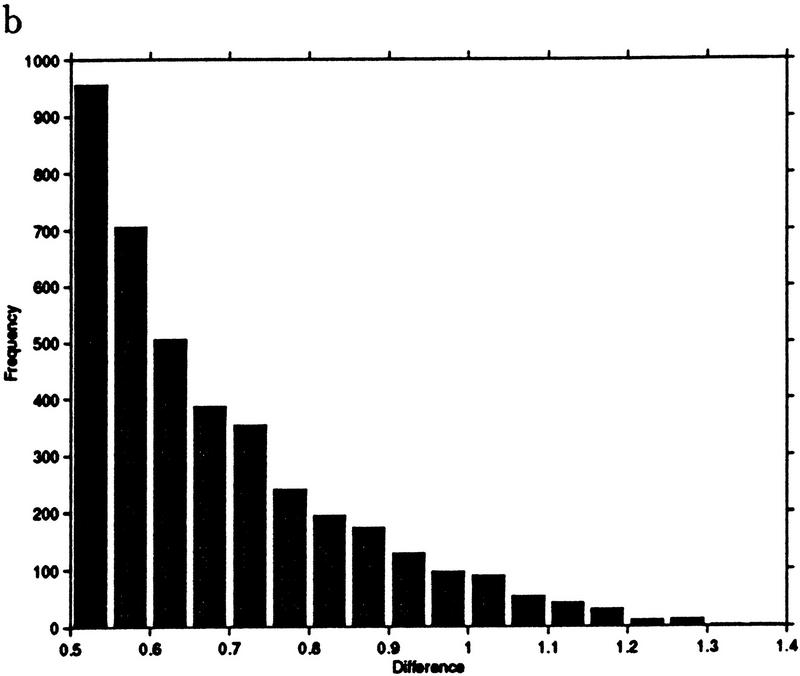
This example leads to a new measure we call jackknife correlation, after the well-known jackknifing procedure in computational statistics (Efron 1982). For an ORF pair i,j, let ρij denote the correlation of the pair i,j; also, let ρ(l)ij denote the correlation of the pair i,j computed with the lth observation deleted. For a data set with t observations, we define the jackknife correlation Jij as Jij = min{ρ(1)ij… ρ(2)ij, … ρ(t)ij, … ρij}. Figure 3 shows the difference between correlation and jackknife correlation for all ORF pairs with a correlation of 0.6 or higher. The difference between the two similarity measures exceeds 0.2 in >8% of the pairs. To show that the measures are not distinguished by a simple shift, we note that the range of differences is between 0 and 1.4.
Figure 3.
(a) Frequency histogram of the difference between correlation and jackknife correlation for gene pairs whose correlation exceeds 0.6. (b) An amplification of the tail of the histogram shown in a.
Jackknife correlation is robust to single outliers. Use of jackknife correlation results in a reduction in false positives, while continuing to give high scores to gene pairs that exhibit similar behavior throughout the time points. More general definitions of jackknife correlation that are robust to n outliers can easily be formulated. However, deleting every subset of size n in performing a generalized jackknife becomes computationally intensive for even small values of n. If data is believed to contain many outliers, alternate methods should be used.
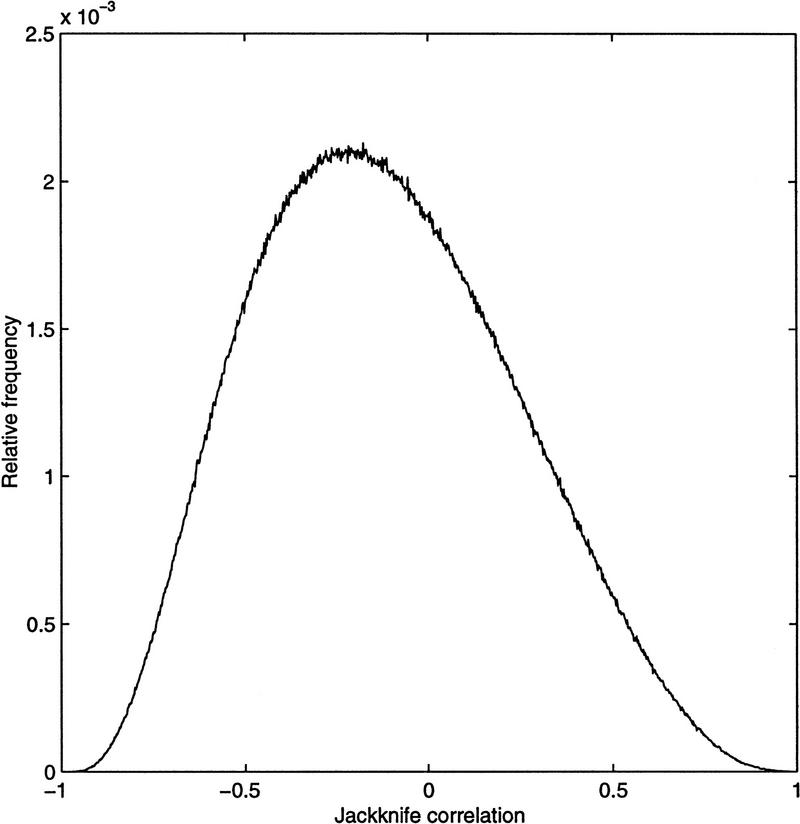
Once a measure has been chosen, the score it gives to any ORF pair needs to be assessed. In theory, the statistical distribution of a measure can be used to obtain the significance of a score. This does not work in practice, because the expression level observations are not independent, and the distributions of the various measures are extremely complicated. Computing the distribution of the jackknife correlation is not practical. Another possible method for determining a significance level is to plot the histogram of all pairwise scores and decide whether an obvious cut off exists. However, as seen in Figure 4, the histogram of jackknife correlation scores does not reveal a clear threshold value. To answer the question of assessing significance, we examined the expression patterns of ORF pairs with various jackknife correlation values. Similar expression patterns generally had a score of 0.7 or higher. We used this value as a rough guide in the clustering procedure discussed in the next section.
Figure 4.
Relative frequency histogram of jackknife correlation values. All 8,688,196 pairwise scores are represented. The number of pairs in each bin is normalized by this total.
Grouping Similar ORFs
Once a similarity score between each pair of ORFs has been computed, this set of scores can be used as a basis for grouping the ORFs into clusters. However, prior to performing any cluster analysis, the following questions need to be answered. First, what information do we expect to obtain by clustering all of the ORFs? Second, what properties should the clusters have?
A common answer to the first question is that clusters will contain functionally related genes. Several studies support this notion by noting that some genes known to have similar functions were grouped together (Eisen et al. 1998; Spellman et al. 1998). However, it is easy to find examples of functionally related genes that are not coexpressed, as well as genes of unrelated function with similar expression patterns. Examples of the former may include genes involved in DNA repair that respond to different types of damage, whereas the latter case can occur either by chance or because the gene products are needed at the same phase of the cell cycle.
Another reason for clustering ORFs is that regulatory systems may be revealed. Expression data has been used recently to explore regulatory networks and to find transcription factor binding sites (Tavazoie et al. 1999). ORFs that are coexpressed throughout a variety of conditions may be genes that are regulated by a common regulatory system. Alternatively, two similar regulatory systems may be at work. Additional study of the genes in question, including their chromosomal locations and their promoter regions, may reveal the true answer. The point is that the clusters do not reveal the final answers. Rather, they are an exploratory tool that is meant to identify candidate genes for further study.
The motivation for clustering underlies the answer to our second question. Both functional relation and coregulation are transitive properties; if gene x is related to gene y, and gene y is related to gene z, then x and z should be related. To reflect transitivity, all members within a cluster should be coexpressed with all other members. In other words, the cluster should have a quality guarantee. The quality of a cluster C can be quantified by its diameter, defined as 1–mini,j∈C{sij}, in which s is the similarity measure being used, and i,j are ORFs in cluster C. Alternatively, the quality can be assessed subjectively by plotting the standardized expression patterns.
There is much literature available on cluster analysis, and good surveys can be found (Hartigan 1975; Kaufman and Rousseeuw 1990; Theodoridis and Koutroumbas 1999). Many clustering algorithms are available in the statistical package S-PLUS (Venables and Ripley 1997). We briefly outline some of the common methods.
Hierarchical clustering methods are very popular because of their simplicity and fast running times. Applications of hierarchical clustering to expression data are described in several works (Eisen et al. 1998; Wen et al. 1998). Agglomerative hierarchical methods iteratively join the closest elements in the data into a tree structure. Once the tree is constructed, the data can be partitioned into any number of clusters by cutting the tree at the appropriate level. Three common options for hierarchical clustering are single linkage, average linkage, and complete linkage. These options differ in their definition of the distance between two clusters. Single linkage defines the distance between clusters C1 and C2 as the minimum distance over all pairs i,j, where i∈C1 and j∈C2. Average linkage takes the average distance over all pairs, and complete linkage uses the maximum distance over all pairs.
Single linkage often produces large, elongated clusters. Complete linkage finds small, compact clusters that do not exceed some diameter threshold. The threshold value is determined by the level at which the tree is cut. Average linkage is sometimes used as a compromise between the other two options. Several problems are shared by these hierarchical methods. Decisions to join two elements are based only on the distance between those elements, and once elements are joined they cannot be separated. This is a local decision-making scheme that does not consider the data as a whole, and it may lead to mistakes in the overall clustering. In addition, for large data sets, the hierarchical tree is extremely complex, and the choice of location for cutting the tree is unclear.
Other methods include k-means clustering and self-organizing maps. The k-means method (Hartigan 1975) identifies k points that function as cluster centers. Each data point is then assigned to one of these centers in a way that minimizes the sum of the distances between all points and their centers. Improved positions for the cluster centers are sought, and the algorithm iterates. The algorithm converges quickly for good initial choices of the cluster centers. An application of k-means clustering to expression data is provided in Tavazoie et al. (1999). One of the main problems with this method is that the number of clusters, k, must be specified prior to running the algorithm. For our data set, the number of clusters is not known in advance, and the final clustering depends heavily on the choice of k. Furthermore, clusters formed by k- means do not satisfy a quality guarantee.
The method of self-organizing maps (SOM) has been applied recently to expression data (Tamayo et al. 1999). This method is closely related to the k-means procedure (Kohonen 1997). The k clusters resulting from the SOM method correspond to k representative points in a prespecified geometrical configuration, such as a rectangular grid. Data points are mapped onto the grid, and the positions of the representative points are iteratively updated in a manner that eventually places each one at a cluster center. Clusters that are close to each other in the initial arrangement tend to be more similar to each other than those that are further apart. Although this is a useful feature, the SOM method requires the choice of geometry in addition to the choice of k. Other clustering methods, including an interesting two-way clustering approach (Alon et al. 1999), have been applied recently to expression data.
We have developed a clustering algorithm that avoids many of the problems of the above algorithms. Because it was developed with expression data in mind, the method emphasizes the desired properties of ORF clusters. The focus of the algorithm is to find large clusters that have a quality guarantee. Transitivity is ensured by finding clusters whose diameter does not exceed a given threshold value d; thus, any two ORFs in a cluster have a jackknife correlation value that is at least 1–d. The cluster diameter can range from 0 to 2, because jackknife correlation lies in the interval [–1,1].
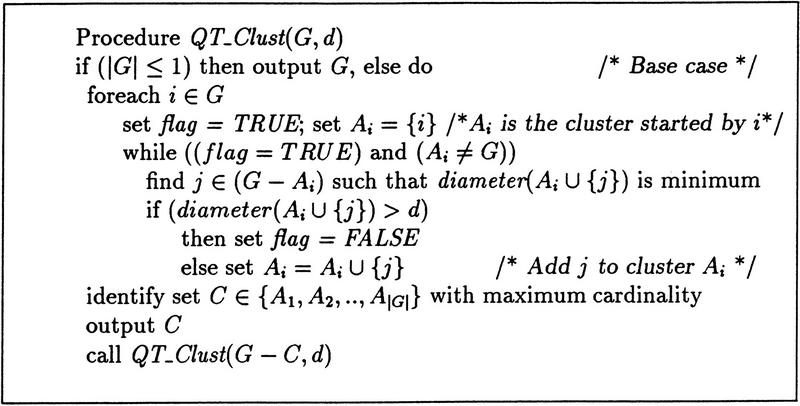
The quality cluster algorithm (QT_Clust) works as follows: a candidate cluster is formed by starting with the first ORF and grouping the ORF that has greatest jackknife correlation with it. Other ORFs are iteratively added. Each iteration adds the ORF that minimizes the increase in cluster diameter. The process continues until no ORF can be added without surpassing the diameter threshold. A second candidate cluster is formed by starting with the second ORF and repeating the procedure. We note that all ORFs are made available to the second candidate cluster. That is, the ORFs from the first candidate cluster are not removed from consideration. The process continues for all ORFs. At the conclusion of this stage, we have a set of candidate clusters. The number of candidate clusters is equal to the number of ORFs, and many candidate clusters overlap. At this point, the largest candidate cluster is selected and retained. The ORFs it contains are removed from consideration and the entire procedure is repeated on the smaller set. A possible termination criterion is to stop when the largest remaining cluster has fewer than some prespecified number of elements. The pseudo-code for the algorithm is given in Figure 5.
Figure 5.
Algorithm QT_Clust takes as input the set G of ORFs and a diameter threshold d, and returns a set of clusters.
Use of the candidate clusters in this manner eliminates a bias associated with forming clusters one at a time. Some of the elements that are incorporated into a cluster in the beginning of the algorithm may be more suited for a cluster that is formed in a later stage. Because our aim is to find large clusters that satisfy a quality guarantee, we allow each ORF to initiate a candidate cluster, and then we select the largest cluster formed. This implies that the algorithm is not sensitive to the order in which the similarity data appear.
We used a straightforward implementation of QT_Clust to partition the 4169 ORFs into clusters with diameter <0.3. The running time of the algorithm was ∼30 min on a Sparc Ultra, Unix workstation. The threshold value, which corresponds to the 0.7 value of jackknife correlation mentioned earlier was chosen after visually inspecting clusters formed at various thresholds. The resulting clusters gave us a good indication of the type of expression patterns that existed in the data; 24 of the largest ones are shown in Figure 6. We note that the precise threshold value is not important. At this point in our analysis, our goal is to discover the general cluster patterns present in the data so that specific clusters can be analyzed with the interactive approach discussed in the next section.
Figure 6.
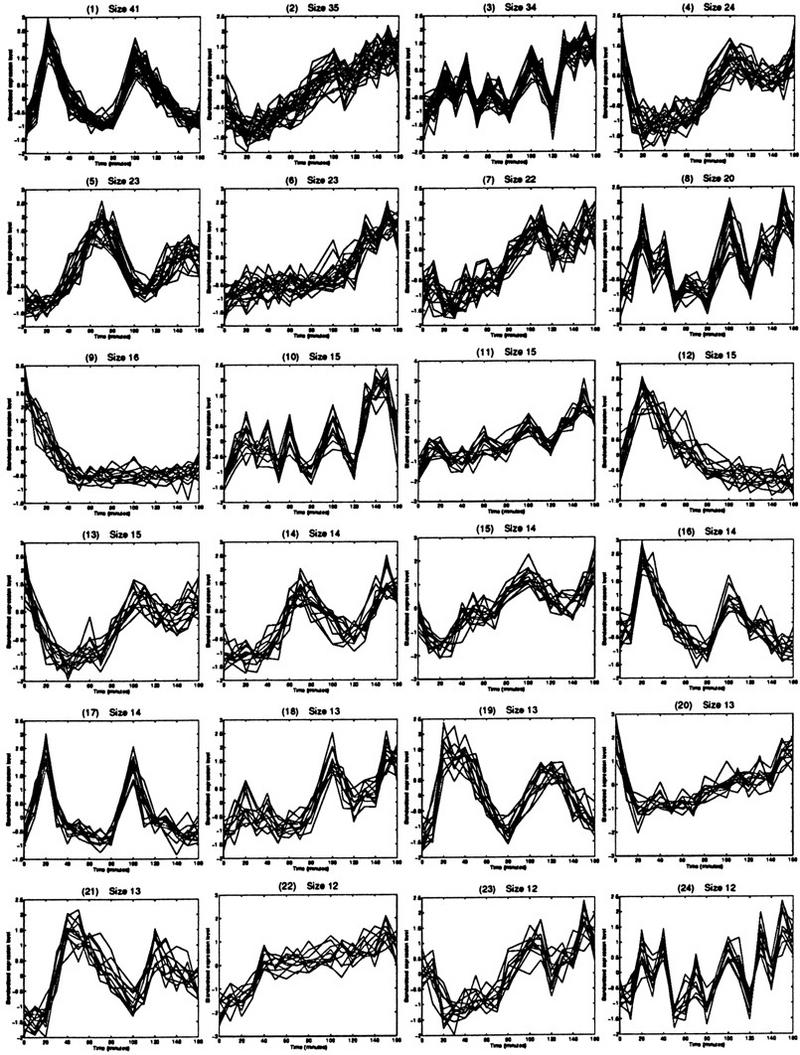
The 24 largest clusters found by QT_Clust. These plots give a good overview of the types of patterns found in the data.
Although the threshold value will affect the cluster number to some extent, this is not a serious problem. The k- means and SOM approach assign every ORF to a cluster. If the prespecified number of clusters is too small, unrelated patterns will be clustered together. If it is too large, clusters with similar patterns will be broken apart. Changing the threshold in QT_Clust may change the number and size of clusters, but each cluster will have the quality guarantee and no unrelated patterns will be forced into a single cluster.
Our algorithm has several advantages over existing procedures. The total number of clusters is not needed at the start of the algorithm, and all of the clusters achieve the quality guarantee discussed above. The algorithm has some resemblance to the complete linkage hierarchical procedure, but the clusters we find at a specified threshold are much larger on average. Further, because each ORF is considered as a potential cluster center, local decisions do not have a large impact on the final clustering. Therefore, we conjecture that our method is less sensitive than hierarchical methods to small perturbations in the data, including the removal of ORFs through filtering.
Analyzing the Clusters
Some valuable information can be gained by examining the general expression patterns revealed by the clustering algorithm. For example, the clusters shown in Figures 6.1 and 6.5 are periodic. Because the time horizon for the experiment spanned two cell cycles, the periodicity can be explained by noting that many of the genes in these clusters are known to be cell cycle regulated. For example, among some of the genes known to peak in late G1 phase that are contained in cluster 6.1, are SWE1, RAD27, CDC21, CDC45, UNG1, and RFA2.
Several other clusters (e.g. Fig. 6.9) show a maximum expression level in the first time point. This behavior is consistent with genes that are transiently affected by cell cycle arrest and synchronization. In the cell cycle experiment, the synchronization was achieved by an increase in temperature, and six members of the heat shock protein (HSP) family appear in this type of cluster. It is important to note that these types of patterns cannot be discovered if the data were subject to a more stringent filter, particularly one that requires periodicity in the expression levels.
Once the general cluster patterns are revealed, we may analyze the specific clusters of interest in more detail. Our clustering algorithm motivates an interactive procedure that begins with a particular expression pattern and builds a cluster centered at this pattern. The pattern may either represent one of the shapes revealed by the original clustering, or it may correspond to a specific gene or gene family of interest.
After a pattern has been selected, it is used as a seed to initiate a cluster. As described in QT_Clust, ORFs are added to the cluster in the order that minimizes the increase in cluster diameter. The order in which the ORFs enter the cluster, and the increase in diameter are recorded. The procedure terminates when a sufficiently high diameter is achieved (e.g., d = 1). To this point, the procedure is equivalent to running QT_Clust for a single ORF at a high diameter threshold value.
Once the procedure terminates, interactive analysis can begin. The original pattern is plotted. Additional patterns are then plotted on the same graph in the order that they entered the cluster. The cluster diameter is reported at each step. The advantage of this supervised approach is that the user chooses the center of the cluster and has interactive control of its size (number of elements) and quality (diameter). We now illustrate two applications of this method.
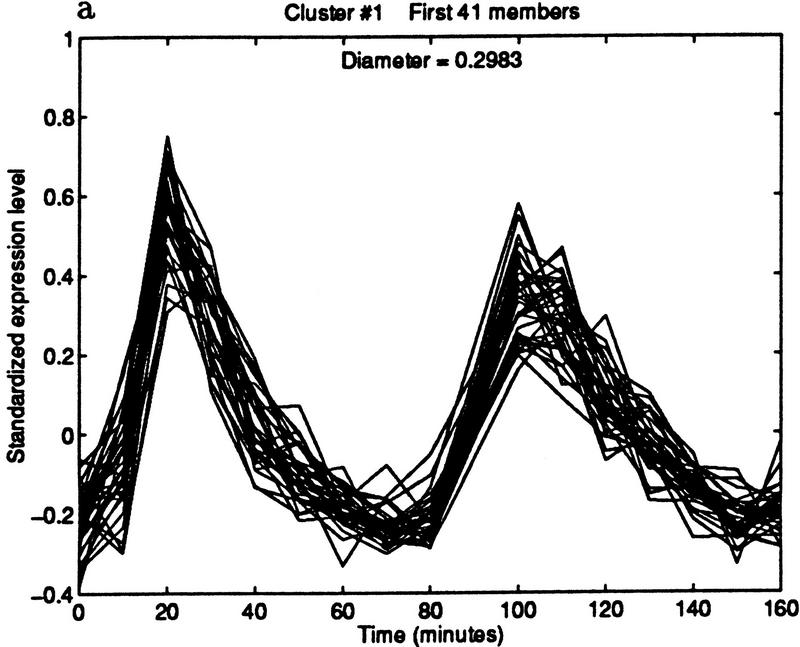
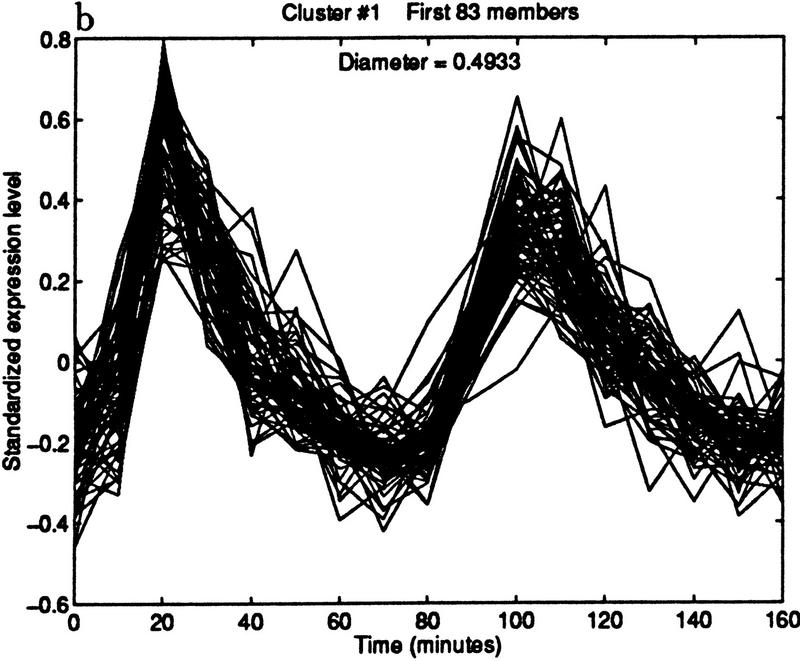
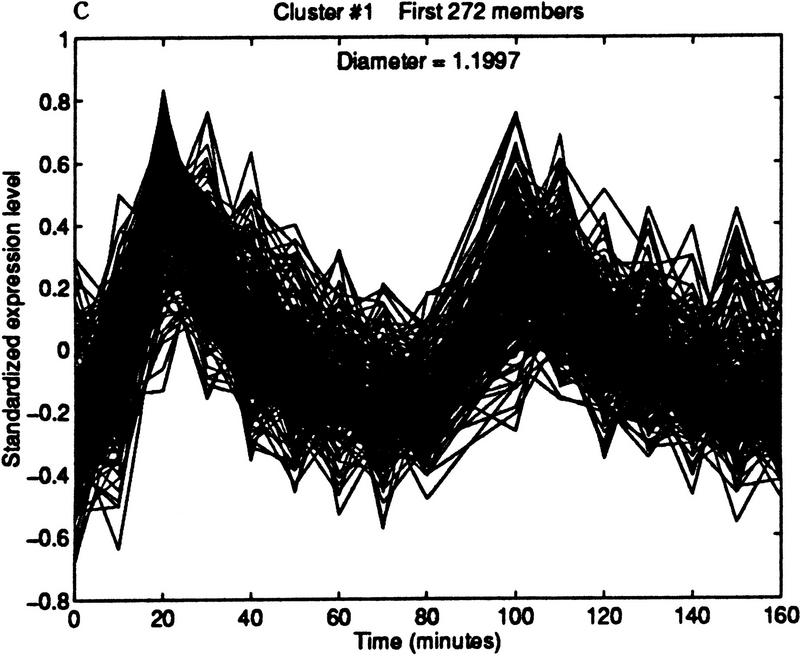
The method can be used to find cell cycle-regulated genes. Specifically, we found candidate ORFs whose expression level peaked in late G1 phase. We began by choosing the representative pattern from the cluster shown in Figure 6.1. The pattern was computed by taking the median expression level of the 41 genes in the cluster at each of the time points. The median was used because it is insensitive to outliers. This technical point may become important if the representative is chosen from a cluster with no quality guarantee; for example, one produced by k-means or SOM. Figure 7 shows three clusterings obtained by varying the diameter. The cluster in Figure 7b contains 83 elements and maintains a high quality.
Figure 7.
Iterative building of G1 cluster. (a) Forty-one elements within a diameter threshold of 0.3. (b) Eighty-three elements within a diameter of 0.5. The cluster is beginning to contain patterns that peak in phases other than G1. (c) By increasing the diameter threshold to 1.2, the cluster grows to 272 elements, but now clearly contains poorly matching patterns.
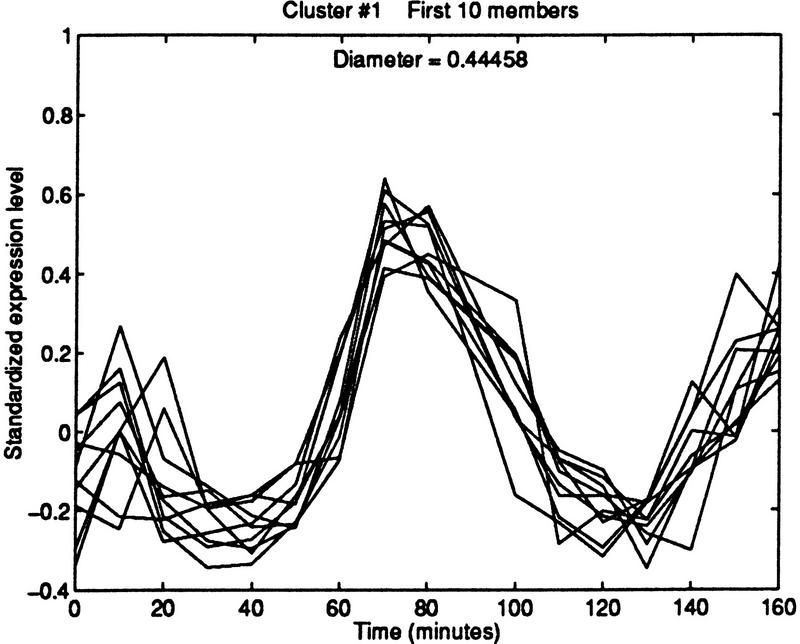
Another application of the interactive approach is to initiate a cluster with a specific gene of interest. This is more effective than clustering all of the ORFs and then choosing the cluster that contains the gene. In addition to the advantages of placing the gene at the center and controlling the cluster size and quality, the supervised approach avoids the uninformative situation in which the gene is put in a very small group, as may occur with global clustering. When plotting the cluster around a gene of interest interactively, possible stopping rules may be based on cluster diameter, cluster size, or fraction of known related genes found. For example, if adding an additional ORF would cause a sharp increase in cluster diameter, then no more ORFs should be added. If a certain number of candidate ORFs are required for some application, then the algorithm can be terminated when the required number of candidates is attained. If the goal is to find genes related to some known gene family, then a possible stopping time is when some high fraction of known genes in the family have been added to the cluster. Figure 8 demonstrates this last approach on the five members of the MCM gene family (the sixth member, MCM6, was removed in the filtering process). By starting with MCM3, a cluster of diameter 0.45 is able to group MCM2, CDC54, and CDC47. Initiating clusters with other members of the family that are near the family average gives comparable results. Here we stopped extending the cluster once most of the known genes in the family were added. The other genes in the cluster may be related to this family.
Figure 8.
Iterative building of MCM cluster. The first 10 members of the cluster include 4 of the 5 members of the MCM family that were available to the clustering procedure.
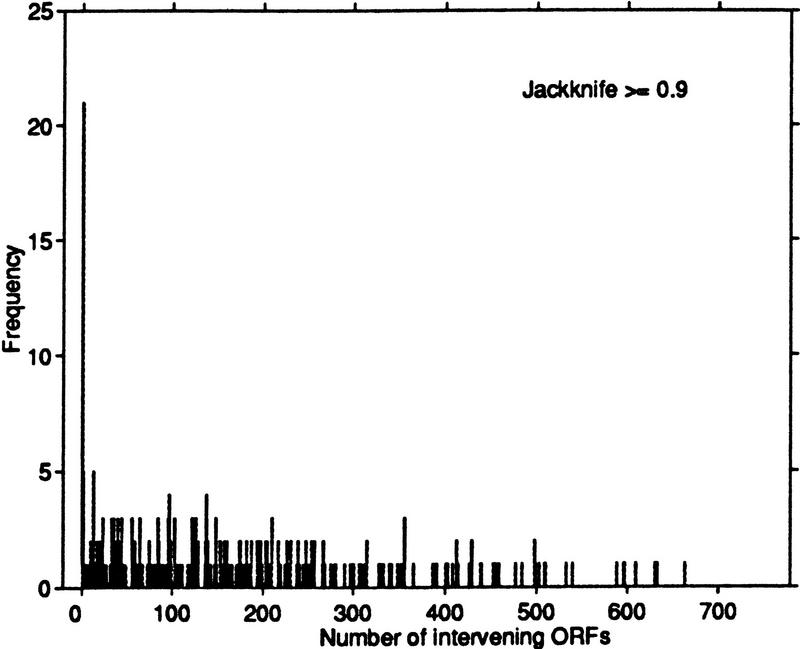
By combining expression data with chromosomal location information, we can use some of our analysis tools to identify potential gene candidates that are controlled by a common regulatory system. To this end, we identified all ORF pairs that had jackknife correlation >0.9. In 325 cases, both members of the pair were located on the same chromosome. In a disproportionate number of these cases, the members of a pair appeared consecutively on the chromosome. In other words, no other ORFs existed in the region between the pair of interest. Figure 9 plots the number of ORF pairs with jackknife correlation >0.9 as a function of the distance between the ORFs in the pair. There is evidence that regulatory systems in yeast are located close to the genes they regulate (Ptashne and Gann 1997), and Cho et al. (1998) conjecture that consecutive genes on opposite strands may be controlled by one regulatory system. However, we note that for many of these highly correlated pairs, the ORFs physically overlap on the chromosome. This observation also points to the need for careful design of probes for ORFs that are known to overlap.
Figure 9.
Histogram of the distance between ORFs with a jackknife correlation of at least 0.9. Distance is measured in terms of the number of intervening ORFs separating the members of the pair. A disproportionate number (21) are consecutive on their respective chromosomes.
Conclusions
In this work we have outlined a systematic analysis procedure for gene expression data sets and applied it to a yeast cell cycle experiment. The four steps involved in the procedure are preprocessing (filtering) the data, choosing a similarity measure, clustering the data, and analyzing the resulting clusters.
Our method differs from related works in several aspects. The jackknife correlation is a new similarity measure; it is insensitive to the outlier effect, and it captures the shape of an expression pattern. As we noted, our new clustering algorithm has several advantages over existing algorithms. Clustering the expression patterns does not conclude our analysis, but rather provides candidates for further study. Throughout the analysis we emphasize interaction and visual inspection of the results. Our analysis methods can be used on the yeast data set to discover more information about gene function and regulation, and they can be applied to data from other gene expression experiments.
Acknowledgments
We thank Michael Waterman and Simon Tavaré for helpful discussions and for providing us with the resources for this project. Earl Hubbell, Leonid Kruglyak, Richard Deonier, Catherine Sugar, and Haixu Tang provided valuable comments and feedback. We also thank Soheil Shams and Peter Kalocsai at BioDiscovery, Inc. for useful discussions, and the referees for their insightful comments and input. We were supported in part by National Science Foundation (NSF) grant BIR 9504393 and National Institutes of Health grant R01 GM36230. L.H. and S.Y. acknowledge support by Fellowships from the Program in Mathematics and Molecular Biology at the Florida State University, with funding from the NSF under Grant No. DMS-9406348.
The publication costs of this article were defrayed in part by payment of page charges. This article must therefore be hereby marked “advertisement” in accordance with 18 USC section 1734 solely to indicate this fact.
Footnotes
E-MAIL kruglyak@hto.usc.edu; FAX (213) 740-2424.
REFERENCES
- Alon U, Barkai N, Notterman D, Gish K, Ybarra S, Mack D, Levine A. Broad patterns of gene expression revealed by clustering analysis of tumor and normal colon tissues probed by oligonucleotide arrays. Proc Natl Acad Sci. 1999;96:6745–6750. doi: 10.1073/pnas.96.12.6745. [DOI] [PMC free article] [PubMed] [Google Scholar]
- Cho R, Campbell M, Winzeler E, Steinmetz L, Conway A, Wodicka L, Wolfsberg T, Gabrielian A, Landsman D, Lockhart D, Davis R. A genome-wide transcriptional analysis of the mitotic cell cycle. Mol Cell. 1998;2:65–73. doi: 10.1016/s1097-2765(00)80114-8. [DOI] [PubMed] [Google Scholar]
- Chu S, DeRisi J, Eisen M, Mulholland J, Botstein D, Brown P, Herskowitz I. The transcriptional program of sporulation in budding yeast. Science. 1998;282:699–705. doi: 10.1126/science.282.5389.699. [DOI] [PubMed] [Google Scholar]
- DeRisi J, Iyer V, Brown P. Exploring the metabolic and genetic control of gene expression on a genome scale. Science. 1997;278:680–686. doi: 10.1126/science.278.5338.680. [DOI] [PubMed] [Google Scholar]
- Efron B. The Jackknife, the Bootstrap, and Other Resampling Plans. CBMS-NSF Regional Conference Series in Applied Mathematics; 38. Society for Industrial & Applied Mathematics; 1982. [Google Scholar]
- Eisen M, Spellman P, Brown P, Botstein D. Cluster analysis and display of genome-wide expression patterns. Proc Natl Acad Sci. 1998;95:14863–14868. doi: 10.1073/pnas.95.25.14863. [DOI] [PMC free article] [PubMed] [Google Scholar]
- Fodor S, Rava R, Huang X, Pease A, Holmes C, Adams C. Multiplexed biochemical assays with biological chips. Nature. 1993;364:555–556. doi: 10.1038/364555a0. [DOI] [PubMed] [Google Scholar]
- Hartigan J. Clustering algorithms. New York, NY: John Wiley & Sons; 1975. [Google Scholar]
- Kaufman L, Rousseeuw P. Finding groups in data: An introduction to cluster analysis. New York, NY: John Wiley & Sons; 1990. [Google Scholar]
- Kohonen T. Self-organizing maps. Berlin, Germany: Springer Verlag; 1997. [Google Scholar]
- Lockhart D, Dong H, Byrne M, Follettie M, Gallo M, Chee M, Mittmann M, Wang C, Kobayashi M, Horton H, Brown E. Expression monitoring by hybridization to high-density oligonucleotide arrays. Nat Biotechnol. 1996;14:1675–1680. doi: 10.1038/nbt1296-1675. [DOI] [PubMed] [Google Scholar]
- Ptashne M, Gann A. Transcriptional activation by recruitment. Nature. 1997;386:569–577. doi: 10.1038/386569a0. [DOI] [PubMed] [Google Scholar]
- Schena M, Shalon D, Davis R, Brown P. Quantitative monitoring of gene expression patterns with a complementary DNA microarray. Science. 1995;270:467–470. doi: 10.1126/science.270.5235.467. [DOI] [PubMed] [Google Scholar]
- Spellman P, Sherlock G, Zhang M, Iyer V, Anders K, Eisen M, Brown P, Botstein D, Futcher B. Comprehensive identification of cell cycle-regulated genes of the yeast Saccharomyces cerevisiae by microarray hybridization. Mol Biol Cell. 1998;9:3273–3297. doi: 10.1091/mbc.9.12.3273. [DOI] [PMC free article] [PubMed] [Google Scholar]
- Tamayo P, Slonim D, Mesirov J, Zhu Q, Kitareewan S, Dmitrovsky E, Lander E, Golub T. Interpreting patterns of gene expression with self-organizing maps: Methods and application to hematopoietic differentiation. Proc Natl Acad Sci. 1999;96:2907–2912. doi: 10.1073/pnas.96.6.2907. [DOI] [PMC free article] [PubMed] [Google Scholar]
- Tavazoie S, Hughes J, Campbell M, Cho R, Church G. Systematic determination of genetic network architecture. Nat Genet. 1999;22:281–285. doi: 10.1038/10343. [DOI] [PubMed] [Google Scholar]
- Theodoridis S, Koutroumbas K. Pattern recognition. New York, NY: Academic Press; 1999. [Google Scholar]
- Venables W, Ripley B. Modern applied statistics with S-PLUS. Berlin, Germany: Springer Verlag; 1997. [Google Scholar]
- Wen X, Fuhrman S, Michaels G S, Carr D B, Smith S, Barker J L, Somogyi R. Large-scale temporal gene expression mapping of central nervous system development. Proc Natl Acad Sci. 1998;95:334–339. doi: 10.1073/pnas.95.1.334. [DOI] [PMC free article] [PubMed] [Google Scholar]
- Wodicka L, Dong H, Mittmann M, Ho M, Lockhart D. Genome-wide expression monitoring in Saccharomyces cerevisiae. Nat Biotechnol. 1997;15:1359–1367. doi: 10.1038/nbt1297-1359. [DOI] [PubMed] [Google Scholar]


