

Abstract
The expressed human genome is being sequenced and analyzed by disparate groups producing disparate data. The majority of the identified coding portion is in the form of expressed sequence tags (ESTs). The need to discover exonic representation and expression forms of full-length cDNAs for each human gene is frustrated by the partial and variable quality nature of this data delivery. A highly redundant human EST data set has been processed into integrated and unified expressed transcript indices that consist of hierarchically organized human transcript consensi reflecting gene expression forms and genetic polymorphism within an index class. The expression index and its intermediate outputs include cleaned transcript sequence, expression, and alignment information and a higher fidelity subset, SANIGENE. The STACK_PACK clustering system has been applied to dbEST release 121598 (GenBank version 110). Sixty-four percent of 1,313,103 Homo sapiens ESTs are condensed into 143,885 tissue level multiple sequence clusters; linking through clone-ID annotations produces 68,701 total assemblies, such that 81% of the original input set is captured in a STACK multiple sequence or linked cluster. Indexing of alignments by substituent EST accession allows browsing of the data structure and its cross-links to UniGene. STACK metaclusters consolidate a greater number of ESTs by a factor of 1.86 with respect to the corresponding UniGene build. Fidelity comparison with genome reference sequence AC004106 demonstrates consensus expression clusters that reflect significantly lower spurious repeat sequence content and capture alternate splicing within a whole body index cluster and three STACK v.2.3 tissue-level clusters. Statistics of a staggered release whole body index build of STACK v.2.0 are presented.
ESTs simultaneously tantalize and frustrate. They offer a rapid and inexpensive route to gene discovery (Adams et al. 1991, 1992; Okubo et al. 1991; Matsubara and Okubo 1993; Vasmatzis et al. 1998), reveal expression and regulation data (Vasmatzis et al. 1998), highlight transcript sequence diversity and splicing (Wolfberg and Landsman 1997), and may identify more than half of known human genes (Hillier et al. 1996). The price of the high-volume and high-throughput nature of the data is that ESTs contain high error rates (Aaronson et al. 1996), do not have a defined protein product, are not curated in a highly annotated form, and present only a raw substrate for sequence matching.
Several systems are being developed to organize and thereby enrich publicly available ESTs, and each has used a novel approach successful in terms of its own goals. Current indices such as TIGR Human Gene Index (http://www.tigr.org) and EST cluster databases such as UniGene (Boguski et al. 1995; Schuler et al. 1996) discard noisy information during their production and rely on longest informative ESTs, significant transcript matches, or joined genomic exons to seed index classes. TIGR Human Gene Index (HGI; http://www.tigr.org) uses the strict assembly method of TIGR_ASSEMBLER (Sutton et al. 1995), tightly grouping highly related sequences and, consequently, producing accurate consensus sequences with a minimum of chimerism or other contamination. The method strictly discards under-represented and divergent or noisy sequences in favor of confidence based on transcript redundancy, but in doing so it generates “short” consensi and may eliminate related sequences that might provide examples of alternative splicing or other valuable forms of sequence diversity (Bouck et al. 1999). A complementary approach, as taken by UniGene (Boguski et al. 1995; Schuler et al. 1996), the Genexpress Index (Houlgatte et al. 1995), and the Merck Gene Index (Williamson et al. 1995), groups sequences into clusters based on sequence overlap above a given alignment threshold, accepting only the longest representative of an index class as its consensus.
The STACK resource is based on extensive development of exhaustive loose clustering, defining index classes by the total number and multiplicity of (possibly discontiguous) matching 6-base words rather than by alignment to previously identified class members. In recognition of the diversity of expression and the possibility of artifactual inclusion and interpretation of ESTs within a cluster, the related but loose clusters are subsequently processed by strict assembly and analysis tools to identify, characterize, view, and isolate sequence divergence. This approach leverages the diversity of the resulting clusters to identify and highlight variation. Given such a tree of relationships within a sequence cluster, primary and subsidiary consensus sequences are generated to maximize detection of related genes, exons, possible paralogs, and expression forms. Elucidation of these relationships is simplified by subconsensus display and also formatting of entries so that they can be assayed in databases via BLAST (Altschul et al. 1990) or other search algorithms. Pairwise comparisons of ESTs in a preclustering step using cross match (http://www.genome.washington.edu/uwgc/analysistools/phrap.htm) reduces redundancy and provides increased fidelity.
Clustering approaches tend to minimize comparisons to achieve speed. A significant difference between STACK_PACK, the system used to produce STACK, and systems preceding it is that clustering has been performed so as to maximize comparisons. Thus, all available ESTs have been compared to each other, and as a result, it has been necessary to use high performance hardware and/or distributed processes. The benefit is that as few sequences as possible have been dropped from each cluster, contributing to the value of each consensus. A degree of security is also obtained in terms of the likelihood that clusters have been carefully assigned.
The exponential growth rate of the experimentally determined sequence databases requires that any effort to cluster related sequences acknowledges the unavoidably dynamic status of the results. Newly determined sequences will join previously unrelated clusters, whereas old sequences may be recognized as contaminated and necessitate the disaggregation and reclustering of an index class. The STACK schema implements both repair and add facilities. Current development is focused on continued dynamic addition of sequences to existing processed data.
To date, EST assemblies have not been joined at the sequence comparison step according to genome hybridization or available full-length mRNA sequence data. However, with the recent increase in production of genome and mRNA information, addition of new ESTs to already clustered data will include genomic and mRNA sequence to anchor clusters.
Development of a Clustering Procedure and Methods
Subpartitioning
Step 1 of the STACK_PACK schema is selection of human ESTs followed by the breakdown of GenBank format sequence data files into “manageable bins” (Table 1). Individual tissue sets are organized according to organ system relationships, then partitioned to maximize sequence groupings while approaching an arbitrary 260,000 input sequence bin target and retaining logical distinctions between groupings. All sequences annotated as derived from a disease-related tissue are duplicated and placed in a single set to facilitate exploration of cross-tissue similarities between these ESTs. Partitioning at an arbitrary tissue level, given available sequence annotations, presents the opportunity to rapidly explore transcript expression in specific “tissues” (Vasmatzis et al. 1998) or subsets such as the disease-related sequences (Burke et al. 1998) while retaining the ability to drill down through whole-body expression by searching and viewing individual tissue-specific consensus sequences against the entire database of indexed STACK consensi (http://www.sanbi.ac.za/webview/). Although identification of source organisms is a trivial task based on the “ORGANISM” key in the GenBank format definition, the “tissue_type” subkey of the “FEATURES” key is only sometimes provided with nonstandardized terms in the data field. As a result, the assignment of an output file name for each sequence is based on (in order of preference) (1) FEATURES/tissue_type, (2) FEATURES/cell_type, (3) FEATURES/clone_lib or SOURCE/library, (4) FEATURES/chromosome, or (5) FEATURES/map. The resulting groups of sequences can be placed directly in the tissue hierarchy of Table 1 by assigned filename alone.
Table 1.
Tissue Divisions Used for STACK
| dbEST 101598 Homo sapiens tissue partitioning | ||
| Arbitrary tissue partitions | Substituent tissues types | Total ESTs |
|---|---|---|
| Adipose | brown, white | 2,376 |
| Brain | frontal lobe, cerebrum, cerebellum, cortex | 177,719 |
| Cochlea | fetal cochlea | 4,304 |
| Connective | bone, skin, synovial membrane | 40,753 |
| Digestive | stomach, colon, gall bladder | 51,032 |
| Disease | duplicates of ESTs annotated as tumors | 114,496 |
| Eye | retina, cornea, ocular | 28,514 |
| Genomic | specified chromosomes | 101,986 |
| Glands | breat, endocrine | 112,346 |
| Heart | fetal heart, aorta | 69,830 |
| Hemato-lymphatic | blood, kidney, liver–spleen | 255,565 |
| Lung | trachea, larynx, lung | 70,259 |
| Muscle | leg, pectoral | 16,237 |
| Olfactory | olfactory epithelium | 2,600 |
| Other | monocytes, mononuclear cells | 25,925 |
| Reproductive | ovary, testis, uterus | 239,161 |
Sequences were partitioned over an arbitrarily defined tissue hierarchy designed to group physically related tissues and remain within constraints of computational resources. Genomic tissue is a set of ESTs labeled only as having a genomic region of hybridization without a tissue source. The set of duplicate copies of all disease-related sequences is loosely referred to as a tissue for this work.
Masking
The clustering procedure is intended to group together those sequences that share identical regions. It is therefore necessary to ensure that ESTs submitted for clustering are free of artifactual sequence identical to the expressed transcripts under study. All input sequences are subjected to masking against human repeat sequences using RepBase (Jurka 1995) common vector sequences (ftp://ncbi.nlm.nih.gov/repository/vector/), potentially contaminant species such as rodent, mitochondrial and ribosomal DNA. Contamination discovered after database production is complete is removed with a repair facility that extracts data related to a specified cluster; the extracted sequences are then reprocessed after updating the relevant mask data. The initial STACK implementation utilized BLASTN and XBLAST (Altschul et al. 1990) for masking, but the somewhat more sensitive crossmatch (Green 1996) is now implemented.
Clustering
d2_cluster (Hide et al. 1994; Burke et al., this issue) is a word-based, greedy clustering algorithm based originally on work by David Torney and others (Torney et al. 1990a,b), written by John Burke, Dan Davison, and Win Hide (this issue) for the MasPar computer and ported by John Carpenter of SGI to the Origin2000. d2_cluster implements a “loose” approach to sequence clustering by identifying and counting matching n-length words (n = 6 for this work), in contrast with the “strict” approach implemented by tools such as TIGR_ASSEMBLER (Sutton et al. 1995) in which clusters are built up based on matching entire sequence fragments. Whereas the strict methodology yields cluster members that are highly related, the loose approach presents the opportunity to detect clusters that are related by rearrangement or alternative splicing. Although the resulting clusters are likely to be more “noisy,” the combination with a verification tool for multiple sequence alignments such as CRAW (Burke et al. 1998) reduces noise and produces networks of highly related sequences for further analysis. Two sequences or their reverse complement fall into the same cluster if they share a 150-base window that has at least 96% identity. Sequences <50 bases in length are excluded from clustering. The output of d2_cluster is a list of sequences.
Assembly
For all releases subsequent to STACK v.1.0, PHRAP (Green 1996) has been used. PHRAP is effective but is not immune to alignment problems when presented with low-quality ESTs. An advantage of PHRAP is that it can use sequence quality values derived from sequence chromatograms. Use of chromatograms normally supports the derivation of “longer,” more accurate consensi, but in the STACK schema loose clustering, and thus larger numbers of ESTs in each cluster, provide the basis for longer consensus generation. The hugely redundant nature of ESTs obviates much of the advantages of trace information at this stage in the process, but it is clear that trace information can be effective in provision of significant data in subsequent analyses such as SNP detection, quality assessment, and paralog detection.
The Washington University Human EST Project (http://genome.wustl.edu/est/esthmpg.html) supplies ABI chromatogram data in their own effort to measure sequence confidence, but unfortunately, this is not available for all human sequences in dbEST. Trace information is therefore not used in STACK assemblies.
Alignment Analysis
The quality of neither the annotation of read direction nor the cluster assembly and alignment can be guaranteed. PHRAP invokes a sequence alignment step but provides no subclusters to distinguish alternative splice or other scientifically interesting data from alignment problems induced by low sequence quality or experimental artifacts. To take advantage of the benefits of looser clustering, it is necessary to use significant further processing of the alignment. Two tools, CRAW and CONTIGPROC, have been developed to address postclustering and assembly artifacts and isoforms. CRAW is used to maximize consensus length, partition subassemblies, and provide a simple means to view clusters (Burke et al. 1998; Chou and Burke 1999). CRAW checks the agreement along the columns of a multiple sequence alignment and uses this information to sort related sequences within each cluster, generating IUPAC conformant consensus sequences for each subcluster. A subcluster is generated if 50% or more of a 100-base window differs from the remaining sequences of a cluster, excluding the initial 100 bases of any read. The approach depends fundamentally on the alignment quality of each assembly. A poor alignment will yield erroneous subclusters, and too low a gap penalty may yield too many columns in agreement and thus not create subclusters where they would be appropriate. PHRAP improves alignment quality by removing particularly distinct sequences altogether. Removed sequences are annotated as “PHRAP singletons” related to their d2_cluster assigned grouping and become reattached to that cluster in a clone linking phase.
Consensus Partitioning
A dedicated alignment partitioning procedure is used to further qualify resulting alignments. CONTIGPROC independently partitions the aligned sequences generated from the CRAW consensi, then ranks the consensi according to number of assigned sequences and number of called bases. The best ranking consensus is taken as the primary representative of the cluster, whereas the remaining consensi are logged with the best consensus in GIO (Genome Sequence Database, National Center for Genome Resources) and GDE (Smith et al. 1994) file formats that support representation of sequence alignment data. The 5′ or 3′ orientation of each cluster is determined by a vote of the individual EST annotations, and all output consensi are arranged to read 5′ to 3′. Low-quality consensus regions, defined as 2 N's followed by at least thirteen IUPAC codes with four or less clear A, T, C, or G calls, are replaced by a single run of 10 N's. A high-confidence subset called SANIGENE, consisting of only those consensus regions representing at least two reads, is also generated from the multisequence clusters.
Linking
All ESTs generated from the same cDNA clone correspond to a single gene. Each EST obtained from GenBank is searched for clone identification to trace the transcripts corresponding to the same gene. The clone information is used to extend the length of the cluster consensi by joining clusters containing ESTs with shared clone IDs.
For a gene that is not yet fully sequenced, achievement of a representative consensus sequence from clustered EST data thus requires the joining of available 5′ and 3′ read consensi. Unless a specific 5′ → 3′ pair can be identified as a seed for each gene transcript consensus, the procedure is transitive in nature and may lead to extensive clone-linked networks with biological significance that remains to be explored. The top consensi and d2_cluster singletons (clusters containing only a single EST) with clone-ID annotations are subjected to a clone-linking step. Clone links in STACK are associated via a flag that allocates either one (STACK) or two (SANIGENE) clones linking the same two clusters before a link is accepted. The basic algorithm for clone linking is as follows: Form a queue consisting of an initial cluster do {for each EST with a clone ID, add any cluster containing an EST with a matching clone ID to the queue} until no new clusters are added.
When a closed set of clone-linked consensi has been identified, they may be ordered 5′-unassigned-3′ based on a majority rule from the EST annotations in each cluster. Work is in progress to order fragments based on available clone insert-size information.
Updating
STACK ADD phase is a schema (Fig. 1) for database cluster addition that incorporates the following strategy: For each tissue bin, new ESTs are searched against a pool of tissue-cluster consensi and singletons using cross match, resulting in reduction in the number of ESTs submitted for clustering by 20%-55%. Cluster consensi and/or singletons that cross match to new ESTs are combined to form expanded clusters, whereas ESTs that do not find matching STACK sequences are processed by d2_cluster. The d2_cluster-generated clusters are renamed so that there are no conflicts with existing cluster IDs and are assembled using PHRAP. The PHRAP assemblies together with the alignments of clusters unaffected by the addition of new ESTs are submitted to the STACK_PACK code for analysis and consensus generation. The automation of this process is nearing completion, at which time dynamic updating of STACK will be implemented.
Figure 1.
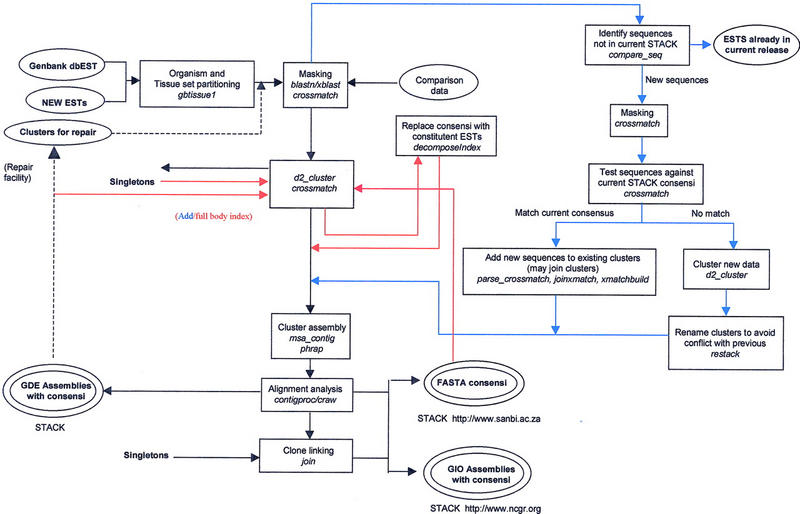
STACK processing overview. Inputs are shown in single-line ellipses, outputs in double-line ellipses. STACK first iteration, ADD, INDEX phases, and the repair facility are indicated by black, blue, red, and black-dotted arrows respectively. In the first iteration (black arrows), human sequences from GenBank dbEST are partitioned into manageable, tissue-related sets. Common vector and repeat sequences are masked, and the resulting entries are subjected to loose clustering by d2_cluster. Clusters of related sequences are assembled by PHRAP, and their alignments are analyzed by CRAW. GDE format assembly data are output, and CONTIGPROC selects appropriate consensi and subconsensi. Available clone-ID information is used to identify clone-linked clusters, after which full-length, joined consensus sequences are output in FASTA (Pearson) format. Complete assembly and linkage information is saved for each index class in GIO format (NCGR). ADD (blue arrows) incorporates new sequence data by comparison to existing STACK consensi. Existing clusters that are identified as members of the same group are reassembled and submitted to the STACK_PACK processing pipeline in combination with and newly generated D2 clusters. During the whole body index (red arrows), all cluster consensi and singletons are submitted as a single set to D2_ cluster during the whole-body index phase (red arrows). The resulting index clusters are then expanded prior to assembly by replacing each consensus with the sequences that contribute to it.
STACK Index Generation
For hierarchical indexing, all cluster consensi and singletons are submitted as a single set to d2_cluster (Fig. 1). The magnitude of the whole-body index necessitates the use of high-performance parallel architecture to complete the clustering phase. The resulting clusters are expanded by replacing each consensus with the sequences that contribute to it. These sets of sequences are entered into the STACK_PACK processing pipeline at the cluster assembly step.
Comparison with UniGene
For each cluster in UniGene, the STACK clusters (singletons or multisequence) with overlapping EST membership are found. For overlapping clusters, the number of common ESTs is determined, and the ratio of commonly held ESTs to total cluster size is calculated. Finally, a STACK “metacluster” is created by taking the union of all STACK clusters that overlap with a single UniGene cluster. The ratio of the STACK metacluster size to the UniGene cluster size is then determined.
Genomic Comparison
DDS and EXT, which are part of Analysis and Annotation Tools (Huang et al. 1997) (ftp://ftp.tigr.org/pub/software/AAT/), are used as database search and extraction tools to determine the coverage of STACK expression clusters for the genomic fragment AC004106. Individual exons are extracted from the genomic fragment as defined by the feature table and then searched against STACK and UniGene data sets. STACK expression clusters that show significant coverage are examined for sequence variation.
RESULTS
Clustering
The STACK clustering process is asymptotically stable in the presence of biological artifact and imperfections in the sequencing process. The rate of joining is nearly constant at all database sizes and is largely unaffected by alternative sequencing chemistries and error rates from differing EST sources.
A total of 1,198,607 sequences are partitioned into 334,822 unique sequences and 143,885 clusters, the latter capturing 837,766 sequences. Based on clone-ID annotations, 68,701 linked sets are created, representing 50% of the total cluster consensi and 30% of the total singletons. Complete results are given in Tables 2 (clustering), 3 (linking), and 5 (errors). The average length (not including amino-linker regions) of a STACK linked consensus is 1003 bases (68,701 consensi), whereas that of the higher confidence SANIGENE set is 847.4 bases (12,635 consensi). The remaining nonlinked STACK cluster consensi have an average length of 508.4 bases (71,189 consensi), whereas those of SANIGENE are 373.1 bases on average (115,641 consensi).
Table 2.
STACK Clustering and Alignment Results
| Tissue | Singletons | Total sequences (%) | Multisequence clusters | Sequence in MSC | Percent total sequences (clustering efficiency) | Small sequences | Total sequences (%) | Total sequences |
|---|---|---|---|---|---|---|---|---|
| Adipose | 1,693 | 71 | 181 | 572 | 24 | 111 | 5 | 2,376 |
| Brain | 42,245 | 24 | 22,848 | 130,573 | 73 | 4,458 | 3 | 177,719 |
| Cochlea | 1,973 | 46 | 710 | 2,213 | 51 | 118 | 3 | 4,304 |
| Connective | 12,652 | 31 | 4,646 | 26,210 | 64 | 876 | 2 | 40,753 |
| Digestive | 17,398 | 34 | 6,734 | 32,124 | 63 | 1,481 | 3 | 51,032 |
| Disease | 29,139 | 25 | 12,513 | 79,433 | 69 | 4,056 | 4 | 114,496 |
| Eye | 13,867 | 49 | 3,448 | 12,933 | 45 | 1,388 | 5 | 28,514 |
| Genomic | 38,481 | 38 | 16,314 | 72,066 | 71 | 4,457 | 4 | 101,986 |
| Gland | 25,836 | 23 | 12,307 | 62,176 | 55 | 1,672 | 1 | 112,346 |
| Heart | 20,782 | 30 | 8,341 | 45,795 | 66 | 217 | 0.3 | 69,830 |
| Hematolymph | 51,654 | 20 | 17,378 | 113,147 | 44 | 2,582 | 1 | 255,565 |
| Lung | 20,129 | 29 | 8,554 | 47,151 | 67 | 2,726 | 4 | 70,259 |
| Muscle | 4,534 | 28 | 1,183 | 8,792 | 54 | 1,037 | 6 | 16,237 |
| Olfactory | 1,478 | 56 | 248 | 830 | 32 | 283 | 11 | 2,600 |
| Other | 9,392 | 36 | 4,315 | 15,663 | 60 | 575 | 2 | 25,925 |
| Reproductive | 43,569 | 18 | 24,165 | 188,088 | 79 | 6,321 | 3 | 239,161 |
| Totals | 334,822 | 26 | 143,885 | 837,766 | 64 | 32,240 | 2 | 1,198,607 |
The total sequences in each tissue set are partitioned by D2_CLUSTER into unique sequences (singletons) and clusters containing multiple related sequences [multi-seq clusters, (MSC)], whereas sequences of <50 bases are excluded from clustering (small sequences).
d2_cluster imposes its own characteristics on clusters produced. At least 4000 ESTs are needed to produce sets containing at least as many multisequence clusters as singletons (clusters containing only a single sequence), with more efficient (percentage of sequences in multiple-sequence clusters) clustering obtained using input sets of at least 60,000 ESTs (Table 2). Twenty-six percent of the total input sequences are found to be unique at the tissue level, whereas 64% are grouped into multiple-sequence clusters; the remaining 10% of the starting set are eliminated because of problems at the assembly step or failure to meet the 50-base minimum length criteria. The reproductive set is seen to cluster more efficiently than the slightly larger hematolymphatic set, but 20% of the hematolymphatic set was not clustered because of hardware failure
Although clustering stability will always be a function of the sequences present in any set, one quarter of the overall data are found to be singleton sequences, whereas the remainder group at an average rate of five ESTs per cluster. This linear representation of cluster joining demonstrates overall stability for large-scale clustering, indicating that no failure occurs as a result of clone reversal, chimerism, and misannotated clones (Aaronson et al. 1996). These results extend the findings on the algorithmic correctness of d2_cluster described by Burke et al. (this issue), demonstrating STACK_PACK's effectiveness in processing real-world sequence data.
Clone Linking
Cluster linking based on clone annotation is a widespread problem in the public databases. The linked sets created by the STACK_PACK process are only as accurate as the annotations that are used to generate them, and the system for STACK generation does not yet include an internal consistency check for clone annotation. Criteria include the requirement for at least two ESTs in a cluster to share clone annotation with two ESTs in another cluster within the SANIGENE dataset. Clone-ID annotations are obtained for 88% of ESTs and are used to generate clone linked entries for 50% of all STACK consensi and 30% of STACK singletons (Table 3). Brain sequences provide the most complete with 81% clone linked multiple sequence clusters (Table 3). This is supported by the efficient clustering (73%; Table 2) of the brain data set.
Table 3.
Clone Linking Results
| Tissue | STACK | Sanigene | ||||||||
|---|---|---|---|---|---|---|---|---|---|---|
| Total linked sets | Linked consensus clusters and singles | Nonlinked consensus clusters | Total consensus clusters (%) | Nonlinked singles | Total singles (%) | Total linked sets | Linked consensus | Nonlinked consensus clusters | Total consensus clusters (%) | |
| Adipose | 0 | 0 | 181 | 100 | 1,693 | 100 | 0 | 0 | 181 | 100 |
| Brain | 13,157 | 35,123 | 4,282 | 19 | 25,688 | 61 | 52,909 | 11,490 | 11,358 | 50 |
| Connective | 1,561 | 3,433 | 3,266 | 71 | 10,599 | 84 | 10 | 20 | 690 | 97 |
| Cochlea | 323 | 666 | 601 | 85 | 1,416 | 72 | 86 | 183 | 4,462 | 96 |
| Digestive | 2,165 | 4,915 | 4,761 | 71 | 14,456 | 83 | 188 | 384 | 6,350 | 94 |
| Disease | 6,106 | 14,103 | 6,623 | 53 | 20,926 | 72 | 725 | 1,477 | 11,036 | 89 |
| Eye | 3,988 | 8,616 | 1,027 | 30 | 7,672 | 55 | 699 | 1,424 | 2,024 | 59 |
| Genomic | 4,168 | 9,131 | 9,997 | 74 | 29,221 | 84 | 665 | 1,358 | 10,949 | 89 |
| Gland | 5,056 | 11,275 | 7,242 | 59 | 19,624 | 76 | 323 | 655 | 14,070 | 96 |
| Heart | 3,630 | 7,937 | 5,462 | 65 | 15,724 | 76 | 295 | 594 | 7,747 | 93 |
| Hematolymph | 10,952 | 25,388 | 9,648 | 56 | 33,996 | 66 | 1,432 | 2,958 | 14,419 | 83 |
| Lung | 4,222 | 9,640 | 5,142 | 60 | 13,901 | 69 | 339 | 694 | 7,860 | 92 |
| Muscle | 1,164 | 2,694 | 622 | 53 | 2,400 | 53 | 52 | 112 | 1,071 | 91 |
| Olfactory | 458 | 944 | 138 | 56 | 644 | 44 | 21 | 42 | 206 | 83 |
| Other | 3,700 | 8,901 | 929 | 22 | 3,877 | 41 | 656 | 1,346 | 2,969 | 69 |
| Reproductive | 8,051 | 26,475 | 11,268 | 47 | 29,991 | 69 | 1,854 | 3,916 | 20,249 | 84 |
| Totals | 68,701 | 169,241 | 71,189 | 50 | 231,828 | 70 | 12,635 | 26,653 | 115,641 | 81 |
Clone-ID annotations are grouped for all ESTs in a cluster, after which clusters or singletons containing matching clone IDs are added to a linked set. The process is continued until no additional clone ID partners can be found. Each linked set may therefore contain singleton sequences and a cluster consensus; hence, the linking success rate is expressed in terms of the fractions of consensus and singletons that remain nonlinked.
Experimental STACK Index v.2.0 Clustering
Clustering of previous release STACK v.2.0 (GenBank 103) was performed on a 126 CPU SGI Origin2000. A total of 330,000 cluster consensi and singletons were partitioned into 122,018 singletons and 68,846 multisequence clusters within 36 hr. STACK v.2.0 data sampled 35,117 tissue-specific clusters (Table 4). Sequences (72,659; 38%) of STACK index represents 3′ data that approximate unique human gene transcripts represented by the STACK data set. STACK v.2.3 index clustering (production level) has recently been completed and will be available on the internet (http://www.sanbi.ac.za/Dbases.html).
Table 4.
Cluster and Alignment Analysis for STACK Index v. 2.0
| Orientation of index data | Singletons | Tissue-specific clusters | Tissue-specific clusters (%) | Multitissue clusters | Multitissue clusters (%) | Total multitissue clusters | Total clusters |
|---|---|---|---|---|---|---|---|
| 3′ | 36,184 | 13,962 | 19 | 22,513 | 31 | 36,475 | 72,659 |
| 5′ | 56,583 | 15,672 | 19 | 10,566 | 13 | 26,238 | 82,821 |
| End not specified | 29,251 | 5,483 | 16 | 640 | 2 | 6,123 | 35,364 |
| Totals | 122,018 | 35,117 | 18 | 33,719 | 18 | 68,846 | 190,854 |
Comparison with UniGene
The easy availability (http://www.ncbi.nlm.nih.gov) and frequent updating of the UniGene (Boguski et al. 1995; Schuler et al. 1996) sequence cluster database make it a rough standard for evaluation of STACK's clustering efficiency. Although the starting materials and goals of the two databases are distinct (UniGene is a rapid implementation that has differing error rates and does not attempt to generate and provide assemblies or consensus sequences), both attempt to minimize redundancy in their starting sets by clustering similar sequences. UniGene clusters over the entire set of available Homo sapiens sequences, rather than on the per tissue basis used by STACK. As a result, a single UniGene cluster may be expected to overlap with several STACK tissue clusters. STACK and UniGene comparison is based on equivalent UniGene build #61(GenBank December 1998 release for this comparison). We have isolated the non-mRNA-containing anchored UniGene clusters (44,367 entries) and used these in the comparison with the STACK v.2.3 release. In 94% of cases the STACK metaclusters group at least as many ESTs from the same release of dbEST as the intersecting UniGene clusters. The remaining 6% of cases represent sequences that are unique to UniGene. Conversely, 28% of STACK sequences are not present in UniGene, which reflects the more stringent criteria used by UniGene for inclusion of data (raw data available on request). Sixteen percent of UniGene clusters contributed to fragmentation of 3813 STACK metaclusters, in comparison to a study by Burke et al. (this issue) in which fragmentation of 13% is reported for a subset of UniGene. The fragmented UniGene clusters contain examples in which sequences should have been grouped in the same index class. For example, Hs.145328 (EST AI253034) and Hs.125352 (EST AA877071) are present in STACK cluster 11332-0-hemat-001-1999-2.3. These two ESTs show 99.16% (119 out of 120) similarity over 120 bases and should be present in the same cluster as indicated by the corresponding STACK cluster.
STACK metaclusters are on average 1.86 times larger than their intersecting UniGene clusters, indicating that STACK/d2_cluster implements a looser clustering algorithm than UniGene overall. These findings differ somewhat from those reported in Burke et al. (this issue) because of differences in methodology; specifically, this work uses the incrementally updated UniGene, keeps more low-quality sequences, and includes a clone-linking step.
Output Data Formats and Access
STACK is available in three data formats that include FASTA format of a single nonredundant primary consensus sequence, GIO format that captures both individual clusters and subcluster assemblies, and GDE alignments for each STACK cluster. Intermediate processing outputs, statistics of processing, and CRAW log files are also provided.
FASTA Output
A FASTA format version of STACK contains a single, nonredundant primary consensus from each cluster. It is partitioned as the following:
Clone-Linked Sets
Link sets contain consensus sequences linked by 5′ → 3′ clone annotated ESTs. This set is the most easily searched using standard software to extend a newly determined EST probe. Once a linked-set consensus sequence is located, the FASTA header lines may be examined directly to determine the constituent ESTs and/or clusters.
Multisequence Cluster Sets
Clusters that contribute to clone-linked sequences are separated from those clusters that do not contribute to clone linking. These two sets of sequences are presented in FASTA format in which the header line captures the ESTs used in the generation of the consensus sequence.
Singleton Sets
Singletons that do not contribute to the clone-linked data are partitioned from the file of singletons that are included in the clone-linked sets. These two data sets are presented in FASTA format in which the header line captures the STACK accession number and GenBank accession number.
Alignments
Genetic Data Environment Format
GDE files, derived from each PHRAP assembly file, represent the overall alignment of each cluster with its unprocessed subconsensi and allow study of polymorphisms using widely available sequence assembly visualization tools (Karlak and Hide 1998).
CRAW Format
CRAW processed output of each GDE format alignment allows for direct assessment of sequence variation and subconsensus generation (Fig. 2).
Figure 2.
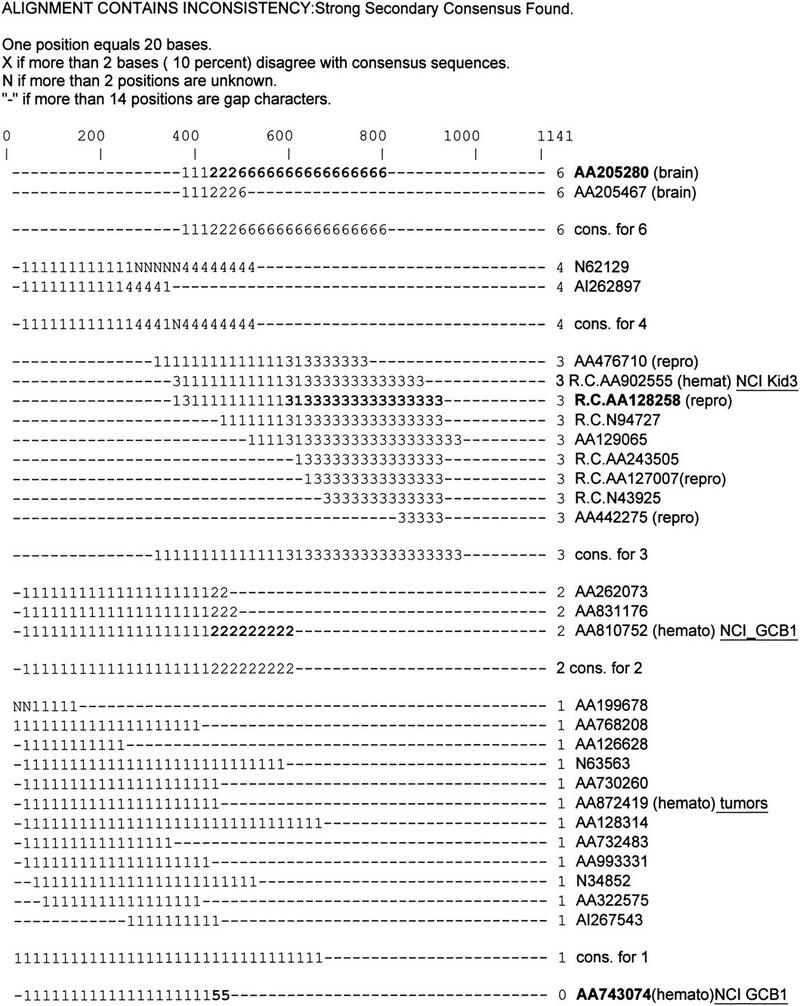
CRAW analysis of a STACK whole-body index cluster that shows similarity to a genomic clone, AC004106. Sequences are displayed on consecutive lines with one position in the line representing 20 bases. Identical numerical values correspond to regions of sequence identity. Difference in numerical value indicate sequence variarion. Tissue origins are shown in brackets, and tissue libraries are underlined. Subconsensi are highlighted in bold corresponding to the splice variants within fragment AC004106. Primary consensus (11111) shows significant similarity to clathrin coat adaptor complex sigma1B protein (AB015320.1). The secondary consensi (2222, 333333, 666666) show significant similarity to two exons 34000...36000 and 54100...54200 (putative alternate splice regions in genomic clone AC004101).
Viewing
VIZ, a freely available, standalone Java-based viewer, is provided for STACK joined and single cluster data. Source code and an online Web-based viewing and extraction system linking with corresponding UniGene clusters are also available at www.sanbi.ac.za/stack and ftp.sanbi.ac.za/STACK/. Both VIZ and the online Web-based viewer display linked and standard sequence alignments, CRAW outputs, and consensus sequences. CRAWview (Chou and Burke 1999) displays CRAW reports, SeqLab (GCG), and GDE display STACK alignments. Visualization of CRAW files and clustered EST outputs from STACK_PACK is also under development in collaboration with the CORBA-based JESAM/Genome Builder project (Muilu et al. 1999).
Comparison with Genomic Fragment AC004106
Bouck et al. (1999) reported a comparison of EST databases in which they showed the coverage of STACK clusters for a genomic clone, AC004106. In particular, three ESTs, namely AA128258, AA205280, and AA743074, were reported to partially represent known alternate splice exons within the genomic fragment with a matching STACK cluster shown for that region. We have performed an independent assessment to determine the fidelity of STACK expression clusters. We have assessed the expression clusters that have >96% contiguous similarity in each of the exons corresponding to the two genes encoded in the genomic clone AAC004106 (Fig. 3).
Figure 3.

Schematic representation of the coverage (percent of exon length matched above 96% contiguous similarity) of STACK and UniGene clusters across the exonic regions of gene 1 (U2 small nuclear ribonucleoprotein auxilary factor U2AF1-RS2) and gene 2 (Clathrin-coated assembly protein AP19 AC004876) contained in genomic clone AC004106. UniGene mRNA: UniGene cluster containing mRNA; UniGene non-mRNA: UniGene cluster containing no mRNA. Description of tissues as outlined in Fig. 2. STACK clusters (open reactangles), UniGene mRNA-containing clusters (solid rectangles) and UniGene non-mRNA-containing clusters (shaded rectangles) that show similarity to the various exons of gene 1 and 2 (horizontal axis) are displayed graphically. Number of nucleotides in each exon gene 1: 1(84), 2(109), 3(57), 4(39), 5(119), 6(214), 7(1730), and 8(475), respectively. Exons were extracted from the feature table of the GenBank entry AC004106 as 8601..8684, 12419..12527, 12842..12898, 16964..17002, 17931..18049, 24408..24621, 27318..29047, and 31462..31988. Gene 2: 1(464), 2(253), 3(81), 4(136), 5(111), and 6(157), respectively. Exons were extracted from the feature table of the GenBank entry AC004106 as 35640..36103, 40047..40299, 42175..42255, 54110..54245, 54632..54742, and 61077..61233.
STACK clusters and UniGene (build #61) non-mRNA-anchored clusters show 99% coverage for 50% of exons within gene 1 (Fig. 3). Two additional exons are covered completely by a UniGene mRNA-anchored cluster. Exon 7 provides significant similarity to 199 UniGene mRNA-anchored clusters, 1907 non-mRNA-anchored UniGene clusters, and 200 STACK clusters. However, comparison against the nonredundant database determines that exon 7 is Alu rich. STACK clusters, therefore, can contain significantly reduced repeat sequence contamination.
Four of six exons for gene 2 are represented by multiple STACK clusters and a single non-mRNA-anchored UniGene cluster. STACK clusters 30598-0-brain-1999-2.3, 133132-0-hemat-1999-2.3, and 46836-0-repro-1999-2.3 sample alternate splice variants, specifically in exons 1 and 4. The subconsensi generated for these three STACK clusters (Fig. 2) correspond to regions of exon 1 and exon 4 that have been documented as putative alternate splice regions (Bouck et al. 1999). We assembled the three alternate splice cluster ESTs and examined the assembly using CRAW (Fig. 2). The primary consensus sequence shows significant similarity to Clathrin-coated complex sigma1B protein (AB015320.1). The secondary consensi match regions within the alternate splice exons (1 and 4) represented on genomic clone AC004106.
Detection of Single Nucleotide Polymorphisms
A thorough analysis of observed classes of genetic diversity and their assessment is beyond the scope of this paper, but an initial assessment has yielded novel detectable candidate SNPs in P53 representations of STACK data (Karlak and Hide 1998).
Problems
One percent of total sequences involved in clusters fail the assembly step because of insufficient available virtual memory (1.5 gigabytes; see Table 2) and problems of obtaining clone-ID annotations. Table 5 quantifies the nonideal clusters as well as the fractions of clusters presenting disagreements in 5′ and 3′ annotations. The ideal result of a single consensus is realized in 86% of all clusters. Eight percent of all clusters present multiple consensi, that is, contain at least two sequences matching each other but not matching the cluster's primary consensus according to the CRAW parameters. These consensi represent potential errors, chimeras, and some alternate splice data. Further alternate splice data is captured by index assembly with tissue-cluster consensi (STACK-INDEX v.2.0, STACK-INDEX v.2.3, in prep.). Two percent of alignments analyzed by CRAW are so poor that no satisfactory consensus can be generated (“only singletons” in Table 5), whereas the remaining 4% of clusters are found to have a primary consensus and at least one differing EST (not matching any other EST in the index class). Many of the consensus problems are errors in multiple sequence alignment. Further analysis is required to extract a subset of true alternative splices and other polymorphisms from these “non-ideal” clusters. CONTIGPROC evaluates results in combination with each EST's database annotation and detects disagreements in annotated read direction in 13% of clusters overall (in agreement with Hillier et al. 1996).
Table 5.
Error Analysis
| Tissue | Single consensus clusters | Total clusters (%) | Multi-consensus clusters | Total clusters (%) | Total only singletons | Total clusters (%) | Single consensus + 1 or more singletons | Total clusters (%) | 3′/5′ disagreement | Total clusters |
|---|---|---|---|---|---|---|---|---|---|---|
| Adipose | 173 | 96 | 5 | 3 | 3 | 2 | 0 | 0 | 23 | 13 |
| Brain | 19,933 | 87 | 1,850 | 8 | 296 | 1 | 769 | 4 | 2,552 | 11 |
| Cochlea | 689 | 97 | 13 | 2 | 4 | 0.5 | 4 | 0.5 | 18 | 3 |
| Connective | 4,098 | 88 | 316 | 7 | 93 | 2 | 140 | 3 | 358 | 8 |
| Digestive | 6,089 | 90 | 370 | 6 | 82 | 1 | 193 | 3 | 493 | 7 |
| Disease | 10,845 | 87 | 989 | 8 | 198 | 1 | 481 | 4 | 2,589 | 21 |
| Eye | 2,799 | 81 | 288 | 8 | 229 | 7 | 132 | 4 | 303 | 9 |
| Genomic | 14,924 | 91 | 792 | 5 | 177 | 1 | 421 | 3 | 2,550 | 16 |
| Gland | 10,843 | 88 | 820 | 7 | 237 | 0.2 | 408 | 4.8 | 1,096 | 9 |
| Heart | 7,341 | 88 | 622 | 7 | 104 | 1 | 274 | 4 | 699 | 8 |
| Hematolymph | 14,639 | 84 | 1,774 | 10 | 271 | 2 | 694 | 4 | 2,731 | 16 |
| Lung | 7,483 | 87 | 667 | 8 | 137 | 2 | 267 | 3 | 1,828 | 21 |
| Muscle | 1,084 | 92 | 64 | 5 | 12 | 1 | 23 | 2 | 67 | 6 |
| Olfactory | 238 | 96 | 7 | 2.8 | 2 | 0.8 | 1 | 0.4 | 4 | 2 |
| Other | 2,675 | 85 | 285 | 7 | 184 | 4 | 171 | 4 | 172 | 4 |
| Reproductive | 19,178 | 79 | 3,196 | 13 | 533 | 2 | 1,258 | 6 | 3,373 | 14 |
| Totals | 124,031 | 86 | 12,058 | 8 | 2,562 | 2 | 5,236 | 4 | 18,856 | 13 |
CRAW analyzes cluster alignments generated by PHRAP or MSA_CONTIG and partitions consistent ESTs into subclusters based on agreement with other sequences. The ideal result is a single consensus cluster, accounting for 86% of the STACK output, while the remaining clusters may contain multiple sequence subclusters (resulting in a multiconsensus cluster), a primary consensus with one or more singleton sequences (data not shown), singleton ESTs according to the CRAW parameters. STACK clusters are generated by word identity counts and their read direction determined by majority vote of the annotations of constituent ESTs; clusters for which this vote is not unanimous (excluding abstentions) are noted in the right-most two columns.
After completion of the STACK v.2.0 release, some 2000 clusters and singletons were found to contain contamination by mitochondrial DNA fragments. This led to the inclusion of mitochondrial and ribosomal sequences in the mask data set (see Methods), and highlighted useful features of the STACK schema for working with dynamic sequence database information. Specifically, this contamination was itself clustered, facilitating the conversion of the identified problem clusters back to EST sequence data with the repair tools. The mask data set was expanded, such that only affected ESTs needed to be reprocessed. Furthermore, the corresponding SANIGENE consensi were largely immune from the contamination because of the redundancy requirement in their generation.
DISCUSSION
STACK thoroughly and efficiently clusters the error-laden and redundant dbEST database into looser clusters than other approaches and refines these groupings with CRAW and CONTIGPROC to elucidate the contributions of sequence polymorphism, alternate sequence expression, error, and artifact. Organization of EST data is driven by the need to detect and understand the gene sequences that underlie their generation. Once organized, these more “gene-representative” sequences still need to be intensively processed. Protein coding regions, mRNA expression levels, unique 3′-untranslated regions, constituent genomic exons, and residue quality all need to be addressed before a partial gene transcript sequence can be accepted and analyzed with confidence. Clustering and initial processing as presented here only provide an initial basis on which further work can be performed.
The STACK methodology and database demonstrate a consolidation of over two-thirds in the total number of sequences representing the EST input sets. Input sequences (1,198,607) are reduced to 68,701 linked sets, 71,189 nonlinked consensi, and 231,828 nonlinked singletons. The set of 371,718 clusters covering 15 nonredundant tissue sets has been condensed in a subsequent clustering procedure to generate an overall index (STACK-INDEX v.2.0; STACK-INDEX v.2.3, in prep.). The accuracy of any index estimate will be limited by the lack of clone-ID annotations in the original input sequences, and the failure of submitters to include this information has reduced the potential value of the public EST database.
STACK has demonstrated that less systematic problems, such as read direction assignment errors due to lane tracking errors and internal priming, can be compensated for by the sheer number of available ESTs. Aaronson et al. (1996) have noted that overlapping genes with opposite orientation will also appear to yield problems in clone read direction and express the concern that this will result in merging distinct genes into an index class. The STACK system has not attempted to address this issue and, indeed, presents the linking of such related sequences as an overall enhancement of the data for the researcher intending to annotate a newly sequenced EST.
Production and partitioning of sequence cluster consensi have made it possible to derive direct value from the link between expression (arbitrary tissue bin and EST source library) cluster consensus and chromosomal location. Tissue-specific EST clusters have been used successfully in the mapping of retina-specific ESTs to chromosomal regions that coincide with inherited retinal disease gene locations (Malone et al. 1999). The STACK system has aided the characterization of a novel retinitis pigmentosa gene (Sullivan et al. 1999). These applications demonstrate the value of tissue-specific data sets, which are made available as part of the STACK index generation, as a resource for gene discovery.
Further work on STACK will focus on its application to the distribution of expression and detection and analysis of genetic polymorphisms, as well as continuous updates to incorporate newly submitted ESTs. Current sequence analysis and visualization tools rely on sequence accession IDs remaining unchanged through database updates, as certainly an accurate, experimentally determined sequence would not be expected to change with time. STACK cluster consensi are highly dynamic, and only the underlying accessions of ESTs currently provide a means of consistency. This problem is yet to be adequately addressed by clustering systems.
Availability
STACK
BLAST searching and retrieval of current STACK sequence data is available via http://www.sanbi.ac.za/Dbases.html, and STACK consensi matched to Drosophila sequences are searchable on the Drosophila Related Expressed Sequences (DRES) home page at the Telethon Institute of Genetics and Medicine (http://www.tigem.it). STACK is freely available to academica and is distributed via Web site at http://www.sanbi.ac.za/STACK_REQUEST.
STACK_PACK
The STACK_PACK tool set can be used for the manufacture of databases as well as incorporation of STACK data. It performs clustering, clustering management, alignment processing, and analysis and is freely available to academia and is distributed from www.sanbi.ac.za/CODES.
Acknowledgments
We gratefully acknowledge the support of Silicon Graphics Corporation for its generous donation of time on the CRAY-SGI farm. We thank Juli Nash and John Carpenter at Silicon Graphics-Cray Incorporated, the University of Houston; Carol Harger, Marilyn Skupski, and the National Center for Genome Research; Tadasu Shin-i and Teijin Systems Technology, and Nobuyuki Miyajima and the Kazusa DNA Research Institute. Preparation of the manuscript was greatly aided by Janet Kelso. This work was originally funded under U.S. Department of Energy grant DE-FC03-95ER62062 (W.A.H.) and S.A. Foundation for Research grant GUN 2039524 (W.A.H.)
The publication costs of this article were defrayed in part by payment of page charges. This article must therefore be hereby marked “advertisement” in accordance with 18 USC section 1734 solely to indicate this fact.
Footnotes
E-MAIL winhide@sanbi.ac.za; FAX 2721 959 2512.
REFERENCES
- Aaronson JS, Eckman B, Blevins RA, Borkowski JA, Myerson J, Imran S, Elliston KO. Toward the development of a gene index to the human genome: An assessment of the nature of high-throughput EST sequence data. Genome Res. 1996;6:829–845. doi: 10.1101/gr.6.9.829. [DOI] [PubMed] [Google Scholar]
- Adams MD, Dubnick M, Kerlavage AR, Moreno R, Kelley JM, Utterback TR, Nagle JW, Fields C, Venter JC. Sequence identification of 2,375 human brain genes. Nature. 1992;355:632–634. doi: 10.1038/355632a0. [DOI] [PubMed] [Google Scholar]
- Adams MD, Kelley JM, Gocayne JD, Dubnick M, Polymeropoulos MH, Xiao H, Merril CR, Wu A, Olde B, Moreno R F, Kerlavage AR, McConbie WR, Venter JC. Complementary DNA Sequencing: Expressed sequence tags and human genome project. Science. 1991;252:1651–1656. doi: 10.1126/science.2047873. [DOI] [PubMed] [Google Scholar]
- Altschul SF, Gish W, Miller W, Myers EW, Lipman J. Basic local alignment search tool. J Mol Biol. 1990;215:403–410. doi: 10.1016/S0022-2836(05)80360-2. [DOI] [PubMed] [Google Scholar]
- Boguski MS, Schuler GD. Establishment of a transcript map. Nat Genet. 1995;10:369–371. doi: 10.1038/ng0895-369. [DOI] [PubMed] [Google Scholar]
- Bouck JW, Yu, W, Gibbs R, Worley K. Comparison of gene indexing databases. Trends in Genet. 1999;15:159–162. doi: 10.1016/s0168-9525(99)01709-6. [DOI] [PubMed] [Google Scholar]
- Burke J, Wang H, Hide W, Davison D. Alternative gene form discovery and candidate selection from gene indexing projects. Genome Res. 1998;8:276–290. doi: 10.1101/gr.8.3.276. [DOI] [PMC free article] [PubMed] [Google Scholar]
- Burke, J., D. Davison, and W. Hide. 1999. d2_cluster: A validated method for clustering EST and full-length cDNA. Genome Res. (this issue). [DOI] [PMC free article] [PubMed]
- Chou A, Burke J. CRAWview: For viewing splicing variation, gene families, and polymorphism in clusters of ESTs and full-length sequences. Bioinformatics. 1999;15(5):376–381. doi: 10.1093/bioinformatics/15.5.376. [DOI] [PubMed] [Google Scholar]
- Genome Sequence Database (GIO/GSDB), National Center for Genome Research, http://www.ncgr.org.
- Green, P. 1996. PHRAP (http://www.genome.washington.edu/uwgc/analysistools/phrap.htm, phg@u.washington.edu).
- Hide W, Burke J, Davison D. Biological evaluation of d^{2}, an algorithm for high-performance sequence comparison. J Comput Biol. 1994;1(3):199–215. doi: 10.1089/cmb.1994.1.199. [DOI] [PubMed] [Google Scholar]
- Hide W, Burke J, Christoffels A, Miller R. A novel approach towards a consensus representation of the expressed human genome. In: Miyano S, Takagi T, editors. Genome informatics 1997. Tokyo, Japan: Universal Academy Press, Inc.; 1997. pp. 187–196. . ISSN 0919-9454. [Google Scholar]
- Hillier L, Clark N, Dubuque T, Elliston K, Hawkins M, Holman M, Hultman M, Kucaba T, Le M, Lennon G, et al. Generation and analysis of 280,000 human expressed sequence tags. Genome Res. 1996;6:807–828. doi: 10.1101/gr.6.9.807. [DOI] [PubMed] [Google Scholar]
- Houlgatte R, Marriage-Samson R, Duprat S, Tessier A, Bentolilal S, Lamy B, Auffray C. The Genexpress Index: A resource for gene discovery and the genic map of the human genome. Genome Res. 1995;5:272–304. doi: 10.1101/gr.5.3.272. [DOI] [PubMed] [Google Scholar]
- Huang X, Adams MD, Zhou H, Korlavage AR. A tool for analyzing and annotating genomic sequences. Genomics. 1999;46:37–45. doi: 10.1006/geno.1997.4984. [DOI] [PubMed] [Google Scholar]
- Jurka J. Repeats in genomic DNA: Mining and meaning. Curr Opin Struct Biol. 1998;8:333–337. doi: 10.1016/s0959-440x(98)80067-5. http://charon.girinst.org/∼server/ repbase.html. [DOI] [PubMed] [Google Scholar]
- Karlak B, Hide W. Assessment of utility of ESTs for nucleotide diversity using available assembled alignments from dbEST, STACK v.2.0, and STACK-INDEX. In: Miyano S, Takagi T, editors. Genome informatics 1998. Tokyo, Japan: Universal Academy Press Inc.; 1998. pp. 266–268. . ISBN 0919-9454 . [Google Scholar]
- Malone K, Sohocki M, Sullivan L, Daiger S. Identifying and mapping novel retinal-expressed ESTs from humans. Mol Vis. 1999;5:5. [PMC free article] [PubMed] [Google Scholar]
- Matsubara K, Okubo K. Identification of new genes by systematic analysis of cDNAs and database construction. Curr Opin Biotechnol. 1993;4:672–677. doi: 10.1016/0958-1669(93)90048-2. [DOI] [PubMed] [Google Scholar]
- Muilu J, Rodriguez-Tome P, Robinson A. In: GenomeBuilder: Integrating external applications and databases using CORBA. Seventh International Conference on Intelligent Systems for Molecular Biology. Lengauer T, Schneider R, Bork P, Brutlag D, Glasgow J, Mewes H-W, Zimmer R, editors. 1999. p. 103. [Google Scholar]
- Okubo K, Hori H, Matuba R, Niiyama T, Matsubara K. A novel system for large-scale sequencing of cDNA by PCR amplification. DNA Seq. 1991;2:137–144. doi: 10.3109/10425179109039684. [DOI] [PubMed] [Google Scholar]
- Schuler G, Boguski M, Stewart E, Stein L, Gyapay G, Rice K, White R, Rodriguez-Tome P, Aggarwal A, Bajorek E, et al. A gene map of the human genome. Science. 1996;274:540–546. [PubMed] [Google Scholar]
- Smith SW, Overbeek R, Woese CR, Gilbert W, Gillevet PM. The Genetic data environment: An expandable GUI for multiple sequence analysis. Comp Appl Biosci. 1994;10:671–675. doi: 10.1093/bioinformatics/10.6.671. [DOI] [PubMed] [Google Scholar]
- Sullivan LS, Heckenlively J, Bowne S, Zuo J, Hide W, Gal A, Denton M, Inglehearn C, Banton S, Daiger S. Mutations in a novel retina-specific gene cause autosomal dominant retinitis pigmentosa. Nat Genet. 1999;22:255–259. doi: 10.1038/10314. [DOI] [PMC free article] [PubMed] [Google Scholar]
- Sutton G, White O, Adams D, Kerlavage A. TIGR Assembler: A new tool for assembling large shotgun sequencing projects. Genome Sci Technol. 1995;1(1):9–18. [Google Scholar]
- Tanaka T, Ogiwara A, Uchiyama I, Takagi T, Yazaki Y, Nakamura Y. Construction of a normalized directionally cloned cDNA library from adult heart and analysis of 3040 clones by partial sequencing. Genomics. 1996;35:231–235. doi: 10.1006/geno.1996.0344. [DOI] [PubMed] [Google Scholar]
- Torney D, Burks C, Davison D, Sirotkin K. A simple measure of sequence divergence. Los Alamos National Laboratory technical report LAUR 89-946. Los Alamos, NM: LANL; 1990a. [Google Scholar]
- ————— . Computation of d2. A measure of sequence dissimilarity. In: Bell G, Marr T, editors. Computers and DNA. Santa Fe Institute studies in the sciences of complexity, vol. VII. New York, NY: Addison-Wesley; 1990b. [Google Scholar]
- Vasmatzis G, Essand M, Brinkmann U, Lee B, Pastan I. Discovery of three genes specifically expressed in human prostate by expressed sequence tag database analysis. Proc Natl Acad Sci. 1998;95(1):300–304. doi: 10.1073/pnas.95.1.300. [DOI] [PMC free article] [PubMed] [Google Scholar]
- Williamson A, Elliston K, Sturchio J. The Merck Gene Index, a public resource for genomics research. J NIH Res. 1995;7:61–63. [Google Scholar]
- Wolfberg T, Landsman D. A comparison of expressed sequence tags (ESTs) to human genomic sequences. Nucleic Acids Res. 1997;25(8):1626–1632. doi: 10.1093/nar/25.8.1626. [DOI] [PMC free article] [PubMed] [Google Scholar]