

Abstract
Several efforts are under way to condense single-read expressed sequence tags (ESTs) and full-length transcript data on a large scale by means of clustering or assembly. One goal of these projects is the construction of gene indices where transcripts are partitioned into index classes (or clusters) such that they are put into the same index class if and only if they represent the same gene. Accurate gene indexing facilitates gene expression studies and inexpensive and early partial gene sequence discovery through the assembly of ESTs that are derived from genes that have yet to be positionally cloned or obtained directly through genomic sequencing. We describe d2_cluster, an agglomerative algorithm for rapidly and accurately partitioning transcript databases into index classes by clustering sequences according to minimal linkage or “transitive closure” rules. We then evaluate the relative efficiency of d2_cluster with respect to other clustering tools. UniGene is chosen for comparison because of its high quality and wide acceptance. It is shown that although d2_cluster and UniGene produce results that are between 83% and 90% identical, the joining rate of d2_cluster is between 8% and 20% greater than UniGene. Finally, we present the first published rigorous evaluation of under and over clustering (in other words, of type I and type II errors) of a sequence clustering algorithm, although the existence of highly identical gene paralogs means that care must be taken in the interpretation of the type II error. Upper bounds for these d2_cluster error rates are estimated at 0.4% and 0.8%, respectively. In other words, the sensitivity and selectivity of d2_cluster are estimated to be >99.6% and 99.2%.
[Supplementary material to this paper may be found online at www.genome.org and at www.pangeasystems.com.]
The rapid generation of single-read sequence from the 3′ ends and 5′ portions of sufficiently expressed mRNAs (popularly referred to as ESTs) (Adams et al. 1991; Okubo et al. 1991; Wilcox et al. 1991) has resulted in the discovery of many genes well before the projected completion of the human genome project and before the completion of sequencing efforts in other organisms (Adams et al. 1992; Matsubara and Okubo 1993; Venter 1993). Because the source information is available for every EST, the intracluster representation of libraries from discrete disease and developmental states can be contrasted and hence large-scale expression studies can be performed (Okubo et al. 1992, 1994; Adams et al. 1995; Vasmatzis et al. 1998). EST sequence has enabled the construction of a physical map of the human genome (Hudson et al. 1995) as well a gene map that localizes many genes with respect to the markers of the physical map (Schuler et al. 1996). The utility of EST data has also been increased greatly by the establishment of centralized databases (Boguski et al. 1993).
The fragmented nature and vast quantity of EST data pose an obstacle to harvesting the full potential from this data source. Hence, several projects are in progress to construct information frameworks, called gene indices, where the fragmented, error-prone EST data and the known gene sequence data can be consolidated and placed in a correct pathologic and mapping context indexed by gene such that all data concerning a single gene is in a single index class and each index class contains the information for only one gene. Algorithmically, these projects all comprise some type of cluster analysis in which sequence similarity and possibly other criteria are used to form the clusters or index classes. Below, we detail some of the clustering methods used in several gene index projects.
The Institute for Genome Research (TIGR) Gene Index (TGI) (http://www.tigr.org/tdb/hgi/hgi.html; Adams et al. 1995; Sutton et al. 1995; White and Kerlavage 1996) is constructed by assembling full-length sequence [from the Expressed Gene and Anatomy Database (EGAD); White and Kervalage 1996)] and ESTs to form tentative human consensi (THCs). The THC_BUILD program (G. Sutton, pers. comm.) constructs index groups according to the following schedule: (1) BLAST and FASTA (Pearson 1990) are used to identify all sequence overlaps, (2) all detected overlaps are stored in a relational database, (3) the CLUB program forms transitive closure groups from the overlap database, and (4) groups are subjected to assembly using TIGR assembler (Sutton et al. 1995; http://www.tigr.org/hgi/hgi_info.html). The assembler also imposes matching constraints on the ends of sequences and a minimum sequence identity within an index group. Most sequence assembly programs share similar properties with TIGR assembler; however, it is worth noting that some assemblers, such as the PHRAP package, incorporate sequence quality data derived from sequence traces into the assembly process (P. Green, pers. comm.) allowing for the incorporation of higher error data.
In UniGene (Boguski and Schuler 1995; Schuler at al. 1996), genes are indexed by forming initial groups with full-length sequences (mRNA and genomic). Then groups are formed within the EST set and between the ESTs and the initial groups. EST matches are not allowed to join distinct initial groups and clusters without a polyadenylation signal or unless at least two 3′ ESTs are discarded. Finally, clone information was used to further join clusters and singleton clusters, and unmatched ESTs were added to nonsingleton clusters at lower stringency levels (http://ncbi.nlm.nih.gov/UniGene/TXT/build.html). To enhance the speed of the clustering, a two-phase searching process was used in which two sequences were compared with a constrained Smith–Waterman algorithm only if they shared two common words of length 13 separated by no more than 2 bases. The STACK gene indexing system that uses d2_cluster is covered in the discussion section of this paper and in a companion paper.
In this article we describe d2_cluster, an algorithm for clustering sequences into index classes. First, we describe the basic method (which we call D20 to distinguish it from future variants of the algorithm). We then demonstrate the utility of d2_cluster by performing a data analysis of the results of clustering a moderate sized data set (∼43,000 sequences). We characterize the relative performance of d2_cluster and UniGene clustering showing that although the behavior of the two algorithms is very similar, there are measurable differences in the rate of merging sequences into clusters. Finally, we derive estimates of the absolute type I and type II error rates (the probability of under or over clustering) for d2_cluster.
Description of the d2_cluster Method (D20)
d2_cluster is an agglomerative clustering method [every sequence begins in its own cluster, and the final clustering is constructed through a series of mergers (Johnson and Witchern 1994)]. d2_cluster can be described in terms of minimal linkage clustering (sometimes called single linkage or transitive closure in the sequence analysis literature). The term transitive closure refers to the property that any two sequences with a given level of similarity will be in the same cluster; hence, A and B are in the same cluster even if they share no similarity but there exists a sequence C with enough similarity to both A and B. The criterion for joining clusters is the detection of two sequences that share a window of (Window_Size) bases that is (Stringency) percent or more identical. The only criterion for clustering is sequence overlap and source or annotation information is not used. To detect the overlap criterion, we use the d2 algorithm and set parameters and threshold values as described in previous work (Torney et al. 1990; Hide et al. 1994; Wu et al. 1997). The initial and final state of the algorithm is a partition of the input sequences in which each sequence is in a cluster and no sequence appears in more than one cluster.
For ease of notation, let the following conventions hold:
We signify the d2 distance between two sequences, say A and B, as d2(A,B).
Given two clusters, e.g., clusters i and j, the operation MERGE(cluster i, cluster j), also denoted MERGE(cluster i ← cluster j), means that all sequences in cluster j are assigned to cluster i.
The database to be clustered contains N sequences that are numbered 0 through (N − 1). Let sequence (i) be denoted Si or S(i).
The membership of sequence Si is denoted Ci.
The notation d2(A,B) is conveniently used, but, of course, d2(,) is not a function of only A and B but also of various parameters (specified in Torney et al. 1990; Hide et al. 1994; Wu et al. 1997). The MERGE operation can be expressed in terms of convention 4 above: For all sequences, Sr, such that Cr = j, Cr is reset to be Cr = i.
We describe the progression of d2_cluster inductively in that we first detail what happens in the first two iterations (I0 and I1) and then describe how one performs iteration (i + 1) given that iteration (i) has been completed. Technically speaking, it is sufficient to state only the first step and then to give the step (i) to step (i + 1) instructions, but we detail the first two steps for clarity.
The clustering is finished when N iterations are completed. Transitive closure is obtained because clusters are joined if they contain any sequences with sufficient identity. d2_cluster, as described above, can be mapped to the minimal linkage algorithm commonly seen in the statistics and engineering texts, and details of this are given in the online supplement to this paper (http://www.genome.org and www.pangeasystems.com).
Data and Error Analysis
Relative Performance of d2_cluster and UniGene
The first step in evaluating d2_cluster performance was to compare it with other methods. The UniGene data set was chosen for comparison due to its high quality and wide acceptance. Because an implementation of the UniGene clustering suite was not available, it was not possible to actually run the UniGene clustering algorithm. Hence, the base sequences from a version of UniGene (Rat section, UniGene build 19, August 1998) were processed with d2_cluster, and the d2_cluster/UniGene groupings were compared. Unless explicitly stated otherwise, all UniGene clusters referenced in this paper come from build 19. Rat UniGene had 43,612 ESTs and full-length mRNA sequences. Because the screening information for UniGene was unavailable, it was necessary to rescreen the data set against repetitive elements and mitochondrial sequence. The cross_match (P. Green, unpubl.) program was used for this purpose, and an “x” screening marker was left over sequence positions matching repetitive elements. Sequences with <100 bases of nonscreened sequence remaining were dropped from the analysis, and the remaining 42,441 sequences were clustered with d2_cluster (at the parameter settings Window_Size = 100, Stringency = 0.9, Min_Seq = 100, and Rev_Comp = 1. At these settings two sequences are placed into the same cluster if they contained a window of size 100 bases with at least 90% identity. Sequences with <100 bases are disregarded, and the reverse strand is searched). Approximately 31 hr were required to complete the cluster analysis on a SUN machine E450 with a 400-MHz processor. As stated above, the clustering of sequence with d2_cluster was made strictly on the basis of sequence similarity, and annotation information was not used. After this processing, every sequence was a member of exactly one d2 cluster and one UniGene cluster.
Table 1 compares the cluster size distribution for the UniGene and d2_cluster groupings. d2_cluster produced ∼20% fewer singleton sequences (6463 to 5198) and reduced the overall number of clusters by 10% (15,225–13,756). Generally, the numbers of smaller clusters are reduced, whereas larger clusters appear with slightly higher frequency.
Table 1.
Cluster size distribution for UniGene and d2_cluster
| Histogram of cluster sizes | ||
| cluster size | UniGene (Rat-build 19) | d2_cluster |
|---|---|---|
| Singleton clusters | 6463 | 5189 |
| 2 | 3496 | 3298 |
| 3–4 | 3002 | 2971 |
| 5–8 | 1635 | 1602 |
| 9–16 | 491 | 531 |
| 17–32 | 111 | 127 |
| 33–64 | 21 | 27 |
| 65–128 | 3 | 8 |
| 129–256 | 3 | 2 |
| 257–512 | 1 | 0 |
| Total clusters | 15,225 | 13,756 |
To further quantify the higher join rate of d2_cluster and to assess relative quality, a subsetting analysis was executed and is summarized in Figure 1. Among all UniGene clusters, a negligible number, 60 (or <0.5% of UniGene clusters), were merges of d2 clusters. Conversely, 1078 d2_cluster groups (or ∼8% of total) are merges of UniGene clusters, and this number can serve as another measure of the more aggressive joining of d2_cluster. The average of the three estimates (8%, 10%, 20%) of increased joining is 13%. A total of 12,389 clusters (or 83% of UniGene clusters and 90% of d2 clusters) are identical between UniGene and d2_cluster indicating that although there are measurable differences in the clustering rate, the answers produced by the two algorithms are consistent on a large scale.
Figure 1.

Subsetting comparison of UniGene and d2_cluster. Cluster equivalence means that all elements in one cluster are also present in the other cluster, and vice versa. Out of 14,989 (= 15,226 − 237) original UniGene clusters and 13,755 d2 clusters, 12,389 (or 83% of UniGene clusters and 90% of d2 clusters) are equivalent. Two hundred thirty-seven UniGene clusters were not considered in the analysis because they were composed of sequences that were screened out in our vector and repetitive elements screening stage.
There are several situations that could cause sequence members of a single (d2_cluster/UniGene) generated cluster to appear in several different clusters generated by the other method. Possibilities include (1) the failure of one method to join a valid cluster that was generated with the other method, (2) the introduction of a false join by one of the methods, or (3) the use of different clustering criterion by the methods. For example, UniGene uses clone information to augment EST sequence clustering, whereas d2_cluster uses no annotation or source information. An example of a cluster formed by d2_cluster that was fragmented into two UniGene clusters is given in Figure 2. The JAVA program CRAWview (Chow and Burke 1999) generates the color cluster representation (Fig. 2A). From the CRAW report shown in Figure 2A and the sequence alignment given in Figure 2B (online supplement to this article, www.genome.org and www.pangeasystems.com), it can clearly be seen that the elements of two distinct UniGene clusters (Rn.8 and Rn.3110) should probably be together as they are >98% identical over their entire lengths. Figure 3 gives another, more interesting case of a d2 cluster that contains isozymes of the rat cytochrome P-450 gene with membership corresponding to seven separate UniGene clusters. d2_cluster has put all of these sequences together because of regions of high identity (as seen in Fig. 3B included in the online supplement to this article). UniGene has separated isozymes into distinct clusters, although UniGene clusters Rn.18603, Rn.10842, and Rn.9104 should probably form a single cluster according to reasonable clustering rules due to their perfect assembly into subgroup 2 and high overlap (full alignment is not shown but is available from the authors upon request).
Figure 2.
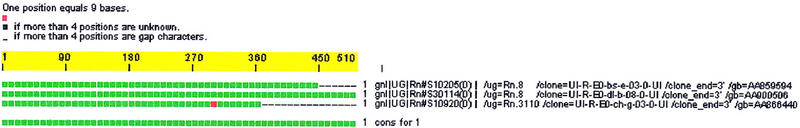
(A) CRAW report (Burke et al. 1998) for a cluster formed by d2_cluster that contains two UniGene clusters: Rn.8 and Rn.3110. (B) (Available as on online supplement to this paper at www.genome.org and at the authors web site at www.pangeasystems.com) Interleaved sequence alignment shows a >300-bp region of near perfect match.
Figure 3.
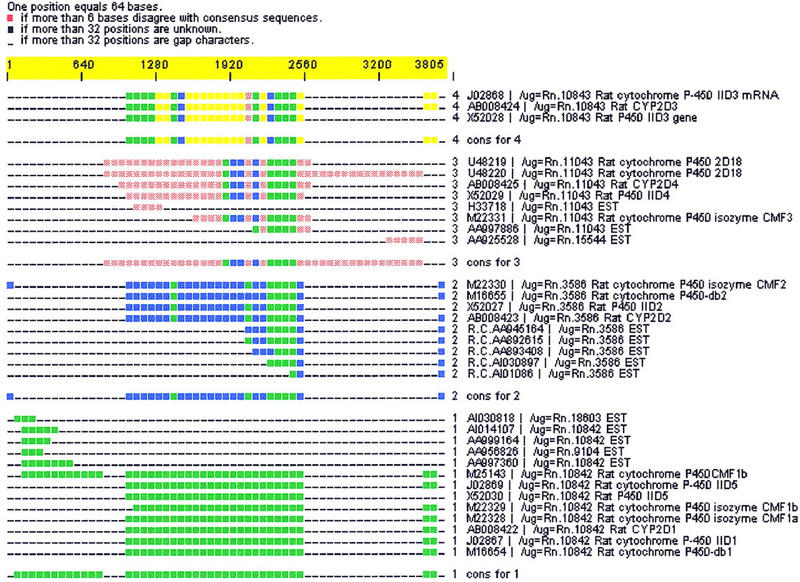
(A) CRAW report for a d2 cluster containing isozymes of mouse cytochrome P-450. Seven UniGene clusters (Rn.10843, Rn.3586, Rn.18603, Rn.10842, Rn.9104, Rn.11043, and Rn.15544) are merged. (B) (Online supplement available at www.genome.org and www.pangeasystems.com) Interleaved multiple alignment showing a region of 240 bases with high identity alignment between all four cluster assemblies. d2_cluster has put all of these sequences together because of regions of high identity (as seen in Fig. 3B). UniGene has separated isozymes into distinct clusters, although UniGene clusters Rn.18603, Rn.10842, and Rn.9104 should probably form a single cluster according to reasonable clustering rules due to their perfect assembly into subgroup 1 and high overlap.
Estimating the Absolute Error Rate
Although a comparison of d2_clustering with UniGene can compare the relative efficiency of the two clustering methods and can demonstrate the tendency of d2_cluster to partition sets into fewer classes than UniGene, no information about the absolute correctness of either clustering method can be inferred. To gauge absolute upper bounds for the error rates of d2_cluster, we performed two rigorous analyses of the groups formed by d2_cluster to analyze sensitivity and selectivity (or, more precisely, to estimate upper bounds for the actual type I and type II errors).
In hypothesis testing the type II error rate is the probability of incorrectly rejecting the null hypothesis when it is true. We define the null hypothesis to be that any two sequences do not belong in the same cluster. In this case the type II error, in the context of sequence clustering, is the probability of placing two sequences into the same cluster by mistake, or, in other words, the probability of over clustering. We say that the presence of a type II error can be discounted in cases in which a single, high-quality assembly can represent the cluster in which overlap satisfies the matching criterion. At this point it must be noted that there are caveats to this error analysis. For example, there are biological reasons, such as gene paralogs, that ESTs that are actually from distinct genes might be perfectly alignable. Some situations, such as alternative splicing, require that more than a single consensus represent the entire cluster. In such cases, type II error can be excluded if the cluster consensi can be shown to contain sufficiently large domains of identity with each other. The Rat EST clusters formed by d2_cluster were aligned and analyzed with CRAW (Burke et al. 1998), a program that creates a minimal number of high-quality consensus representatives for a cluster and discriminates and models alternative gene forms. Because CRAW provides a control of the variability between a consensus and its member sequences and enforces a minimum overlap criterion, no type II errors should occur in the clusters that are represented by a single consensus. We set CRAW stringency such that the alignment of a sequence with the subcluster consensus contained no window of 50 bases with >10% mismatch.
Following the strategy outlined above, we empirically estimate an upper bound on this error by bounding by above the number of clusters with type II errors. After processing the 13,755 clusters formed by d2_cluster, all but 1617 can be represented by a single CRAW consensus sequence. Thus, an initial upper bound for the type II error rate is 11.8% (=100 * 1617/13,755). A more stringent upper bound was obtained by inspection of the multiple alignments of the 1617 clusters with multiple CRAW consensi to identify cases in which multiple alignments of the different consensi still contained a window of 100 bases with at least 90% identity. Fewer than 106 clusters could not easily be confirmed to satisfy this constraint. Hence, the type II error is bounded by above, for this data set, by 0.8% (=100 * 106/13,755). These 106 cases are most likely not all errors on the part of d2_cluster, and many are surely examples of where the multiple alignment algorithm and CRAW failed to identify existing sequence identities. Therefore, improvements to the multiple alignment would most likely result in an even lower upper bound.
To formulate bounds for the type I error (or the probability of not joining sequences that belong together), we perform an all versus all comparison of the cluster members with a Smith–Waterman algorithm. If one accepts that Smith–Waterman is an absolute method of identifying pairwise sequence overlap within defined constraints, then the true cases of type I error would be a subset of all intercluster similarities identified by Smith–Waterman. Fifty-one intercluster matches exist for the rat data set. Because type I errors are a subset of this, the type I error rate is <0.4% (=100 * 51/13,755). As in the type II error analysis, this bound could be sharpened if we were to inspect the 51 cases individually.
DISCUSSION
We have characterized d2_cluster and described the algorithm in terms that should be familiar to statisticians, computer scientists, and biologists alike. It has been shown that d2_cluster performs quite favorably to, and is consistent with, current EST clustering methods. In an empirical study based on >40,000 available rat EST and mRNA sequences, d2_cluster produced results that were between 83% and 90% identical with UniGene although d2_cluster created 10% fewer clusters and 20% fewer singleton clusters than UniGene. Three different measures of joining strength are used to compare the overall sensitivity of d2_cluster and UniGene, and these numbers are averaged to provide an estimate that d2_cluster joins sequences at a rate ∼13% higher than UniGene. It remains undetermined, however, if this higher join rate results in more accurate index classes or is simply due to the joining of paralogous genes or other phenomena. Additionally, the absolute correctness of groups formed by d2_cluster has been quantified, and the sensitivity and selectivity are shown to be >99% (i.e., type I and type II error rates are bounded above by 1%).
d2_cluster has found application in the STACK project (Hide et al. 1997) in which ESTs are hierarchically clustered within tissue and arbitrary source categories. d2_cluster is set to join ESTs that are >96% identical over a window of 150 bases. More detail on STACK is given elsewhere (R.T. Miller, A.G. Christoffels, C. Gopalakrishnan, J. Burke, A.A. Ptitsyn, T.R. Broveak, and W.A. Hide, in prep.).
Unfortunately, space limitations prevent elaboration of the many other tools for sequence clustering that have been developed to cluster DNA sequence or to remove redundancies from sequence sets (Houlgatte et al. 1995; Parsons 1995; Grillo et al. 1996; Gill et al. 1997; Eckman et al. 1998; Yee and Conklin 1998; Pietu et al. 1999). Significant research has also been put into the grouping of protein sequence and the determination of domain boundaries (Sonnhammer and Kahn 1994; Worley et al. 1995; Sonnhammer et al. 1997; Gracy and Argos 1998a,b).
Sequence clustering is of little consequence in and of itself, and the prime motivation is to obtain biological knowledge. Effective sequence clustering is an organizing principle that serves as a starting point for discovery. For example, with all sequence information corresponding to a single gene in a cluster, features such as alternative exons and aberrant splicing, among others, can be modeled with greater ease. It is difficult to tune the parameters of primary sequence clustering such that features like splicing differences and even artifacts, such as chimerism, are accounted for while simultaneously generating proper index classes. Instead, decoupling this feature detection and artifact correction from the clustering step allows these problems to be handled in a more robust fashion. Hence, postprocessing steps, such as CRAW, are used to contrast gene variants and correct for artifact. Figure 4 shows how ESTs and mRNAs from a cluster of human sequences corresponding to human RAD1/REC1 cell-cycle control checkpoint protein are placed in the same cluster, whereas CRAW is used to separate distinct splice variants into separate subclusters. In a similar fashion, CRAW is also used to isolate and correct for chimeric sequence and other artifacts. Full details and additional examples are found in previous work (Burke et al. 1998; Chow and Burke 1999). Work has also been done to associate discovered multiple gene forms with sequence source information to infer state specificity or associate novel exon/UTR usage with disease (Burke et al. 1998; Gautheret et al. 1998). The d20 algorithm and others specified here are available at no cost for university researchers, and commercial licenses are available (details available from authors upon request). The commercial versions of CRAW and CRAWview (www.pangeasystems.com) were used in the preparation of this manuscript.
Figure 4.
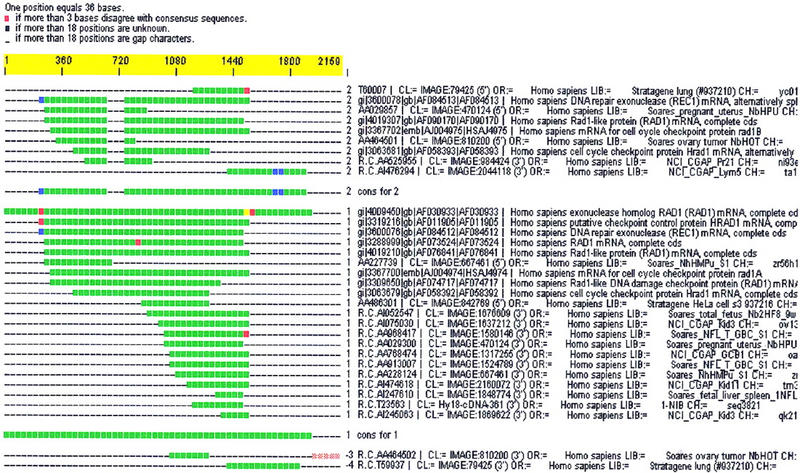
Alternative splice forms of the RAD1/REC1 gene are placed in the same cluster by d2_cluster, and the splice variants are separated into distinct subclusters by CRAW.
Footnotes
E-MAIL jburke@pangeasystems.com; FAX (510) 628-0108.
REFERENCES
- Adams MD, Kelley JM, Gocayne JD, Dubnick M, Polymeropoulos MH, Xiao H, Merril CR, Wu A, Olde B, Moreno RF, et al. Complementary DNA sequencing: Expressed sequence tags and human genome project. Science. 1991;252:1651–1656. doi: 10.1126/science.2047873. [DOI] [PubMed] [Google Scholar]
- Adams MD, Dubnick M, Kerlavage AR, Moreno R, Kelley JM, Utterback TR, Nagle JW, Fields C, Venter JC. Sequence identification of 2,375 human brain genes. Nature. 1992;355:632–634. doi: 10.1038/355632a0. [DOI] [PubMed] [Google Scholar]
- Adams MD, Kerlavage AR, Fleischmann RD, Fuldner RA, Bult CJ, Lee NH, Kirkness EF, Weinstock KG, Gocayne JD, White O, et al. Initial assessment of human gene diversity and expression patterns based upon 83 million nucleotides of cDNA sequence. Nature (Suppl.) 1995;377:3–17. [PubMed] [Google Scholar]
- Benson DA, Boguski MS, Lipman DJ, Ostell J. GenBank. Nucleic Acids Res. 1994;22:3441–3444. doi: 10.1093/nar/22.17.3441. [DOI] [PMC free article] [PubMed] [Google Scholar]
- Boguski MS, Schuler GD. ESTablishing a human transcript map. Nat Genet. 1995;10:369–371. doi: 10.1038/ng0895-369. [DOI] [PubMed] [Google Scholar]
- Boguski MS, Lowe TM, Tolstohev CM. DbEST: Database for “expressed sequence tags.”. Nat Genet. 1993;4:332–333. doi: 10.1038/ng0893-332. [DOI] [PubMed] [Google Scholar]
- Burke JP, Wang H, Hide W, Davison D. Alternative gene form discovery and candidate gene selection from gene indexing projects. Genome Res. 1998;8:276–290. doi: 10.1101/gr.8.3.276. [DOI] [PMC free article] [PubMed] [Google Scholar]
- Chow A, Burke JP. CRAWview: For viewing splicing variation, gene families, and polymorphism in clusters of ESTs and full-length sequences. Bioinformatics. 1999;15(5):376–381. doi: 10.1093/bioinformatics/15.5.376. [DOI] [PubMed] [Google Scholar]
- Eckman BA, Aaronson JS, Borkowski JA, Bailey WJ, Elliston KO, Williamson AR, Blevins RA. The Merck Gene Index Browser: An extensible data integration system for gene finding, gene characterization and EST data mining. Bioinformatics. 1998;14:2–13. doi: 10.1093/bioinformatics/14.1.2. [DOI] [PubMed] [Google Scholar]
- Gautheret D, Poirot O, Lopez F, Audic S, Claverie JM. Alternative polyadenylation in human mRNAs: A large-scale analysis by EST clustering. Genome Res. 1998;8:524–530. doi: 10.1101/gr.8.5.524. [DOI] [PubMed] [Google Scholar]
- Gill RW, Hodgman TC, Littler CB, Oxer MD, Montgomery DS, Taylor S, Sanseau P. A new dynamic tool to perform assembly of expressed sequence tages (ESTs) Comput Appl Biosci. 1997;13:453–457. doi: 10.1093/bioinformatics/13.4.453. [DOI] [PubMed] [Google Scholar]
- Gracy J, Argos P. Automated protein sequence database classification. I. Integration of compositional similarity search, local similarity search, and multiple sequence alignment. Bioinformatics. 1998a;14(2):164–173. doi: 10.1093/bioinformatics/14.2.164. [DOI] [PubMed] [Google Scholar]
- ————— Automated protein sequence database classification. II. Delineation of domain boundaries from sequence similarities. Bioinformatics. 1998b;14(2):174–187. doi: 10.1093/bioinformatics/14.2.174. [DOI] [PubMed] [Google Scholar]
- Grillo G, Attimonelli M, Liuini S, Pesole G. CLEANUP: A fast computer program for removing redundancies from nucleotide sequence databases. Comp Appl Biosci. 1996;12:1–8. doi: 10.1093/bioinformatics/12.1.1. [DOI] [PubMed] [Google Scholar]
- Hide W, Burke J, Davison D. Biological evaluation of d2, an algorithm for high-performance sequence comparison. J Comp Biol. 1994;1:199–215. doi: 10.1089/cmb.1994.1.199. [DOI] [PubMed] [Google Scholar]
- Hide W, Burke J, Christoffels A, Miller R. A novel approach towards a comprehensive consensus representation of the expressed human genome. In: Miyano S, Takagi T, editors. Genome informatics 1997. Tokyo, Japan: Universal Academy Press Inc.; 1997. pp. 187–196. [Google Scholar]
- Houlgatte R, Mariage-Samson R, Duprat S, Tesslier A, Bentolila S, Lamy B, Auffray C. The GenExpress Index: A resource for gene discovery and the genic map of the human genome. Genome Res. 1995;5:272–304. doi: 10.1101/gr.5.3.272. [DOI] [PubMed] [Google Scholar]
- Hudson TJ, Stein LD, Gerety SS, Ma J, Castle AB, Silva J, Slonim DK, Baptista R, Kruglyak L, Xu S, et al. An STS-based map of the human genome. Science. 1995;270:1945–1954. doi: 10.1126/science.270.5244.1945. [DOI] [PubMed] [Google Scholar]
- Johnson RA, Wichern DW. Applied multivariate statistical analysis. 3rd ed. Englewood Cliffs, NJ: Prentice-Hall; 1994. [Google Scholar]
- Matsubara K, Okubo K. Identification of new genes by systematic analysis of cDNAs and database construction. Curr Opin Biotech. 1993;4:672–677. doi: 10.1016/0958-1669(93)90048-2. [DOI] [PubMed] [Google Scholar]
- Miller, R.T., A.G. Christoffels, J. Burke, B.R. Karlak, A.A. Ptitsyn, T.R. Broveak, and W.A. Hide. 1999. A comprehensive approach to determination of expressed human gene sequence: The sequence tag alignment and consensus knowledge base. Genome Res. (this issue). [DOI] [PMC free article] [PubMed]
- Okubo K, Hori H, Matuba R, Niiyama T, Matsubara K. A novel system for large-scale sequencing of cDNA by PCR amplification. DNA Seq. 1991;2:137–144. doi: 10.3109/10425179109039684. [DOI] [PubMed] [Google Scholar]
- Okubo K, Hori H, Matuba R, Niiyama T, Fukushima A, Kiojima Y, Matsubara K. Large-scale cDNA sequencing analysis of quantitative and qualitative aspects of gene expression. Nat Genet. 1992;2:173–179. doi: 10.1038/ng1192-173. [DOI] [PubMed] [Google Scholar]
- Okubo K, Yoshii J, Yokouchi H, Kameyama M, Matsubara K. An expression profile of active genes in human colonic mucosa. DNA Res. 1994;1:37–45. doi: 10.1093/dnares/1.1.37. [DOI] [PubMed] [Google Scholar]
- Parsons JD. Improved tools for DNA comparison and clustering. Comp Appl Biosci. 1995;11:603–613. doi: 10.1093/bioinformatics/11.6.603. [DOI] [PubMed] [Google Scholar]
- Pearson WR. Rapid and sensitive sequence comparison with FASTP and FASTA. In: Doolittle RF, editor. Molecular evolution: Computer analysis of protein and nucleic acid sequences, methods in enzymology. San Diego, CA: Academic Press; 1990. [DOI] [PubMed] [Google Scholar]
- Pietu G, Mariage-Samsom R, Fayein NA, Matingou C, Evenco E, Houlgatte R, Decraene C, Vandenbrouck Y, Tahi F, Devegnes M, et al. The Genexpress IMAGE knowledge base of the human brain transcriptome: A prototype integrated resource for functional and computational genomics. Genome Res. 1999;9(2):195–209. [PMC free article] [PubMed] [Google Scholar]
- Schuler GD, Boguski MS, Stewart EA, Stein LD, Gyapay G, Rice K, White RE, Rodriguez-Tome P, Aggarwal A, Bajorek E, et al. A gene map of the human genome. Science. 1996;274:540–546. [PubMed] [Google Scholar]
- Sonnhammer ELL, Kahn D. Modular arrangement of proteins as inferred from analysis of homology. Protein Sci. 1994;3:482–492. doi: 10.1002/pro.5560030314. [DOI] [PMC free article] [PubMed] [Google Scholar]
- Sonnhammer ELL, Eddy SR, Durbin R. Pfam: A comprehensive database of protein families based on seed alignments. Proteins. 1997;28:405–420. doi: 10.1002/(sici)1097-0134(199707)28:3<405::aid-prot10>3.0.co;2-l. [DOI] [PubMed] [Google Scholar]
- Sutton G, White O, Adams MD, Kerlavage AR. TIGR assembler: A new tool for assembling large shotgun sequencing projects. Genome Sci Technol. 1995;1:9–18. [Google Scholar]
- Torney DC, Burkes C, Davidson D, Sirkin KM. In: Computation of d2: A measure of sequence dissimilarity, computers and DNA, SFI studies in the sciences of complexity. Bell G, Marr T, editors. VII. New York, NY: Addison-Wesley; 1990. [Google Scholar]
- Vasmatzis G, Essand M, Brinkmann U, Lee B, Pastan I. Discovery of three genes specifically expressed in human prostate by expressed sequence tag database analysis. Proc Natl Acad Sci. 1998;95(1):300–304. doi: 10.1073/pnas.95.1.300. [DOI] [PMC free article] [PubMed] [Google Scholar]
- Venter JC. Identification of new human receptor and transporter genes by high throughput cDNA (EST) sequencing. J Pharm Pharmacol (Suppl. 1) 1993;45:355–360. [PubMed] [Google Scholar]
- White O, Kerlavage AR. TDB: New databases for biological discovery. Methods Enzymol. 1996;206:27–41. doi: 10.1016/s0076-6879(96)66004-2. [DOI] [PubMed] [Google Scholar]
- Wilcox AS, Khan AS, Hopkins JA, Sikela JM. Use of 3′ untranslated sequences of human cDNAs for rapid chromosomal assignment and conversion to STSs: Inplications for an expression map of the genome. Nucleic Acids Res. 1991;19:1837–1843. doi: 10.1093/nar/19.8.1837. [DOI] [PMC free article] [PubMed] [Google Scholar]
- Worley KC, Wiese BA, Smith R. BEAUTY: An enhanced BLAST-based search tool that integrates multiple biological information resources into sequence similarity results. Genome Res. 1995;5:173–184. doi: 10.1101/gr.5.2.173. [DOI] [PubMed] [Google Scholar]
- Wu TJ, Burke JP, Davison DB. A measure of DNA sequence dissimilarity based on mahalanobis distance between frequencies of words. Biometrics. 1997;53:1431–1439. [PubMed] [Google Scholar]
- Yee DP, Conklin D. Automated clustering and assembly of large EST collections. Intell Syst Mol Biol. 1998;6:203–211. [PubMed] [Google Scholar]