

Abstract
Background. The Klotho gene plays a role in suppressing ageing-related disorders. It is suggested that activation of renin–angiotensin system (RAS) or oxidative stress suppresses Klotho in the kidney. This study evaluated the association between Klotho expression and RAS in cyclosporine (CsA)-induced renal injury.
Methods. Chronic CsA nephropathy was induced by administering CsA (30 mg/kg) to mice on a low-salt diet (LSD) for 4 weeks. A normal-salt diet (NSD) was used as the control. Reverse transcription–polymerase chain reaction, western blot and immunohistochemistry were performed for Klotho and intrarenal RAS activity was measured using immunohistochemistry for angiotensinogen and renin. Oxidative stress was measured with urinary excretion of 8-hydroxy-2′-deoxyguanosine (8-OHdG).
Results. CsA treatment decreased Klotho mRNA and protein in mouse kidney in a dose-dependent and time-dependent manner, but a concurrent treatment with losartan, an angiotensin II type 1 (AT1) receptor blocker, reversed the decrease in Klotho expression with histological improvement. This finding was more marked in the LSD than the NSD. Klotho expression was correlated with angiotensinogen and renin expression, tubulointerstitial fibrosis score and urinary 8-OHdG excretion.
Conclusions. Angiotensin II may play a pivotal role in regulating Klotho expression in CsA-induced renal injury. AT1 receptor blocker may inhibit the ageing process by decreasing oxidative stress caused by CsA.
Keywords: cyclosporine, kidney transplantation, nephrotoxicity, renin–angiotensin system, senescence
Introduction
Klotho is an anti-ageing gene that was identified by an insertional mutation in mice. Defects in Klotho result in symptoms that resemble human ageing including a short life span, infertility, arteriosclerosis, skin atrophy, osteoporosis, mitral annular calcification and emphysema [1]. In contrast, overexpression of Klotho reverses the ageing process [2], indicating that Klotho has a role in suppression of ageing and ageing-related disorders. Recent reports showed that Klotho expression is suppressed under stress conditions in several animal models [3–7] and in chronic renal failure patients [8]. Although the underlying molecular mechanisms of anti-ageing properties of Klotho are not fully understood, there is an association between Klotho and angiotensin II (AngII) in the kidney’s anti-ageing process [7].
Aside from its haemodynamic and non-haemodynamic effects [9], angiotensin II type 1 (AT1) receptor is also important in signalling pathways of the ageing process. Excessive activation of AT1 receptor by AngII is implicated in the age-related developments of hypertension, diabetes and kidney disease [10]. Mice with disrupted AT1 receptor gene live longer and have lower levels of oxidative stress than wild-type mice [11]. In addition, inhibiting renin–angiotensin system (RAS) with losartan (LSRT) or enalapril has protective effects on cardiovascular [12–16], renal [17–19], hepatic [20–23] and cerebral structures and functions [24,25] during ageing.
Chronic cyclosporine (CsA) nephropathy is a major cause of chronic allograft dysfunction and allograft failure in transplant recipients [26]. Experimental studies showed that long-term administration of CsA causes progressive renal failure with striped interstitial fibrosis, tubular atrophy, inflammatory cell infiltration and hyalinosis of the afferent arterioles [27–30], which are similar to alterations in the ageing kidney. It was reported that telomere shortening and/or upregulation of senescence-associated cell cycle inhibitors were induced in CsA-treated renal tubular cells [31] and in renal transplants with graft dysfunction [32]. However, it has not been evaluated whether Klotho is involved in the CsA-induced ageing process in the kidney.
It is well known that activated RAS is important in the pathogenesis of chronic CsA nephropathy [30,33–38]. It was hypothesized that chronic CsA nephropathy is associated with an accelerated ageing process, which is inhibited by AngII blockade. To define this hypothesis, we evaluated the renal expression of Klotho, an anti-ageing gene, as a marker of the ageing process. Understanding the regulatory mechanism of Klotho may help understand the pathogenesis of chronic CsA nephropathy and provide a new therapeutic approach for chronic allograft dysfunction in renal transplant recipients.
Materials and methods
Animals
Eight-week old male mice (Taconic Anmed, Rockville, MD) of the Institute of Cancer Research initially weighing 25–30 g, were housed in individual cages in a controlled-temperature and controlled-light environment. They were fed a normal-salt diet (NSD, 2.2% sodium, Teklad Premier, Madison, WI) or a low-salt diet (LSD, 0.01% sodium) along with tap water.
Drugs
CsA, provided by Novartis Pharma (Basel, Switzerland), was diluted in olive oil (Sigma Co., St. Louis, MO; 15 mg/mL). LSRT provided by MERCK Research Laboratories (Pahway, NJ) was dissolved in sterile water (100 mg/L).
Experimental protocols
The Animal Care Committee of the Catholic University of Korea approved the experimental protocol, and all procedures followed the University’s ethical guidelines. Five separate experiments were conducted. Each group consisted of six mice.
Protocol 1.
This experiment evaluated the role of RAS in regulating Klotho expression by salt depletion and AngII blockade. Mice were fed NSD or LSD and received drinking water with or without LSRT for 4 weeks.
Protocol 2.
This experiment evaluated the dose-dependent effect of CsA on Klotho expression. Under LSD, mice received daily administrations of olive oil (1 mg/kg) or CsA (7.5, 15 and 30 mg/kg) subcutaneously for 4 weeks.
Protocol 3.
This experiment evaluated the time-dependent effect of CsA on Klotho expression and the role of RAS in CsA-treated mouse kidneys. Under NSD or LSD, mice received daily administrations of olive oil or CsA (30 mg/kg) for 1 or 4 weeks subcutaneously. The dosage and the route of CsA administration were based on previous studies [39,40].
Protocol 4.
This experiment evaluated the effect of AngII blockade on Klotho expression in CsA-treated mouse kidneys. Under NSD or LSD, mice received daily administrations of olive oil or CsA (30 mg/kg) for 4 weeks subcutaneously. They also received drinking water with or without LSRT. The dosage and the route of administration for LSRT were based on previous reports [35].
Protocol 5.
This experiment evaluated whether decreased Klotho expression is influenced by CsA toxicity per se or is secondary to renal injury independent from CsA. Under LSD, mice underwent sham operation or 5/6 nephrectomy [41], then were given daily administrations of olive oil or CsA (30 mg/kg) for 4 weeks subcutaneously.
Measurement of basic parameters
Mice were randomly assigned to different treatment groups. Body weight (BW) was monitored daily, and systolic blood pressure (SBP) was measured at the end of the respective protocols in conscious mice by the tail-cuff method with plethysmography using a tail manometer/tachometer system (BP-2000, Visitech system, Apex, NC). Before sacrifice, animals were individually housed in metabolic cages (Techniplast, Gazzada, Italy) for 24-h urine collections. Animals were anesthetized with Zoletil 50 (10 mg/kg intraperitoneally; Vibac Laboratories, Carros, France), then blood and kidney samples were obtained [42]. Serum creatinine concentration (Scr) was measured by an enzymatic method that uses the Daiichi reagent (DaiichiPure Chemical Co. Ltd., Tokyo, Japan) on a Hitachi 7600 chemistry analyzer (Hitachi Inc., Tokyo, Japan). Creatinine clearance (ClCr) was calculated using a standard formula from 24-h urine collections and serum. The whole blood CsA level was measured by a monoclonal radioimmunoassay (Incstar Co., Stillwater, MN, USA).
Histological assessment
Tubulointerstitial fibrosis (TIF) was estimated semiquantitatively using a colour image analyser (TDI Scope Eye™ Version 3.5 for Windows, Olympus, Japan) by counting the percentage of injured areas per field of cortex under × 200 magnification [43]. Scores of 0–3 were given as follows: score 0, normal interstitium; score 0.5, < 5% TIF; score 1.0, 5–15% TIF; score 1.5, 16–25% TIF; score 2.0, 26–35% TIF; score 2.5, 36–45% TIF and score 3.0, > 45% TIF.
Western blotting
Frozen cortex kidneys were processed as described elsewhere [42,44]. A mouse-specific monoclonal rat anti-Klotho antibody, KM2076 (provided by Kyowa Hakko Kogyo Co. Ltd, Shizuoka, Japan), was used. Donkey anti-rat IgG-horseradish peroxidase conjugate (1:1000, DAKO, Tokyo, Japan) was used as a secondary antibody. Optical densities were obtained using the vehicle (VH) group as a 100% reference normalized with β-actin.
Reverse transcription–polymerase chain reaction
Total RNA was extracted using RNAzol reagent (TEL-TEST, Friendwood, TX). First strand cDNA was reverse-transcribed from RNA using random hexanucleotide primers. First Strand Synthesis Kit for reverse transcription–polymerase chain reaction (RT–PCR; Roche Diagnostics Scandinavia AB, Bromma, Sweden) using 1 μg of total RNA was used for the synthesis of cDNA. RT–PCR for Klotho/glyceraldehyde 3-phosphate dehydrogenase (GAPDH) was performed as described previously [44]. The specific PCR primers used were Klotho: forward primer 5′-CGTGAATGAGGCTCTGAAAGC-3′, reverse primer 5′-GAGCGGTCACTAAGCGAATACG-3′; GAPDH: forward primer 5′-AATGCATCCTGCACCACCAA-3′, reverse primer 5′-GTAGCCATATTCATTGTCATA-3′.
Single-labelling immunohistochemistry using pre-embedding methods
Fifty-micrometre-thick microtome sections were processed for immunohistochemistry [45] with monoclonal anti-Klotho antibody, KM2076 (1:200).
Double-labelling immunohistochemistry using post-embedding methods
Klotho was localized by double-labelling immunohistochemistry [45]. Proximal tubular cells were identified using antibody against aquaporin-1 (1:200, Chemicon International, Inc.). Connecting tubular cells and distal tubular cells were identified using antibody against calbindin D28k (1:200, Chemicon International, Inc.). Principal cells in the collecting duct were identified using antibody against aquaporin-2 (1:1000, Chemicon International, Inc.).
Single-labelling immunohistochemistry using post-embedding methods
Immunohistochemistry for renin was performed using goat polyclonal anti-renin antibody (1:1000, Santa Cruz Biotechnology, Inc.) [33]. The number of renin-positive glomeruli was counted per 50 glomeruli. Immunohistochemistry for angiotensinogen (AGT) was performed using rabbit primary antibodies against mouse/rat AGT (code no. 99666; IBL, Gumma, Japan) [46]. The sum of intensities of positive areas was averaged by the field area. Ratio was calculated relative to the NSD-VH group (arbitrary units) [46,47].
Measurement of urinary 8-hydroxy-2′-deoxyguanosine
Twenty-four hour urinary concentrations of DNA adduct urinary 8-hydroxy-2′-deoxyguanosine (8-OHdG) were determined using a competitive ELISA (Japan Institute for the Control of Aging, Shizuoka, Japan).
Statistical analysis
Data are expressed as mean ± SEM. Groups were compared using one-way ANOVA with Bonferroni’s correction (SPSS, Chicago, IL). A nonparametric (Spearman) correlation coefficient was calculated. Statistical significance was assumed as P < 0.05.
Results
Localization of Klotho in the normal mouse kidney
In Figure 1A, Klotho was expressed in the tubules of the renal cortex (a), but not in the outer medulla (b) or inner medulla (c). Double staining for Klotho and other tubular proteins (Figure 1B) showed that Klotho co-localized with calbindin D28k (b, b’) in distal tubules and connecting tubules, but not with aquaporin-1 (a, a’) or aquaporin-2 (c, c’).
Fig. 1.
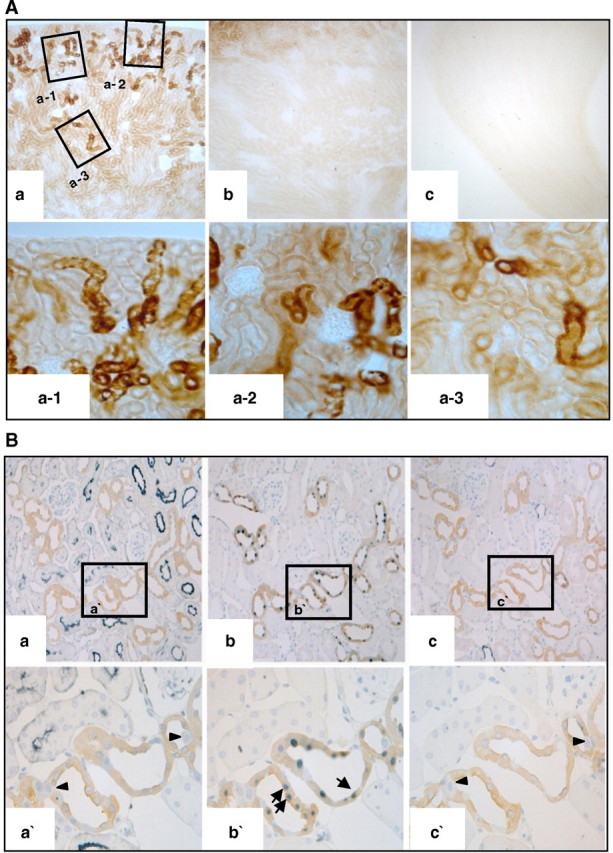
Localization of Klotho in normal mouse kidneys. (A) Immunohistochemistry for Klotho. Klotho was expressed in the tubules of the renal cortex (a; a-1, a-2, a-3), but not in the outer medulla (b) or the inner medulla (c). (B) Double staining for Klotho and other tubular proteins (a. aquaporin-1, b. calbindin D28k, c. aquaporin-2). Klotho co-localized with calbindin D28k (b; b’, arrows) in distal tubules, but not with aquaporin-1 (a; a’, arrowheads) in proximal tubules or aquaporin-2 (c; c’, arrowheads) in collecting ducts.
Comparison of Klotho expression between LSD and NSD in the normal mouse kidney
Figure 2 shows the effect of salt depletion and AngII blockade on Klotho expression in the normal mouse kidney. Klotho significantly decreased in the LSD4 group (39.4 ± 9.0%) compared with the NSD4 group (100.3 ± 7.0%) and decreased in the LSD + LSRT4 group (63.2 ± 2.8%) compared with the NSD + LSRT4 group (115.3 ± 15.2%) (P < 0.05).
Fig. 2.

Influence of salt intake and angiotensin II blockade on Klotho expression in normal mice kidneys. Western blot for Klotho. Klotho expression was significantly decreased in the low-salt diet (LSD4) group compared with the normal-salt diet (NSD4) group. The administration of losartan (LSRT) tended to increase Klotho expression both in the NSD4 and LSD4 groups. *P = 0.008 vs NSD4; **P = 0.027 vs NSD + LSRT4 (n = 6 for each group). NSD4 = normal-salt diet for 4 weeks, NSD + LSRT4 = normal-salt diet with addition of losartan for 4 weeks, LSD4 = low-salt diet for 4 weeks, LSD + LSRT4 = low-salt diet with addition of losartan for 4 weeks.
The relationship between CsA dose and Klotho or intrarenal renin expression
Figure 3 shows a dose-dependent decrease in Klotho and an increase in renin expression caused by CsA. Klotho significantly decreased in the CsA15 (82.1 ± 2.4%) and CsA30 groups (66.3 ± 1.3%) compared with the VH (100 ± 1.2%) or CsA7.5 groups (94.5 ± 1.3%) (P < 0.05; Figure 3A). Klotho expression was negatively correlated with intrarenal renin expression (r = − 0.84, P < 0.01; Figure 3C).
Fig. 3.
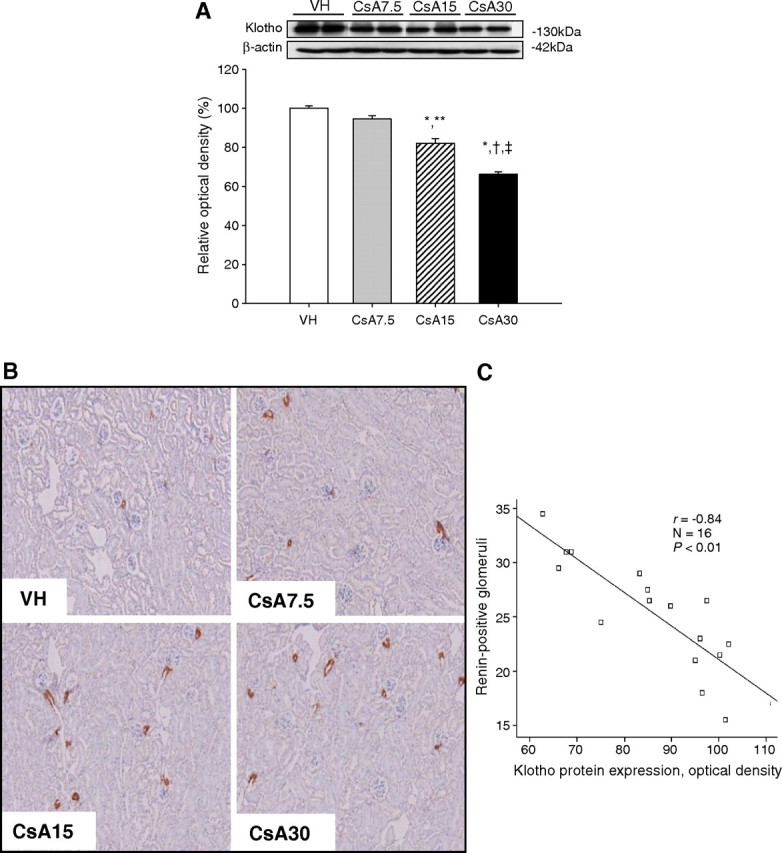
The dose-dependent effect of cyclosporine (CsA) on expression of Klotho and renin in mouse kidneys. (A) Western blot for Klotho in CsA-treated mice with different doses. The dose-dependent decrease in Klotho was significant at 15 and 30 mg/kg of CsA. (B) Representative photomicrographs of immunohistochemical staining for renin. The number of renin-positive glomeruli increased with an increase in CsA doses. (C) The association between Klotho expression and intrarenal renin expression. Klotho expression was negatively correlated with the intrarenal renin immunoreactivity (r = − 0.84, P < 0.01). *P = 0.000 vs VH, **P = 0.001 vs CsA7.5, † P = 0.000 vs CsA7.5, ‡ P = 0.000 vs CsA15 (n = 6 for each group). VH = vehicle for 4 weeks, CsA7.5 = cyclosporine (7.5 mg/kg) for 4 weeks, CsA15 = cyclosporine (15 mg/kg) for 4 weeks, CsA30 = cyclosporine (30 mg/kg) for 4 weeks.
The relationship between CsA duration and Klotho in relation to salt intake
Table 1 shows the basic parameters in relation to salt intake in mice undergoing VH and CsA treatments for 1 or 4 weeks. A significant decrease in renal function and BW was observed in the LSD-CsA4 group.
Table 1.
The time-dependent effect of cyclosporine on basic parameters
| VH1
(n = 6) |
CsA1
(n = 6) |
VH4
(n = 6) |
CsA4
(n = 6) |
|
|---|---|---|---|---|
| NSD | ||||
| FBW (g) | 29.3 ± 1.23 | 29.63 ± 0.53 | 31.83 ± 0.6 | 34.0 ± 0.6 |
| SBP (mm Hg) | 121 ± 5 | 124 ± 3 | 126 ± 7 | 125 ± 4 |
| Scr (mg/dL) | 0.59 ± 0.04 | 0.57 ± 0.04 | 0.55 ± 0.02 | 0.55 ± 0.02 |
| ClCr (mL/min/100 g) | 0.19 ± 0.02 | 0.22 ± 0.04 | 0.21 ± 0.01 | 0.20 ± 0.03 |
| CsA level (ng/mL) | 2573 ± 179 | 2840 ± 381 | ||
| LSD | ||||
| FBW (g) | 29.3 ± 0.5 | 29.0 ± 0.4 | 35.6 ± 0.5a,b | 28.5 ± 0.8c |
| SBP (mm Hg) | 119 ± 5 | 123 ± 6 | 125 ± 4C | 126 ± 7 |
| Scr (mg/dL) | 0.60 ± 0.02 | 0.59 ± 0.02 | 0.54 ± 0.03 | 0.70 ± 0.05d |
| ClCr (mL/min/100 g) | 0.26 ± 0.02 | 0.24 ± 0.01 | 0.24 ± 0.03 | 0.13 ± 0.03e |
| CsA level (ng/mL) | 2430 ± 198 | 2160 ± 367 |
FBW, final body weight; SBP, systolic blood pressure; Scr, serum creatinine concentration; ClCr, creatinine clearance.
VH1 = vehicle for 1 week, CsA1 = cyclosporine for 1 week, VH4 = vehicle for 4 weeks, CsA4 = cyclosporine for 4 weeks.
P = 0.000 vs VH1.
P = 0.000 vs CsA1.
P = 0.000 vs VH4.
P = 0.004 vs VH4.
P = 0.000 vs VH4.
Figure 4 shows a time-dependent decrease in Klotho mRNA and protein caused by CsA. In NSD mice, Klotho mRNA decreased in the CsA1 group (93.8 ± 1.1%) compared with VH1 group (99.1 ± 1.1%) and further decreased in the CsA1 group (77.7 ± 1.6%) compared with VH1, VH4 (96.0 ± 1.0%) or CsA1 groups (P < 0.05; Figure 4A). In LSD mice, Klotho mRNA markedly decreased in CsA1 group (50.9 ± 2.0%) compared with VH1 group (95.0 ± 2.6%) and further decreased in the CsA4 group (25.6 ± 1.1%) compared with VH1, VH4 (69.8 ± 2.2%) or CsA1 groups (P < 0.05; Figure 4B). In NSD mice, Klotho significantly decreased in the CsA4 group (70.6 ± 2.2%) compared with VH1 (96.6 ± 1.3%), VH4 (94.1 ± 2.2%) or CsA1 groups (95.4 ± 1.8%, P < 0.05; Figure 4C). In LSD mice, Klotho significantly decreased in the CsA1 group (77.1 ± 2.2%) compared with VH1 group (98.2 ± 0.9%) and further decreased in the CsA4 group (33.9 ± 2.3%) compared with VH1, VH4 (93.8 ± 2.4%) or CsA1 groups (P < 0.05; Figure 4D).
Fig. 4.

The time-dependent effect of cyclosporine (CsA) on Klotho mRNA and protein expression in the mouse kidney. (A) RT–PCR for Klotho mRNA in CsA-treated mice on the normal-salt diet (NSD). Klotho mRNA expression was significantly decreased by CsA treatment for 1 week and further decreased by CsA treatment for 4 weeks. (B) RT–PCR for Klotho mRNA in CsA-treated mice on the low-salt diet (LSD). The time-dependent decrease in Klotho mRNA was more apparent in the LSD mice than the NSD mice. (C) Western blot for Klotho in CsA-treated mice on the NSD. CsA treatment for 1 week did not significantly decrease Klotho expression, but CsA treatment for 4 weeks did. (D) Western blot for Klotho in CsA-treated mice on the LSD. The time-dependent decrease in Klotho was significant after CsA treatment for 1 week and was more apparent in the LSD mice than the NSD mice. *P = 0.033 vs VH1, **P = 0.000 vs VH1, #P = 0.000 vs CsA1, † P = 0.000 vs VH4 (n = 6 for each group). VH1 = vehicle for 1 week, CsA1 = cyclosporine for 1 week, VH4 = vehicle for 4 weeks, CsA4 = cyclosporine for 4 weeks.
Figure 5 shows the immunohistochemistry for Klotho in the CsA1-treated mice. Among NSD mice, CsA1 group showed minimal change in Klotho expression, but the CsA4 group showed a marked decrease (Figure 5A). Among LSD mice, Klotho markedly decreased in the CsA1 group and almost completely abolished in the CsA4 group (Figure 5B).
Fig. 5.
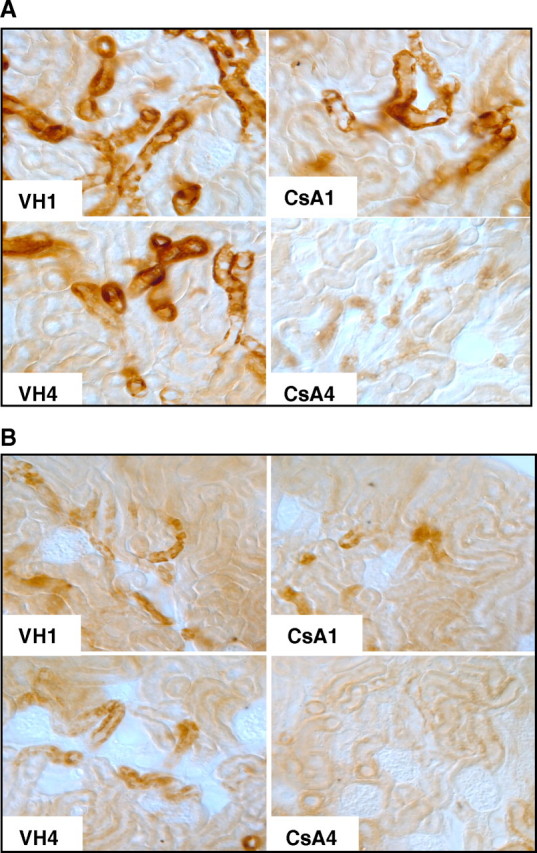
Immunohistochemical findings for Klotho expression under cyclosporine (CsA) treatment in relation to salt intake. (A) Immunohistochemistry for Klotho in CsA-treated mice on the normal-salt diet. CsA treatment for 1 week minimally decreased and CsA treatment for 4 weeks markedly decreased Klotho expression. (B) Immunohistochemistry for Klotho in CsA-treated mice on the low-salt diet. CsA treatment for 1 week markedly decreased Klotho expression, while CsA treatment for 4 weeks almost completely abolished expression (n = 6 for each group). VH1 = vehicle for 1 week, CsA1 = cyclosporine for 1 week, VH4 = vehicle for 4 weeks, CsA4 = cyclosporine for 4 weeks.
Effect of AngII blockade on Klotho expression in relation to salt intake in chronic CsA nephropathy
Table 2 shows the basic parameters in relation to salt intake in mice undergoing CsA and LSRT treatment for 4 weeks. Among the NSD mice, the CsA + LSRT4 group showed significantly decreased ClCr in comparison to the VH + LSRT4 group. Among the LSD mice, the CsA + LSRT4 group showed significantly decreased BW and increased Scr compared with the VH4, VH + LSRT4 or CsA4 groups. There was no difference in SBP among these groups.
Table 2.
The effect of angiotensin II blockade on basic parameters in vehicle- and cyclosporine-treated mice
| VH4
(n = 6) |
VH + LSRT4
(n = 6) |
CsA4
(n = 6) |
CsA + LSRT4
(n = 6) |
|
|---|---|---|---|---|
| NSD | ||||
| FBW (g) | 31.8 ± 0.6 | 34.8 ± 1.2 | 34.0 ± 0.6 | 33.4 ± 1.1 |
| SBP (mm Hg) | 125 ± 7 | 123 ± 9 | 125 ± 6 | 127 ± 10 |
| Scr (mg/dL) | 0.55 ± 0.02 | 0.54 ± 0.03 | 0.55 ± 0.02 | 0.63 ± 0.03 |
| ClCr (mL/min/100 g) | 0.21 ± 0.01 | 0.34 ± 0.06 | 0.20 ± 0.03 | 0.16 ± 0.01a |
| CsA level (ng/mL) | 2350 ± 293 | 2775 ± 347 | ||
| LSD | ||||
| FBW (g) | 36.6 ± 0.7 | 34.6 ± 1.6 | 35.7 ± 1.3 | 29.3 ± 1.1b,c,d |
| SBP (mm Hg) | 124 ± 3 | 121 ± 7 | 127 ± 9 | 124 ± 7 |
| Scr (mg/dL) | 0.60 ± 0.02 | 0.64 ± 0.04 | 0.66 ± 0.02 | 0.84 ± 0.06e,f,g |
| ClCr (mL/min/100 g) | 0.35 ± 0.17 | 0.17 ± 0.01 | 0.14 ± 0.01 | 0.11 ± 0.01 |
| CsA level (ng/mL) | 2097 ± 380 | 2590 ± 352 |
FBW, final body weight; SBP, systolic blood pressure; Scr, serum creatinine concentration; ClCr, creatinine clearance.
VH4 = vehicle for 4 weeks, VH + LSRT4 = vehicle + losartan for 4 weeks, CsA4 = cyclosporine for 4 weeks, CsA + LSRT4 = cyclosporine + losartan for 4 weeks.
P = 0.04 vs VH + LSRT4.
P = 0.001 vs VH4.
P = 0.016 vs VH + LSRT4.
P = 0.003 vs CsA4.
P = 0.001 vs VH4.
P = 0.007 vs VH + LSRT4.
P = 0.021 vs CsA4.
Figure 6 shows the effect of AngII blockade on Klotho in chronic CsA nephropathy. In NSD mice, Klotho significantly decreased in the CsA4 group (74.3 ± 2.6%) compared with VH4 (100.2 ± 3.8%) or VH + LSRT4 groups (98.7 ± 3.5%) and increased in the CsA + LSRT4 group (124.2 ± 2.9%) compared with CsA4 group (P < 0.05; Figure 6A). The LSD mice showed a more apparent effect of LSRT than the NSD mice. In LSD mice, Klotho markedly decreased in the CsA4 group (34.5 ± 6.6%) compared with VH4 (100.7 ± 7.5%) or VH + LSRT4 groups (116.1 ± 8.4%) and increased in the CsA + LSRT4 group (120.2 ± 16.9%) compared with the CsA4 group (P < 0.05; Figure 6B).
Fig. 6.
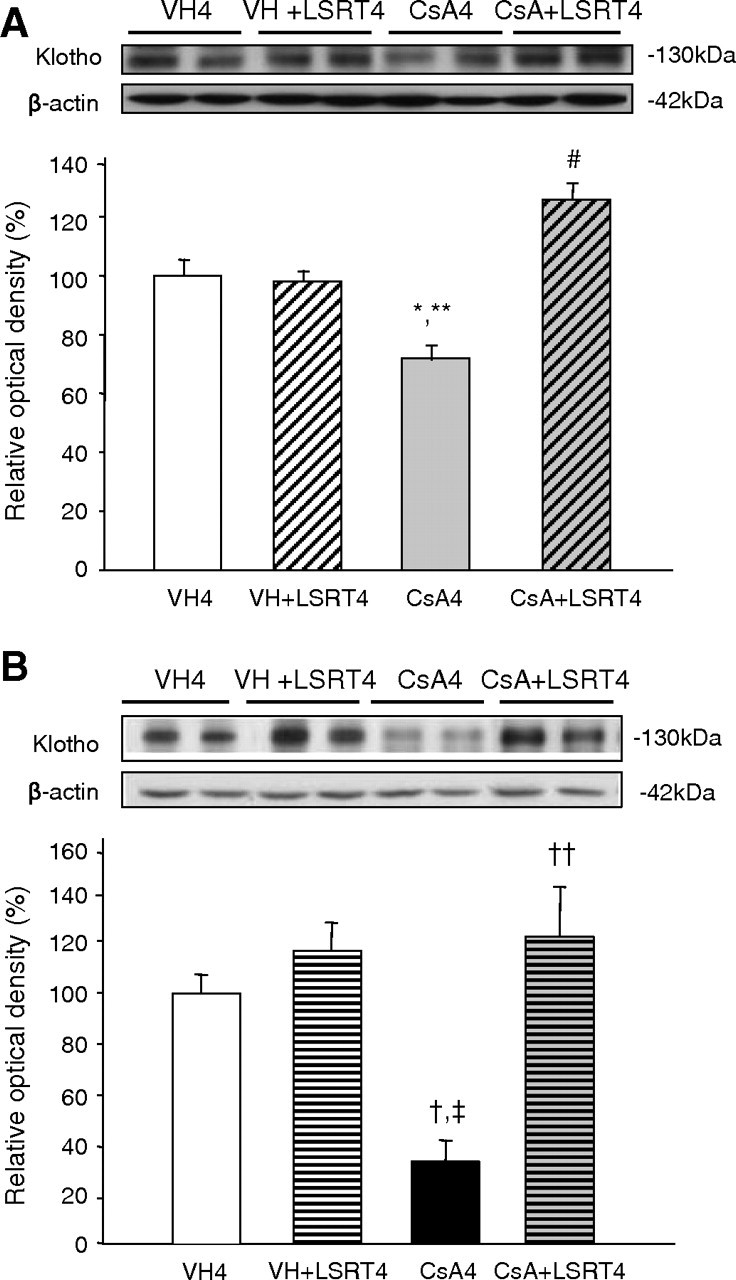
The effect of angiotensin II blockade on Klotho expression in cyclosporine (CsA)-treated mice in relation to salt intake. (A) Western blot for Klotho in CsA-treated mice on the normal-salt diet (NSD). Klotho expression was significantly decreased by CsA treatment for 4 weeks compared with the VH4 group and VH + LSRT4 group. With the concurrent administration of losartan (LSRT), Klotho expression was significantly increased compared with the CsA4 group. (B) Western blot for Klotho in CsA-treated mice on the low-salt diet (LSD). The decrease in Klotho expression caused by CsA treatment and the increase caused by concurrent administration of LSRT were more apparent in mice on the LSD than those on the NSD. *P = 0.032 vs VH4, **P = 0.047 vs VH + LSRT4, #P = 0.001 vs CsA4, † P = 0.003 vs VH4, ‡ P = 0.000 vs VH + LSRT4, †† P = 0.000 vs CsA4 (n = 6 for each group). VH4 = vehicle for 4 weeks, VH + LSRT4 = vehicle + losartan for 4 weeks, CsA4 = cyclosporine for 4 weeks, CsA + LSRT4 = cyclosporine + losartan for 4 weeks.
The association between TIF and Klotho expression in chronic CsA nephropathy
Characteristic lesions of chronic CsA nephropathy were observed in the CsA4 group on the LSD (Figure 7A). The TIF score significantly increased in the CsA4 group (0.9 ± 0.1) compared with VH4 (0 ± 0) or VH + LSRT4 groups (0 ± 0) and decreased in the CsA + LSRT4 group (0.4 ± 0.1) compared with CsA4 group (P < 0.05; Figure 7B). Klotho expression was negatively correlated with the TIF score (r = 0.69, P < 0.01; Figure 7C).
Fig. 7.
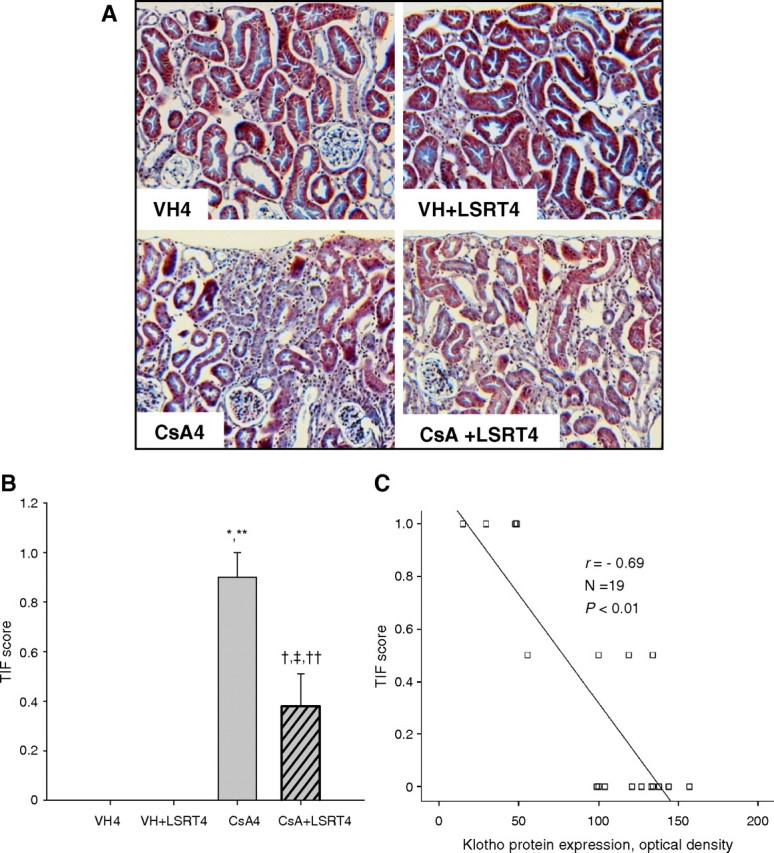
The association between tubulointerstitial fibrosis (TIF) and Klotho expression in chronic cyclosporine (CsA) nephropathy. (A) Histological findings in CsA- and losartan (LSRT)-treated mice on the low-salt diet. CsA-treated mice at 4 weeks showed diffuse interstitial fibrosis, mononuclear cell infiltrates and tubular atrophy. The administration of LSRT dramatically decreased this damage. Magnification, × 200. (B) Semiquantitative analysis of TIF in CsA- and LSRT-treated mice. The TIF score was significantly increased by CsA treatment and decreased by the concurrent administration of LSRT. (C) The association between Klotho expression and TIF score. Klotho expression was negatively correlated with the TIF score (r = − 0.69, P < 0.01). *P = 0.000 vs VH4, **P = 0.000 vs VH + LSRT4, † P = 0.016 vs VH4, ‡ P = 0.016 vs VH + LSRT4, †† P = 0.001 vs CsA4 (n = 5 for VH4, VH + LSRT4 and CsA4 groups; n = 4 for CsA + LSRT4 group). VH4 = vehicle for 4 weeks, VH + LSRT4 = vehicle + losartan for 4 weeks, CsA4 = cyclosporine for 4 weeks, CsA + LSRT4 = cyclosporine + losartan for 4 weeks.
The association between intrarenal AGT activity and Klotho expression in chronic CsA nephropathy
The immunoreactivity for AGT was enhanced by CsA and reduced by LSRT, which was more apparent in the LSD mice than the NSD mice (Figure 8A). The LSD-CsA4 group (19.2 ± 5.1) showed significantly greater AGT immunoreactivity than all NSD groups and the LSD-VH4 (1.5 ± 0.4) or LSD-VH + LSRT4 groups (0.7 ± 0.2) (P < 0.05; Figure 8B). Concurrent LSRT administration markedly reduced AGT immunoreactivity (0.8 ± 0.2, P < 0.05) compared with the CsA4 group. Klotho expression was negatively correlated with AGT expression (r = − 0.77, P < 0.01; Figure 8C).
Fig. 8.
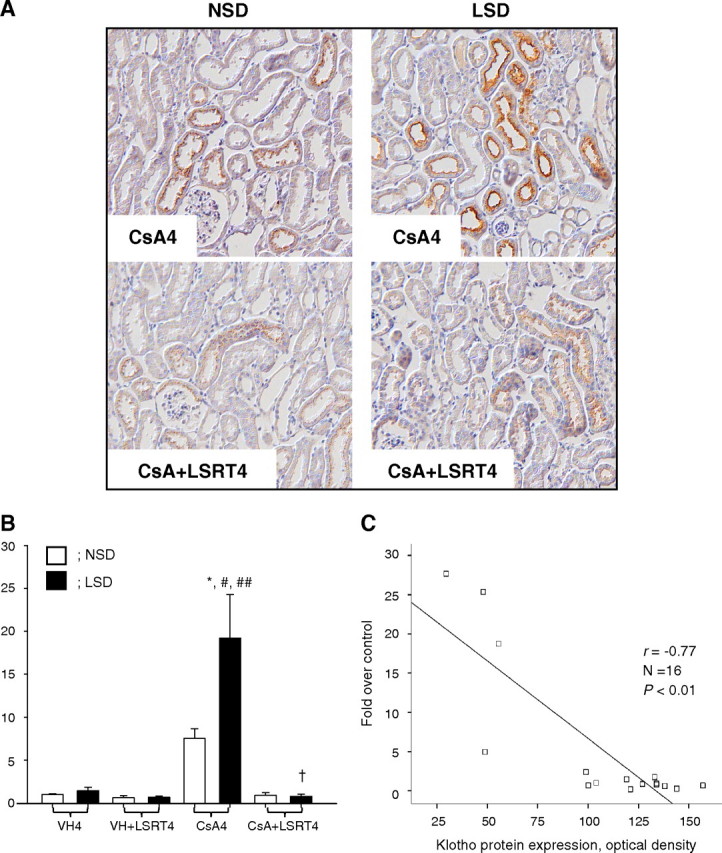
The association between angiotensinogen (AGT) expression and Klotho expression in chronic cyclosporine (CsA) nephropathy. (A) Representative photomicrographs of immunohistochemical staining for AGT. In every case, immunoreactive areas were confined to mostly cortical brush border-rich tubules (proximal tubules). In the CsA4 group on the normal-salt diet (NSD), immunoreactivity for AGT was enhanced over the VH4 group. This increase was more prominent in mice on the low-salt diet (LSD) than those on the NSD. In the CsA + LSRT4 group, the concurrent administration of losartan (LSRT) reduced the immunoreactivity for AGT compared with the CsA4 groups, on both the NSD and the LSD. Magnification, × 200. (B) Semiquantitative analysis of the intensity of intrarenal AGT immunoreactivity. On the NSD, CsA treatment increased intrarenal AGT immunoreactivity compared with the VH4 group, and the concurrent administration of LSRT decreased it compared with the CsA4 group, although this was not significant. The CsA4 group on the LSD showed a significantly greater AGT immunoreactivity than all groups on the NSD, as well as the VH and VH + LSRT4 groups on the LSD. Concurrent LSRT administration markedly decreased AGT expression compared with the CsA4 group. (C) The association between Klotho expression and AGT immunoreactivity. Klotho expression was negatively correlated with the AGT immunoreactivity (r = − 0.77, P < 0.01). *P < 0.05 vs NSD, #P = 0.000 vs VH4, ##P = 0.000 vs VH + LSRT4, † P = 0.000 vs CsA4 (n = 4 for each group). VH4 = vehicle for 4 weeks, VH + LSRT4 = vehicle + losartan for 4 weeks, CsA4 = cyclosporine for 4 weeks, CsA + LSRT4 = cyclosporine + losartan for 4 weeks.
The association between oxidative stress and Klotho expression in chronic CsA nephropathy
Urinary 8-OHdG excretion was measured as a marker of oxidative DNA damage [48]. In NSD mice, CsA tended to increase the excretion and LSRT tended to decrease it. In LSD mice, the excretion significantly increased in the CsA4 group (35.2 ± 8.5 ng/day) compared with VH4 (10.5 ± 2.3 ng/day) or VH + LSRT4 groups (12.2 ± 1.1 ng/day) and decreased in the CsA + LSRT4 group (14.8 ± 3.8 ng/day) compared with the CsA4 group (P < 0.05; Figure 8A). Klotho expression was negatively correlated with urinary 8-OHdG excretion (r = − 0.64, P < 0.01; Figure 9B).
Fig. 9.
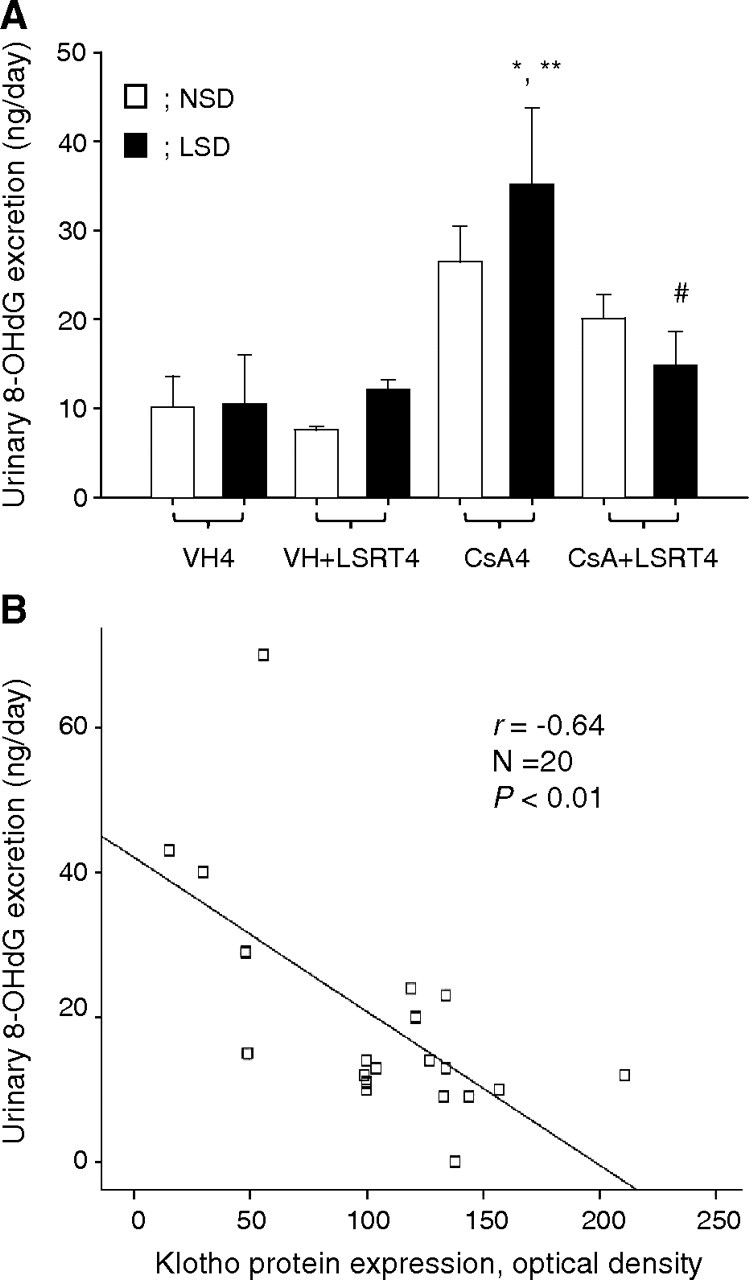
The association between oxidative stress and Klotho expression in chronic cyclosporine (CsA) nephropathy. (A) The urinary 8-hydroxy-2′-deoxyguanosine (8-OHdG) excretion of CsA- and losartan (LSRT)-treated mice in relation to salt intake. The urinary 8-OHdG excretion in the CsA4 group was higher than that in the VH4 group, and this was more significant in mice on the low-salt diet (LSD) than those on the normal-salt diet (NSD). The concurrent administration of LSRT significantly decreased urinary 8-OHdG excretion compared with the CsA4 group, in mice on the LSD. (B) The association between Klotho expression and urinary 8-OHdG excretion. Klotho expression was negatively correlated with the urinary 8-OHdG level (r = − 0.64, P < 0.01). *P = 0.003 vs VH4, **P = 0.006 vs VH + LSRT4, #P = 0.026 vs CsA (n = 5 for each group). VH4 = vehicle for 4 weeks, VH + LSRT4 = vehicle + losartan for 4 weeks, CsA4 = cyclosporine for 4 weeks, CsA + LSRT4 = cyclosporine + losartan for 4 weeks.
Klotho expression in renal insufficiency with or without CsA
Figure 10 shows the effect of CsA in nephrectomized mice. Klotho significantly decreased in Sham + CsA group (41.0 ± 5.2%) compared with Sham group (111.3 ± 11.3%) and further decreased in 5/6NX + CsA group (9.2 ± 4.3%) compared with Sham, Sham + CsA or 5/6NX groups (33.7 ± 7.1%) (P < 0.05).
Fig. 10.

Klotho expression in renal insufficiency with or without cyclosporine (CsA). Klotho expression significantly decreased in Sham + CsA and 5/6NX groups compared to Sham group and further decreased in 5/6NX + CsA group compared to the other three groups. *P = 0.000 vs Sham, #P = 0.001 vs Sham + CsA, † P = 0.004 vs 5/6NX (n = 6 for each group). Sham = sham operation and vehicle treatment for 4 weeks, Sham + CsA = sham operation and CsA treatment for 4 weeks, 5/6NX = 5/6 nephrectomy and vehicle treatment for 4 weeks, 5/6NX + CsA = 5/6 nephrectomy and CsA treatment for 4 weeks.
Discussion
It was initially hypothesized that CsA-induced renal injury accelerates the ageing process in the kidney and that the inhibition of RAS may alleviate this. To test this hypothesis, the Klotho gene was used as a marker of an anti-ageing process. The results clearly demonstrate that CsA-induced renal injury decreases Klotho expression and that RAS blockade with LSRT restores Klotho expression in chronic CsA nephropathy. These results suggest that long-term CsA treatment may accelerate the ageing process and that AngII blockade may inhibit the ageing process in chronic CsA nephropathy.
To evaluate the association between Klotho and RAS, Klotho expression was compared between NSD and LSD in normal mice. The results showed that Klotho was significantly decreased by salt depletion, while increased by LSRT (Figure 2). Similar results were observed in CsA-treated mice. Klotho mRNA and protein were significantly decreased by CsA, and a more profound effect was observed in salt depletion (Figures 4 and 5). LSRT treatment restored Klotho in CsA-induced renal injury, and a more profound effect was observed in salt depletion (Figure 6). This finding suggests that Klotho expression is influenced by RAS in both normal and CsA-treated mice and that AngII blockade is effective in restoring Klotho expression in chronic CsA nephropathy. The association of Klotho with CsA was further evaluated by administering different doses of CsA, which revealed that CsA decreased Klotho in a dose-dependent manner (Figure 3). This finding suggests that CsA-induced renal injury is closely associated with activated RAS and that Klotho expression is affected by RAS in chronic CsA nephropathy.
An additional study in a remnant kidney model was performed with or without CsA to further evaluate whether decreased Klotho expression depends upon CsA toxicity per se or whether it is secondary to renal injury independent from CsA. The results showed that Klotho decreased in nephrectomized mice, while additional treatment of CsA further decreased it (Figure 10). This finding suggests that a reduction in Klotho depends upon CsA toxicity per se and that it is not a secondary change independent from CsA.
Intrarenal renin and AGT expression were measured as markers of intrarenal RAS activity. The renin immunoreactivity was increased by CsA dose dependently (Figure 3). The AGT immunoreactivity was enhanced by CsA and reduced by LSRT, which was more evident in salt depletion (Figure 8). Furthermore, Klotho expression was negatively correlated with renin and AGT expression. These results suggest that CsA activates the intrarenal RAS, which is closely associated with Klotho expression in CsA-induced renal injury. This presumption may be supported by a previous report that showed AngII downregulated Klotho mRNA expression in mouse internal medulla collecting duct cells [49].
The present study suggests that chronic CsA nephropathy downregulates Klotho via activation of RAS, but it is uncertain whether decreased Klotho expression is caused by a direct toxicity of CsA or if it is mediated by the RAS. Reports showed that oxidative stress downregulates Klotho in mouse kidney cells [50], and a free radical scavenger suppresses the AngII-induced downregulation of Klotho [51]. Like AngII, CsA induces lipid peroxidation in rat kidney and liver microsomes [52,53]. In Figure 9, the urinary 8-OHdG excretion increased with CsA and decreased with LSRT. Furthermore, Klotho expression correlated negatively with 8-OHdG excretion. Together, these results suggest that oxidative stress caused by AngII or CsA may downregulate Klotho. Thus, there may be two different kinds of renal injury in this model: both CsA-mediated and AngII-mediated renal injury may decrease Klotho expression by inducing oxidative stress. CsA causes oxidative stress to renal tubular cells, which leads to interstitial fibrosis [30]. Recently, Klotho was found to activate the FoxO forkhead transcription factors that are negatively regulated by insulin/IGF-1 signalling. This, in turn, facilitates removal of reactive oxygen species and confers oxidative stress resistance by inducing expression of manganese superoxide dismutase. Thus, Klotho-induced inhibition of insulin/IGF-1 signalling is associated with an increased resistance to oxidative stress, which potentially contributes to the anti-ageing properties [54]. As recent reports show, calcineurin [55] or FKBP39 [56] is associated with FoxO expression, and CsA-induced downregulation of Klotho may accelerate TIF through oxidative stress by inhibiting FoxO activity.
In Figure 1, Klotho was predominantly expressed in distal and connecting tubular cells as in accordance with previous reports [1,57]. This finding suggests that the role of Klotho is limited to the specific function of these tubules. However, Klotho has systemic effects [58]. It was shown that the extracellular domain of Klotho protein is secreted into the blood and functions as a humoral factor [2]. This explains how Klotho may protect the kidney and improve renal function beyond protecting the tubules where it is localized.
This study has some limitations, however. First, it is uncertain whether decreased Klotho expression is related to the pathogenesis of CsA-induced renal injury. Further study using transgenic mice overexpressing Klotho is needed to clarify the results from this experiment. Second, the upregulation of Klotho by LSRT did not improve renal function (Table 2). This may be related to the dissociation between functional and morphologic changes in CsA-induced renal injury model [59] or the intrarenal haemodynamic effects of LSRT on the glomerular filtration rate [60]. Third, salt depletion activates various mediators including aldosterone and antidiuretic hormone. Therefore, the possibility that other factors may affect Klotho expression in salt depletion cannot be excluded. Fourth, it could be argued that the effect of LSRT on Klotho expression is related to its antihypertensive effect, but there was no difference in SBP between groups (Table 2).
The experimental model of chronic CsA nephropathy has two limitations. First, CsA trough levels were much higher than those targeted in clinical practice. The higher CsA level is related to the species specificity of rodents. Unlike humans, mice are resistant to CsA-induced renal injury. Therefore, salt depletion with high-dose CsA is needed to induce CsA’s morphologic consequences. Second, this study did not show that CsA decreases and LSRT increases the life span. A follow-up period longer than 4 weeks may better define the relationship between RAS and Klotho. However, the study period could not be extended because mice cannot survive beyond 4 weeks under CsA (30 mg/kg) and LSD.
In summary, this study demonstrates that Klotho expression is influenced by the intrarenal RAS activity in CsA-treated mice and that the CsA-induced reduction in Klotho can be prevented by AngII blockade. This finding may extend the therapeutic range of AngII blockade in preventing chronic allograft dysfunction in renal transplant recipients.
Acknowledgments
This work was supported by the National Research Foundation of Korea grant (2008-E00273) and by the Korea Science and Engineering Foundation (R13-2002-005-03001-0) through the Medical Science Research Center for Cell Death Disease Research Center at The Catholic University of Korea.
Conflict of interest statement. None declared.
References
- 1.Kuro-o M, Matsumura Y, Aizawa H, et al. Mutation of the mouse klotho gene leads to a syndrome resembling ageing. Nature. 1997;390:45–51. doi: 10.1038/36285. [DOI] [PubMed] [Google Scholar]
- 2.Kurosu H, Yamamoto M, Clark JD, et al. Suppression of aging in mice by the hormone Klotho. Science. 2005;309:1829–1833. doi: 10.1126/science.1112766. [DOI] [PMC free article] [PubMed] [Google Scholar]
- 3.Aizawa H, Saito Y, Nakamura T, et al. Downregulation of the Klotho gene in the kidney under sustained circulatory stress in rats. Biochem Biophys Res Commun. 1998;249:865–871. doi: 10.1006/bbrc.1998.9246. [DOI] [PubMed] [Google Scholar]
- 4.Nagai R, Saito Y, Ohyama Y, et al. Endothelial dysfunction in the klotho mouse and downregulation of klotho gene expression in various animal models of vascular and metabolic diseases. Cell Mol Life Sci. 2000;57:738–746. doi: 10.1007/s000180050038. [DOI] [PMC free article] [PubMed] [Google Scholar]
- 5.Sugiura H, Yoshida T, Tsuchiya K, et al. Klotho reduces apoptosis in experimental ischaemic acute renal failure. Nephrol Dial Transplant. 2005;20:2636–2645. doi: 10.1093/ndt/gfi165. [DOI] [PubMed] [Google Scholar]
- 6.Vonend O, Apel T, Amann K, et al. Modulation of gene expression by moxonidine in rats with chronic renal failure. Nephrol Dial Transplant. 2004;19:2217–2222. doi: 10.1093/ndt/gfh374. [DOI] [PubMed] [Google Scholar]
- 7.Mitani H, Ishizaka N, Aizawa T, et al. In vivo klotho gene transfer ameliorates angiotensin II-induced renal damage. Hypertension. 2002;39:838–843. doi: 10.1161/01.hyp.0000013734.33441.ea. [DOI] [PubMed] [Google Scholar]
- 8.Koh N, Fujimori T, Nishiguchi S, et al. Severely reduced production of klotho in human chronic renal failure kidney. Biochem Biophys Res Commun. 2001;280:1015–1020. doi: 10.1006/bbrc.2000.4226. [DOI] [PubMed] [Google Scholar]
- 9.Taal MW, Brenner BM. Renoprotective benefits of RAS inhibition: from ACEI to angiotensin II antagonists. Kidney Int. 2000;57:1803–1817. doi: 10.1046/j.1523-1755.2000.00031.x. [DOI] [PubMed] [Google Scholar]
- 10.Mattson MP, Maudsley S. Live longer sans the AT1A receptor. Cell Metab. 2009;9:403–405. doi: 10.1016/j.cmet.2009.04.002. [DOI] [PMC free article] [PubMed] [Google Scholar]
- 11.Benigni A, Corna D, Zoja C, et al. Disruption of the Ang II type 1 receptor promotes longevity in mice. J Clin Invest. 2009;119:524–530. doi: 10.1172/JCI36703. [DOI] [PMC free article] [PubMed] [Google Scholar]
- 12.Mazzadi A, Gomez Llambi H, Basso N. Effect of enalapril treatment on the heart of normal rats. Clin Exp Hypertens. 1998;20:867–884. doi: 10.3109/10641969809053252. [DOI] [PubMed] [Google Scholar]
- 13.Anversa P, Palackal T, Sonnenblick EH, et al. Myocyte cell loss and myocyte cellular hyperplasia in the hypertrophied aging rat heart. Circ Res. 1990;67:871–885. doi: 10.1161/01.res.67.4.871. [DOI] [PubMed] [Google Scholar]
- 14.Gonzalez Bosc LV, Kurnjek ML, Muller A, et al. Effect of chronic angiotensin II inhibition on the nitric oxide synthase in the normal rat during aging. J Hypertens. 2001;19:1403–1409. doi: 10.1097/00004872-200108000-00008. [DOI] [PubMed] [Google Scholar]
- 15.Costa LE, La-Padula P, Lores-Arnaiz S, et al. Long-term angiotensin II inhibition increases mitochondrial nitric oxide synthase and not antioxidant enzyme activities in rat heart. J Hypertens. 2002;20:2487–2494. doi: 10.1097/00004872-200212000-00029. [DOI] [PubMed] [Google Scholar]
- 16.Gonzalez Bosc L, Kurnjek ML, Muller A, et al. Effect of chronic angiotensin II inhibition on the cardiovascular system of the normal rat. Am J Hypertens. 2000;13:1301–1307. doi: 10.1016/s0895-7061(00)01209-7. [DOI] [PubMed] [Google Scholar]
- 17.Toblli JE, Stella I, de Cavanagh E, et al. Enalapril prevents tubulointerstitial lesions by hyperoxaluria. Hypertension. 1999;33:225–231. doi: 10.1161/01.hyp.33.1.225. [DOI] [PubMed] [Google Scholar]
- 18.de Cavanagh EM, Piotrkowski B, Basso N, et al. Enalapril and losartan attenuate mitochondrial dysfunction in aged rats. FASEB J. 2003;17:1096–1098. doi: 10.1096/fj.02-0063fje. [DOI] [PubMed] [Google Scholar]
- 19.de Cavanagh EM, Inserra F, Toblli J, et al. Enalapril attenuates oxidative stress in diabetic rats. Hypertension. 2001;38:1130–1136. doi: 10.1161/hy1101.092845. [DOI] [PubMed] [Google Scholar]
- 20.Toblli JE, Ferder L, Stella I, et al. Enalapril prevents fatty liver in nephrotic rats. J Nephrol. 2002;15:358–367. [PubMed] [Google Scholar]
- 21.de Cavanagh EM, Flores I, Ferder M, et al. Renin-angiotensin system inhibitors protect against age-related changes in rat liver mitochondrial DNA content and gene expression. Exp Gerontol. 2008;43:919–928. doi: 10.1016/j.exger.2008.08.007. [DOI] [PMC free article] [PubMed] [Google Scholar]
- 22.Ferder L, Inserra F, Romano L, et al. Effects of angiotensin-converting enzyme inhibition on mitochondrial number in the aging mouse. Am J Physiol. 1993;265:C15–C18. doi: 10.1152/ajpcell.1993.265.1.C15. [DOI] [PubMed] [Google Scholar]
- 23.Boveris A, D’Amico G, Lores-Arnaiz S, et al. Enalapril increases mitochondrial nitric oxide synthase activity in heart and liver. Antioxid Redox Signal. 2003;5:691–697. doi: 10.1089/152308603770379982. [DOI] [PubMed] [Google Scholar]
- 24.Hirawa N, Uehara Y, Kawabata Y, et al. Long-term inhibition of renin-angiotensin system sustains memory function in aged Dahl rats. Hypertension. 1999;34:496–502. doi: 10.1161/01.hyp.34.3.496. [DOI] [PubMed] [Google Scholar]
- 25.Basso N, Paglia N, Stella I, et al. Protective effect of the inhibition of the renin-angiotensin system on aging. Regul Pept. 2005;128:247–252. doi: 10.1016/j.regpep.2004.12.027. [DOI] [PubMed] [Google Scholar]
- 26.Bennett WM, DeMattos A, Meyer MM, et al. Chronic cyclosporine nephropathy: the Achilles’ heel of immunosuppressive therapy. Kidney Int. 1996;50:1089–1100. doi: 10.1038/ki.1996.415. [DOI] [PubMed] [Google Scholar]
- 27.de Mattos AM, Olyaei AJ, Bennett WM. Nephrotoxicity of immunosuppressive drugs: long-term consequences and challenges for the future. Am J Kidney Dis. 2000;35:333–346. doi: 10.1016/s0272-6386(00)70348-9. [DOI] [PubMed] [Google Scholar]
- 28.Li C, Lim SW, Sun BK, et al. Chronic cyclosporine nephrotoxicity: new insights and preventive strategies. Yonsei Med J. 2004;45:1004–1016. doi: 10.3349/ymj.2004.45.6.1004. [DOI] [PubMed] [Google Scholar]
- 29.Myers BD, Sibley R, Newton L, et al. The long-term course of cyclosporine-associated chronic nephropathy. Kidney Int. 1988;33:590–600. doi: 10.1038/ki.1988.38. [DOI] [PubMed] [Google Scholar]
- 30.Yoon HE, Yang CW. Established and newly proposed mechanisms of chronic cyclosporine nephropathy. Korean J Intern Med. 2009;24:81–92. doi: 10.3904/kjim.2009.24.2.81. [DOI] [PMC free article] [PubMed] [Google Scholar]
- 31.Jennings P, Koppelstaetter C, Aydin S, et al. Cyclosporine A induces senescence in renal tubular epithelial cells. Am J Physiol Renal Physiol. 2007;293:F831–F838. doi: 10.1152/ajprenal.00005.2007. [DOI] [PubMed] [Google Scholar]
- 32.Melk A, Schmidt BM, Vongwiwatana A, et al. Increased expression of senescence-associated cell cycle inhibitor p16INK4a in deteriorating renal transplants and diseased native kidney. Am J Transplant. 2005;5:1375–1382. doi: 10.1111/j.1600-6143.2005.00846.x. [DOI] [PubMed] [Google Scholar]
- 33.Yang CW, Ahn HJ, Kim WY, et al. Influence of the renin-angiotensin system on epidermal growth factor expression in normal and cyclosporine-treated rat kidney. Kidney Int. 2001;60:847–857. doi: 10.1046/j.1523-1755.2001.060003847.x. [DOI] [PubMed] [Google Scholar]
- 34.Lassila M. Interaction of cyclosporine A and the renin-angiotensin system; new perspectives. Curr Drug Metab. 2002;3:61–71. doi: 10.2174/1389200023337964. [DOI] [PubMed] [Google Scholar]
- 35.Yang CW, Ahn HJ, Kim WY, et al. Synergistic effects of mycophenolate mofetil and losartan in a model of chronic cyclosporine nephropathy. Transplantation. 2003;75:309–315. doi: 10.1097/01.TP.0000045034.48833.51. [DOI] [PubMed] [Google Scholar]
- 36.Sun BK, Li C, Lim SW, et al. Blockade of angiotensin II with losartan attenuates transforming growth factor-beta1 inducible gene-h3 (betaig-h3) expression in a model of chronic cyclosporine nephrotoxicity. Nephron Exp Nephrol. 2005;99:e9–e16. doi: 10.1159/000081793. [DOI] [PubMed] [Google Scholar]
- 37.Chander V, Singh D, Tirkey N, et al. Amelioration of cyclosporine nephrotoxicity by irbesartan, a selective AT1 receptor antagonist. Ren Fail. 2004;26:467–477. doi: 10.1081/jdi-200031731. [DOI] [PubMed] [Google Scholar]
- 38.Lassila M, Finckenberg P, Pere AK, et al. Comparison of enalapril and valsartan in cyclosporine A-induced hypertension and nephrotoxicity in spontaneously hypertensive rats on high-sodium diet. Br J Pharmacol. 2000;130:1339–1347. doi: 10.1038/sj.bjp.0703422. [DOI] [PMC free article] [PubMed] [Google Scholar]
- 39.Mazzali M, Hughes J, Dantas M, et al. Effects of cyclosporine in osteopontin null mice. Kidney Int. 2002;62:78–85. doi: 10.1046/j.1523-1755.2002.00408.x. [DOI] [PubMed] [Google Scholar]
- 40.Yang CW, Faulkner GR, Wahba IM, et al. Expression of apoptosis-related genes in chronic cyclosporine nephrotoxicity in mice. Am J Transplant. 2002;2:391–399. doi: 10.1034/j.1600-6143.2002.20501.x. [DOI] [PubMed] [Google Scholar]
- 41.Song J, Meng L, Li S, et al. A combination of Chinese herbs, Astragalus membranaceus var. mongholicus and Angelica sinensis, improved renal microvascular insufficiency in 5/6 nephrectomized rats. Vascul Pharmacol. 2009;50:185–193. doi: 10.1016/j.vph.2009.01.005. [DOI] [PubMed] [Google Scholar]
- 42.Ahn KO, Lim SW, Li C, et al. Influence of angiotensin II on expression of toll-like receptor 2 and maturation of dendritic cells in chronic cyclosporine nephropathy. Transplantation. 2007;83:938–947. doi: 10.1097/01.tp.0000258589.39006.94. [DOI] [PubMed] [Google Scholar]
- 43.Pichler RH, Franceschini N, Young BA, et al. Pathogenesis of cyclosporine nephropathy: roles of angiotensin II and osteopontin. J Am Soc Nephrol. 1995;6:1186–1196. doi: 10.1681/ASN.V641186. [DOI] [PubMed] [Google Scholar]
- 44.Lim SW, Li C, Ahn KO, et al. Cyclosporine-induced renal injury induces toll-like receptor and maturation of dendritic cells. Transplantation. 2005;80:691–699. doi: 10.1097/01.tp.0000173594.69089.a0. [DOI] [PubMed] [Google Scholar]
- 45.Kim WY, Jung JH, Park EY, et al. Expression of protein kinase C isoenzymes alpha, betaI, and delta in subtypes of intercalated cells of mouse kidney. Am J Physiol Renal Physiol. 2006;291:F1052–F1060. doi: 10.1152/ajprenal.00016.2006. [DOI] [PubMed] [Google Scholar]
- 46.Gonzalez-Villalobos RA, Seth DM, Satou R, et al. Intrarenal angiotensin II and angiotensinogen augmentation in chronic angiotensin II-infused mice. Am J Physiol Renal Physiol. 2008;295:F772–F779. doi: 10.1152/ajprenal.00019.2008. [DOI] [PMC free article] [PubMed] [Google Scholar]
- 47.Kobori H, Prieto-Carrasquero MC, Ozawa Y, et al. AT1 receptor mediated augmentation of intrarenal angiotensinogen in angiotensin II-dependent hypertension. 2004;43:1126–1132. doi: 10.1161/01.HYP.0000122875.91100.28. [DOI] [PMC free article] [PubMed] [Google Scholar]
- 48.Shigenaga MK, Gimeno CJ, Ames BN. Urinary 8-hydroxy-2′-deoxyguanosine as a biological marker of in vivo oxidative DNA damage. Proc Natl Acad Sci USA. 1989;86:9697–9701. doi: 10.1073/pnas.86.24.9697. [DOI] [PMC free article] [PubMed] [Google Scholar]
- 49.Narumiya H, Sasaki S, Kuwahara N, et al. HMG-CoA reductase inhibitors up-regulate anti-aging klotho mRNA via RhoA inactivation in IMCD3 cells. Cardiovasc Res. 2004;64:331–336. doi: 10.1016/j.cardiores.2004.07.011. [DOI] [PubMed] [Google Scholar]
- 50.Mitobe M, Yoshida T, Sugiura H, et al. Oxidative stress decreases klotho expression in a mouse kidney cell line. Nephron Exp Nephrol. 2005;101:e67–e74. doi: 10.1159/000086500. [DOI] [PubMed] [Google Scholar]
- 51.Saito K, Ishizaka N, Mitani H, et al. Iron chelation and a free radical scavenger suppress angiotensin II-induced downregulation of klotho, an anti-aging gene, in rat. FEBS Lett. 2003;551:58–62. doi: 10.1016/s0014-5793(03)00894-9. [DOI] [PubMed] [Google Scholar]
- 52.Ahmed SS, Strobel HW, Napoli KL, et al. Adrenochrome reaction implicates oxygen radicals in metabolism of cyclosporine A and FK-506 in rat and human liver microsomes. J Pharmacol Exp Ther. 1993;265:1047–1054. [PubMed] [Google Scholar]
- 53.Inselmann G, Hannemann J, Baumann K. Cyclosporine A induced lipid peroxidation and influence on glucose-6-phosphatase in rat hepatic and renal microsomes. Res Commun Chem Pathol Pharmacol. 1990;68:189–203. [PubMed] [Google Scholar]
- 54.Yamamoto M, Clark JD, Pastor JV, et al. Regulation of oxidative stress by the anti-aging hormone klotho. J Biol Chem. 2005;280:38029–38034. doi: 10.1074/jbc.M509039200. [DOI] [PMC free article] [PubMed] [Google Scholar]
- 55.Ni YG, Berenji K, Wang N, et al. Foxo transcription factors blunt cardiac hypertrophy by inhibiting calcineurin signaling. Circulation. 2006;114:1159–1168. doi: 10.1161/CIRCULATIONAHA.106.637124. [DOI] [PMC free article] [PubMed] [Google Scholar]
- 56.Juhasz G, Puskas LG, Komonyi O, et al. Gene expression profiling identifies FKBP39 as an inhibitor of autophagy in larval Drosophila fat body. Cell Death Differ. 2007;14:1181–1190. doi: 10.1038/sj.cdd.4402123. [DOI] [PMC free article] [PubMed] [Google Scholar]
- 57.Kamemori M, Ohyama Y, Kurabayashi M, et al. Expression of Klotho protein in the inner ear. Hear Res. 2002;171:103–110. doi: 10.1016/s0378-5955(02)00483-5. [DOI] [PubMed] [Google Scholar]
- 58.Takeshita K, Fujimori T, Kurotaki Y, et al. Sinoatrial node dysfunction and early unexpected death of mice with a defect of klotho gene expression. Circulation. 2004;109:1776–1782. doi: 10.1161/01.CIR.0000124224.48962.32. [DOI] [PubMed] [Google Scholar]
- 59.Elzinga LW, Rosen S, Bennett WM. Dissociation of glomerular filtration rate from tubulointerstitial fibrosis in experimental chronic cyclosporine nephropathy: role of sodium intake. J Am Soc Nephrol. 1993;4:214–221. doi: 10.1681/ASN.V42214. [DOI] [PubMed] [Google Scholar]
- 60.Inigo P, Campistol JM, Lario S, et al. Effects of losartan and amlodipine on intrarenal hemodynamics and TGF-beta(1) plasma levels in a crossover trial in renal transplant recipients. J Am Soc Nephrol. 2001;12:822–827. doi: 10.1681/ASN.V124822. [DOI] [PubMed] [Google Scholar]