

Abstract
During the determination of a DNA sequence, the introduction of artifactual frameshifts and/or in-frame stop codons in putative genes can lead to misprediction of gene products. Detection of such errors with a method based on protein similarity matching is only possible when related sequences are available in databases. Here, we present a method to detect frameshift errors in DNA sequences that is based on the intrinsic properties of the coding sequences. It combines the results of two analyses, the search for translational initiation/termination sites and the prediction of coding regions. This method was used to screen the complete Bacillus subtilis genome sequence and the regions flanking putative errors were resequenced for verification. This procedure allowed us to correct the sequence and to analyze in detail the nature of the errors. Interestingly, in several cases in-frame termination codons or frameshifts were not sequencing errors but confirmed to be present in the chromosome, indicating that the genes are either nonfunctional (pseudogenes) or subject to regulatory processes such as programmed translational frameshifts. The method can be used for checking the quality of the sequences produced by any prokaryotic genome sequencing project.
Despite progress in DNA-sequencing techniques, currently used protocols result in different sources of errors. High-performance automated sequencing machines have been developed and substantially reduce the introduction of human errors. However, systematic error due to gel compression for example, still remain difficult to avoid. Most of these errors involve single-base substitutions and have limited effect on the overall quality of the final sequence. Sometimes, they can generate artifactual insertions and deletions of bases (indels) that produce frameshifts in deduced coding regions, and thereby cause errors in predicted protein sequences and compromise the interpretation of the chromosome sequence.
Several computational tools have been developed to avoid many of the pitfalls of error accumulation during DNA sequencing (White et al. 1993; Richterich 1998). Various related methods address the question of detecting frameshift errors in DNA sequence data. They are based on the comparison of the conceptual translations of the DNA sequences in all six reading frames, to each sequence of a protein databank (Posfai and Roberts 1992; Claverie 1993; Guan and Uberbacher 1996; Brown et al. 1998). Frameshifts are thus inferred from the comparison of the protein sequences, and consequently, error detection relies on the presence of closely related protein sequences in databanks. To overcome this drawback, Fichant and Quentin (1995) have developed a tool, called FSED (Frameshift Errors Detection), which is based on discrimination of the coding frame from the two other frames. Their method rests on the result of a correspondence analysis performed on the nonoverlapping tri- or hexa-nucleotides in the three frames of a coding sequence (CDS). Because, by construction, this algorithm only works on a list of characterized CDSs, it cannot be used to check the quality of the sequences produced during the early steps of a sequencing project. However, it remains a powerful method to use in the last steps of a project.
In this work, we developed a method, hereafter called ProFED (Procaryotic Frameshift Errors Detection) that allows for frameshift prediction in raw DNA sequences without looking for sequence similarity in databanks. It only uses frame-dependent properties of the protein-coding regions, namely the stop and the start codon locations combined with the predicted coding probabilities in the six reading frames. ProFED has been embedded into our computer environment Imagene, dedicated to sequence annotation and analysis (Médigue et al. 1999). As a matter of comparison, we have also developed a method based on protein-similarity matching (hereafter called FSBlastx) using previously described concepts (Posfai and Roberts 1992; Brown et al. 1998). The outlines of both methods are given in the Methods section.
As our laboratory has been involved intensively in the B. subtilis genome sequencing project (Kunst et al. 1997; Moszer 1998), we first used these two methods for predicting frameshift errors from this complete genome sequence. As an experimental check of the predictions, the regions centered around the putative errors were resequenced. Results and analysis of the true and false predictions are discussed below. Our method allowed us to further improve the overall quality of the final B. subtilis genome sequence and to pinpoint several unidentified authentic frameshift errors corresponding either to nonfunctional putative genes (pseudo-genes) or to genes subject to regulation processes such as programmed translational frameshifts (Atkins et al. 1991, 1999; Farabaugh 1996). Our strategy is currently being applied to other procaryotic genomes and seems to be a reliable quality assessor of the final sequences.
RESULTS AND DISCUSSION
The total length of the B. subtilis chromosome used in this study was 4,214,810 basepairs. A total of 4100 putative protein CDSs were identified, covering 87% of the genome sequence (Kunst et al. 1997). The two detection methods identified 522 regions containing putative frameshift errors. These 522 resequenced DNA fragments correspond to a total of 261 kb (i.e, 6.2% of the B. subtilis genome).
The results are summarized in Figure 1. Among the 522 resequenced fragments, 303 (58%) were identical to the original sequence, whereas 219 (42%) revealed differences with the original sequence. The differences involved either substitutions only (88 fragments, containing a total of 91 substitutions) or both substitutions, insertions, and deletions (131 fragments, containing 139 substitutions and 284 insertions and deletions). It should be stressed that, because we targeted regions containing putative errors (rather than drawing the regions randomly), we are not able to directly evaluate the overall quality of the complete genome sequence from these numbers. Each of the 219 true positive regions was analyzed in detail to ascertain the errors and their effect on gene prediction. Conversely, each of the 303 false-positive regions was also analyzed to investigate to what extent they really were mispredictions. Actually, these falsely identified sequencing errors correspond either to inappropriate detections, or to in-frame termination codons or frameshifts actually present in the chromosome (hereafter called authentic frameshifts).
Figure 1.

Summary of the results of resequencing 522 fragments of the B. subtilis chromosome (each fragment is ∼500 bp long). The fragments were pinpointed by the methods described in the text (FSBlastX and ProFED) and were suspected of containing sequencing errors. The bottom line of the graph indicates the total number of errors (substitutions or insertions–deletions) found in the fragments.
Analysis of the True Sequencing Errors
Table 1 displays the repartition of the 219 true-positive regions predicted by the FSBlastx and ProFED methods. Only 5% of these regions were found by both methods. Only 24% of FSBlastx predictions appear to be real sequencing errors. This surprising low accuracy is discussed below. In sharp contrast, the accuracy of the ProFED method was 63%.
Table 1.
Number (and Percentage) of Correct and Wrong Predictions Obtained by the Two Frameshift Detection Methods ProFED and FSBlastX
| Prediction | Total | Only | Common to | |
|---|---|---|---|---|
| FSBlastXa | ProFEDa | FSBlastX & ProFED | ||
| Correct | 219 (42%) | 67 (24%) | 162 (63%) | 10 (5%) |
| Wrong | 303 (58%) | 209 (76%) | 94 (37%) | 0 (0%) |
Percentage is the fraction of correct (or wrong) predictions for this method.
The alignment output files were parsed to analyze precisely the proportion of each kind of sequencing error. A summary of the results is given in Table 2. Among a total of 230 substitutions, the most frequent were between C and G nucleotides (31%) and the less frequent between T and A nucleotides (10%). One-half of the G → C substitutions were immediately followed by a C → G substitution (also called a GC swap). This is consistent with the fact that sequencing methods with fluorescent primers often lead to G and C traces that migrate to the same place and are therefore superimposed on each other. The other types of substitution were encountered in a very similar proportion (13% to 17%). A total of 344 indel errors were also analyzed in more detail. Deletions in the original sequence were more frequent than insertions, 68% and 32%, respectively (Table 2).
Table 2.
Number (and Percentage) of Each Kind of Sequencing Error: Substitutions, Deletions, and Insertions
| Substitutionsa | Deletionsbc | Insertions |
|---|---|---|
| A↔T 24 (10%) | A 30 (11%) | 21 (7%) |
| A↔G 38 (17%) | T 55 (19%) | 25 (9%) |
| A↔C 30 (13%) | G 56 (20%) | 20 (7%) |
| T↔G 32 (14%) | C 53 (19%) | 24 (8%) |
| T↔C 35 (15%) | 194 (68%) | 90 (32%) |
| G↔C 71 (31%) |
Percentage is the fraction of total substitutions.
A deletion means a missing letter in the original sequence.
Percentage is the fraction of total insertions and deletions.
We have then classified the true sequencing errors into five categories according to their effect on gene prediction (Table 3): 1-to-1 correction (an existing gene has become longer), n-to-1 correction (more than one existing gene was merged into one single gene), 1-to-n correction (an existing gene was split into more than one gene), 0-to-1 correction (a new putative coding sequence was revealed), and no-change category (the sequencing error does not change the predicted CDSs).
Table 3.
Classification of Sequencing Errors According to their Effect on Gene Prediction
| Categorya | No. of fragments |
|---|---|
| No change | 90 (41%) |
| 1 to 1 | 76 (35%) |
| n to 1 | 37 (17%) |
| 0 to 1 | 12 (6%) |
| 1 to n | 4 (1%) |
See text.
About 40% of all the resequenced sequences only contained substitutions (Fig. 1), which generally did not change the length of the corresponding genes (apart from when a termination codon is involved in the correction). Because most of the sequencing laboratories have used the same single isolate of B. subtilis strain 168, it seems likely that the polymorphism is due to spontaneous mutations in the cloned fragments during library construction. Some divergence may have been due to some of the laboratories using cultures of strain 168 already used for some time. However, to assess the origin and impact of these corrections, a further analysis of the changes in the corresponding amino acid sequences will be necessary.
About 35% of the corrections lengthened existing coding sequences (1-to-1 correction), leading to changes in the position of the corresponding genes on the B. subtilis chromosome. A particular case was a large deletion in the ptsI gene, at position 1459 kb, which 60 bp were missing. This actually corresponds to a computer transmission error during the collection of the data from the sequencing laboratories (60 is the length of a sequence line in a databank entry). Because this is not a real sequencing error, this large deletion has not been taken into account in the statistics given in this paper.
About 17% of the corrections allowed us to merge two or more genes into one gene (n-to-1 correction). The majority of these corrections concerned y genes, that is, genes whose function is experimentaly unknown (even if their products may be similar to known proteins). However, in a few cases, previously identified genes were changed: this is the case of pksJ/pksK (at position 1793 kb) that were merged after addition of a 46-bp deletion, and of pksO/pksP (1835 kb). This corresponds to genes displaying long sequence repeats and, therefore, extremely difficult to sequence. Two other genes, secF (2828 kb) and dhbF (3287 kb) were merged with neighbor y genes; moreover, the spsG/spsH genes (3885 kb) were found to correspond to one single gene.
The 0-to-1 correction (newly identified coding sequences) made up ∼6% of all corrections and allowed us to annotate B. subtilis genome regions previously devoid of predicted protein-coding sequences. Because our strategy was not dedicated to analyzing holes, it is likely that several small genes still remain undetected.
Finally, four identified genes were split into several smaller CDSs (1-to-n correction): two of them involved y genes (ycsJ at position 460 kb and yeeK at position 753 kb); the two other cases were more surprising as they concerned the mtlA gene (450 kb) and the spsK gene (3882 kb). The mtlA gene was split into three smaller CDSs: This gene codes for a protein of 610 amino acids, corresponding to a phosphotransferase system (PTS) mannitol-specific enzyme IIABC component. The protein is composed of two cytoplasmic domains, IIA and IIB, and one membrane-embedded domain, IIC, each showing structural and functional independence (Postma et al. 1993). The length of the three CDSs generated by the mtlA gene sequence correction are not identical to the length of the three modules, 293 amino acids for IIC module instead of 350–400, 170 amino acids for IIB module instead of 100, and 102 amino acids for IIA module instead of 150. However, the product of the CDS that could be associated to the IIB module is more similar to the IIB module of the Escherichia coli mtlA protein (Lee and Saier 1983) than to the corresponding part of the initial B. subtilis mtlA protein (data not shown).
Analysis of the False Sequencing Errors
A total of 303 of the 522 resequenced regions were identical to their original counterpart (Fig. 1). These falsely identified sequencing errors were mainly mispredictions of the FSBlastx method (76% of mispredictions; Table 1). Twenty four of these false sequencing errors were in genes containing long sequence repeats (such as pks, srf, and pps). In these cases, the Blast2X score and p_value were generally much higher than the preset threshold. Additionally, we also found several errors due to old entries in the nonredundant protein databank containing sequencing errors: For example, the GenBank entry BACBPF (J05400) corresponds to a truncated Bacillopeptidase F protein. These characteristic features of Blast2X and of the reference protein databanks must be kept in mind, and any method based on protein sequence similarity matching should therefore be used with caution when searching for frameshift errors.
In contrast, mispredictions of the ProFED method were much lower (37%; Table 1). The accuracy of this method depends mostly on two parameters; one is the width W of the sliding window (see the Methods section) and the other is the GeneMark transition matrix in relation to the codon usage of the DNA fragment under analysis. Bacterial genomes may contain elements such as transposons, insertion sequences, prophages, or remnants of prophages, which play an important evolutionary role in horizontal gene transfer. On the basis of codon usage analysis, the horizontally transferred genes form a well-defined class, clearly distinct from the native gene class and the highly expressed gene class (Médigue et al. 1991; Lawrence and Ochman 1997). Borodovsky and coworkers were able to identify new genes in E. coli after scanning the genome with the GeneMark program trained on the three gene classes of this organism (Borodovsky et al. 1993). Therefore, an improvement of our strategy would be to use the GeneMark method with the models of protein-coding region automatically obtained by the GeneMark-Genesis method (Hayes and Borodovsky 1998). In most of the cases, this latter program identifies two gene models: The atypical model allows one to predict genes that escape identification by the typical model and detects many genes that appear to be horizontally transferred.
Detection of Several Authentic Frameshifts
Several in-frame termination codons or apparent frameshifts were confirmed to be present on the chromosome, highlighting an interesting feature of the B. subtilis genome; the existence of authentic frameshifts. These authentic frameshifts are mainly located in known prophages or prophage-like elements of the B. subtilis genome, the SPβ and skin prophages, respectively, contain five and two probable authentic frameshifts. Six other cases were detected in other prophage-like elements, prophage 3, prophage 4, and prophage 7 (Kunst et al. 1997), whereas in the remainder of the genome, only seven additional authentic frameshifts were identified. These frameshifts may correspond to nonfunctional genes, that is, pseudogenes, or to genes subject to particular regulation processes such as programmed translational frameshifts (Atkins et al. 1991, 1999; Farabaugh 1996). As an example, the sfp gene (at position 407 kb), which encodes for the lipopeptide antibiotic surfactin is already known to be a pseudogene in B. subtilis 168 (Nakano et al. 1992), probably resulting from the X-ray irradiation of the ancestor of this strain (Burkholder and Gilles 1947). The authentic frameshifts found in prophage regions most probably correspond to genes that are no longer functional (these B. subtilis chromosomal regions merely contain remnants of prophages), or are the result of a phage-specific regulation when the phage shifts from its lysogenic to its lytic state. For example, three authentic frameshifts were identified in the prophage 3 region, a very short portion of the genome (∼10 kb; Fig. 2). One frameshift at the beginning of prophage 3, between the groEL and ydiM genes (which correspond to a previously unannotated 1500-bp region), was detected because (1) there was a very poor correlation between the coding prediction curves and the position of the CDSs, and (2) numerous Blast2X hits were found in different frames, all showing similarities with integrase proteins (Fig. 2a). Although the integration mechanism of this prophage-like element is unknown, it presumably involves a protein of the integrase family (required for the phage DNA integration into the host chromosome through site-specific recombination). It should be pointed out that the expression of many of the transposases that catalyze the insertion of IS (Insertion Sequence) copies into new chromosomal locations is controlled by translational frameshifting (Chandler and Fayet 1993). Because of the numerous frameshift points, this B. subtilis region probably contains traces of the phage integrase gene. Mutations in the ancestral gene probably resulted in the current prophage state. The B. subtilis genome already contains two genes coding for integrase/recombinase proteins, one at position 1687 kb (codV gene) and one at position 2448 kb (ripX gene). Moreover, the product of the ydcL gene, at the beginning of prophage 2, and that of the yokA gene, at the end of the SPβ prophage, are highly similar to integrase/recombinase proteins. None of these CDSs contain any frameshift. Two other authentic frameshifts were found in the prophage 3 region. As shown in Figure 2b, the good GeneMark-coding prediction curve for the −1 frame is not correlated with the position of the CDSs. This region also shows strong similarities with phosphomannomutase, and, curiously, the Blast2X hits are found in the −1 frame only. Finally, the start point of the ydjC gene (Fig. 2c) does not coincide with the rise of the GeneMark curve; no similarity with databank proteins was found in this region. In view of their location in the B. subtilis genome, we interpret these authentic frameshifts as most probably corresponding to nonfunctional genes.
Figure 2.
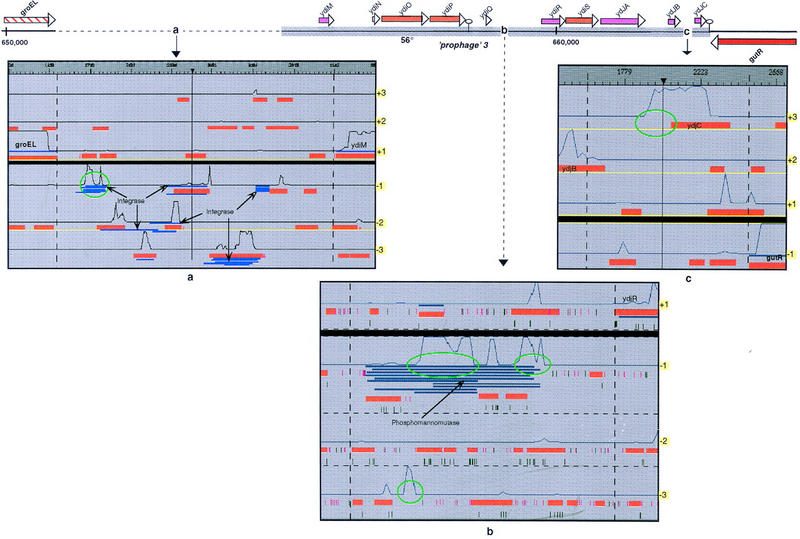
B. subtilis prophage 3 region containing three authentic frameshifts (a–c) corresponding to probable pseudogenes (see text). Boundaries of this prophage on the chromosome are indicated by the thick gray line at top. (a–c) Results of the analysis of these regions with the CoDing Sequences searching method (red boxes), the Blast2x method (blue rectangles), and the GeneMark coding predictions (black solid lines). (b) Start and stop codons are represented by pink and green lines, respectively. Atypical features are circled in green (respectively at positions 652000, 656000, 658500, 659000, and 663500 bp).
Another interesting authentic frameshift was detected at position 633 kb, between the ydhT and trnE genes. Coding prediction probability (Fig. 3a) suggests that the start of the ydhU gene is actually >200 bp upstream of the present start point. The alignments between the Blast2X hits and the query sequence show that, bypassing one UAG stop codon only (Fig. 3b), the longest polypeptide obtained is similar to a manganese-containing catalase. Considering the context of this stop codon, one can wonder whether we are not faced with a case of programmed translational frameshift. Many examples of translational frameshifts have been found in bacteria, yeast, plants, and higher animals (Farabaugh 1996). In the case of E. coli, at least two programmed translational frameshifts are well documented: (1) The expression of the prfB gene (encoding the peptide release factor 2) involves an autogenous regulatory loop in which expression of the gene by translational frameshifting is negatively regulated by the gene product (Craigen et al. 1985); (2) a frameshift in the dnaX gene (encoding DNA polymerase III) allows the expression of alternative enzyme activities, as a result of the production of the τ and γ subunits, respectively (Blinkowa and Walker 1990; Flower and McHenry 1990; Tsuchihashi and Kornberg 1990). Several programmed translational frameshifts have been identified in bacteriophages and bacterial insertion sequences (Chandler and Fayet 1993). Analysis of the +1 and −1 frameshifting systems identifies three paradigms: (1) doublet decoding of aminoacyl-tRNA; (2) out-of-frame binding of aminoacyl-tRNA; and (3) slippage of peptidyl-tRNA (Farabaugh 1996). In eucaryotes, −1 programmed translational frameshift involves a heptanucleotide sequence of the form X-XXY-YYZ, in which the U-UUU-UUA motif has been characterized as a slippery heptamer (ten Dam et al. 1990). The UUU codon is extremely frameshift prone if it is followed by a pyrimidine-starting codon (UUU Ynn codon pairs) (Fu and Parker 1994; Schwartz and Curran 1997). The UAG codon context represented in Figure 3b might act as a slippery site involving the UUU-UUU codons. Moreover, there is no RBS motif known to facilitate translational frameshifting within 15-bp upstream from the putative slippage site. Curiously, a strong putative RBS is found just after the UAG stop codon (Fig. 3b, AGGAG motif) and it is followed, 14-bp downtream, by a CTG codon that could perhaps be used as the start codon of the ydhU gene (in the −3 frame). However, this interpretation is not in agreement with the results of the Blast2X matches. In the −1 and −3 frames, local hits are separated by the UAG stop codon only. Furthermore, this programmed translational frameshift cannot be linked to an evident function. The corresponding polypeptide exhibits very slight similarity with catalase proteins, and at least three major catalases have already been identified in the B. subtilis genome (katA gene at 960 kb, katX gene at 3964 kb, and katB gene at 4007 kb). It would be of interest to determine whether such gene features are conserved in related Bacillus species.
Figure 3.
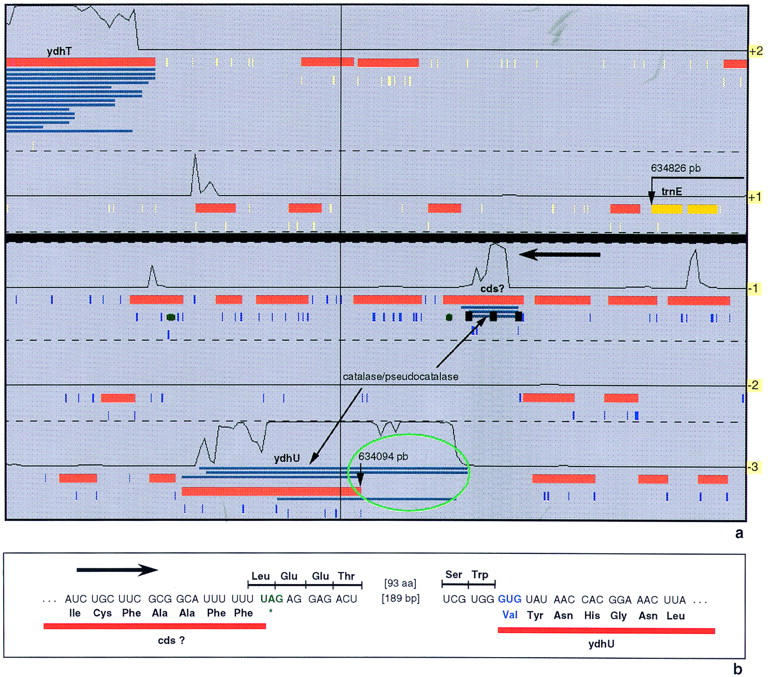
Example of an authentic frameshift corresponding to a putative programmed frameshift. (a) Representation of the ydhT-trnE B. subtilis region with the Imagene Results Manager. (b) DNA sequence corresponding to the end of the cds? putative gene and the beginning of the ydhU gene. A −1 frameshifting at the UUU UUU slippery sequence will lead to the expression of a gene whose product exhibits some similarities with catalase.
METHODS
Finding Errors with FSBlastX
Members of the BlastX programs family (Altschul et al. 1990, 1997) are the only programs really suited to detect frameshift errors. The raw DNA sequence is translated into the six reading frames and then compared with individual entries in a protein sequence databank to identify significant local matches (also called hits). Whenever close matches show similarities with the same protein databank and jump from one frame to another on the same strand of the DNA sequence, potential errors may be suspected (Fig. 4). In a first step, the Blast2X scanning program (Altschul et al. 1997) has been run on the entire B. subtilis genome against a nonredundant protein databank (nrprot from NCBI; ftp://ncbi.nlm.nih.gov/blast/db/nr), with the Blosum62 scoring matrix (Henikoff and Henikoff 1992) and the SEG filter method (Wootton and Federhen 1993). The B. subtilis chromosome was split into overlapping fragments of 10 kb so as to obtain significant results in terms of hit statistics; only hits that satisfy preset Blast2X p value and score thresholds were considered. In a second step, the output files were parsed in pairs to ensure adequate coverage of frameshift errors bridging the 10-kb fragments termini, and the hits were grouped by databank protein identifier (i.e., identical accession number). In a third step, potential frameshift locations were detected according to the following criteria (Fig. 4): (1) at least two Blast2X hits, associated to the same protein entry, lie on different frames of either the direct or the reverse strand; (2) these hits maintain the same order in the query and databank sequences; and (3) these hits exhibit no extensive overlap (in case of an overlapping frameshift region) or gap (in case of a sequential frameshift region).
Figure 4.
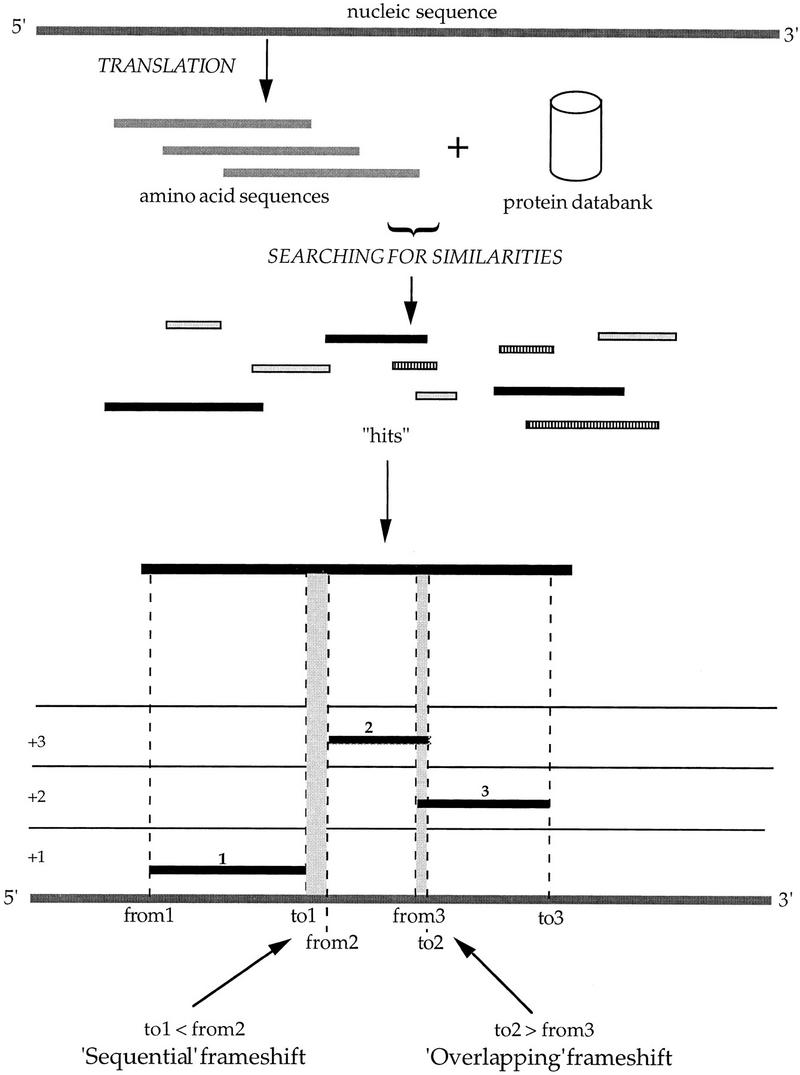
Schema of the FSBlastX method. The method makes use of protein similarity matching (see Methods).
Finding Errors by the ProFED Method
Established methods for predicting coding regions and/or coding frames make use of several frame-dependent properties of protein-coding regions, such as the stop codon location, the base frequency in each of the three positions within a codon, the amino acid frequency, and the frequency of oligonucleotides of various length in a coding frame (Gribskov et al. 1984; Staden 1990; Fickett and Tung 1992). The idea behind the last two criteria is that coding constraints induce a statistical bias in the distribution of k-tuples in the three frames of a coding sequence. In the case of the CodonPreference method (Gribskov et al. 1984), a codon usage reference table calculated on a training set of genes is used to predict coding frames. A high-coding probability is found when the succession of 3-tuples in one frame of the query sequence is consistent with the codon usage reference table. More recently, other methods with either periodical Markov chain models (Borodovsky and McIninch 1993; Lukashin and Borodovsky 1998) or interpolated Markov models (Salzberg et al. 1998) have been described; they yield more accurate results for bacteria provided that genes have been first clustered into pertinent classes that are then used as training sets (Borodovsky et al. 1995). Two methods for the prediction of coding regions with the GeneMark (Borodovsky and McIninch 1993) and the Glimmer (Salzberg et al. 1998) programs have been embedded in our cooperative computer environment, Imagene (Médigue et al. 1999). This system provides a user interface to display the results produced by several methods in a single picture. The superimposition of results obtained by different strategies is very useful to pinpoint typical or atypical features of a sequence analysis.
Various observations using the Imagene environment led us to devise the ProFED method. First, a simple CDS searching method looks for maximal CDSs (maximal segment between in-frame start and stop codons) at least 300 bp in length. Subsequently, results of the GeneMark (or Glimmer) method are superimposed to the maximal CDSs. A graphical representation of this analysis is given in Fig. 5. In the three reading frames of the query sequence, the CDS objects produced by the CDS searching method are represented by gray boxes, and the GeneMark-coding predictions are represented by black curves. The first map (Fig. 5a) corresponds to a piece of the B. subtilis purine operon and shows a very good correspondence between the results of the two methods. The maximal CDSs are located at positions in which the GeneMark coding prediction is good (the boundaries of these different features are almost identical). In contrast, the map obtained for another fragment of the B. subtilis chromosome suggests a very different interpretation (Fig. 5b). In the +2 frame at position 6550 bp, one can see the beginning of a very good coding prediction, whereas the start of the corresponding CDS in the same frame is farther downstream (at position 6640 bp). In the extreme case, no CDS object is found (+1 frame at position 6837 bp). Another kind of atypical feature is given when two CDSs overlap on the same strand, both presenting reliable GeneMark predictions (+2 and +3 frames, at position 5800 bp). These features can be explained as follows: the CDS located just before these atypical regions contains a frameshift error inducing an artefactual early stop codon. For example at position 6540 bp, one should observe the following: (1) in the +3 frame, the GeneMark curve drops to the baseline level, whereas no stop codon for the corresponding CDS has been encountered, and (2) this frameshifting produces, in another frame (+2 frame), a new satisfactory coding prediction (which actually corresponds to the continuation of the correct CDS). A more complicated case occurs when two (or more) CDSs are imbedded within each other, with a good coding prediction for the shortest one and significantly less good prediction in the same region of the embedding CDS. Such a situation corresponds to two compensating frameshift errors within the same CDS and could also be predicted by use of the FSED method (Fichant and Quentin 1995).
Figure 5.
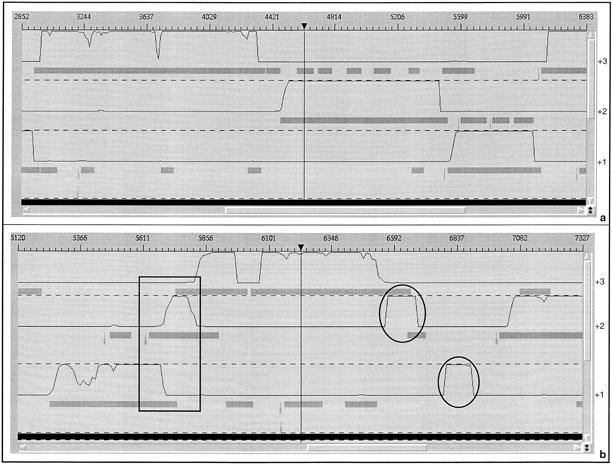
Graphical maps (in the Imagene Result Manager) resulting from the analysis of two B. subtilis chromosomal regions. Results obtained with the CoDing Sequences searching method are shown in gray boxes (CDSs) and gray triangles (RBSs). Those obtained with the GeneMark coding prediction method are displayed as black continuous lines. Results are shown in the three positive frames. (a) Analysis of a fragment of the B. subtilis purine operon. (b) Analysis of a chromosome region containing sequencing errors. Atypical features in the second map are circled in black.
From these observations, we have developed the ProFED method to automatically identify putative sequencing errors in a large contig or in a complete bacterial genome. The B. subtilis chromosome was split into smaller fragments (of length L = 20 kb), and the following steps were iterated on each DNA fragment:
The CDS searching method described above is executed, and the positions of the putative CDSs in the six reading frames are kept (Fig. 6, M1).
This list is then parsed to create, for each reading frame k, a boolean (0/1) vector Bk of length L, which contains 1 if the position is in a CDS and 0 if the position is not in a CDS.
The GeneMark method is used to produce six numeric vectors Pk, corresponding to the coding probabilities along the DNA fragment for each of the six frames (Fig. 6, M2).
- The previous results are then merged in the following way (Fig. 6, M1+M2) :
- For each numeric vector Pk, a sliding window of width W is moved along the sequence to calculate the mean of the GeneMark coding probability (mean-gm) at each position i in the sequence.
- If mean-gm exceeds a preset threshold Tgm, the value Bk(i) of the boolean vector Bk, at position i, is considered.
- If Bk(i) is 0 (case A in Fig. 6), this indicates a disagreement between the coding prediction and the location maximal CDS and therefore a putative frameshift introducing an incorrect in-frame stop codon.
- If Bk(i) is 1, the program looks for an another frame k′ containing, at the same position i, a boolean vector Bk′(i) equal to 1 and a numeric vector Pk′ with a mean-gm value greater or equal to the threshold Tgm. This second case (case B in Fig. 6) indicates partially overlapping CDSs that should putatively be merged together.
- If one of the conditions (4-b-i) or (4-b-ii) holds, then position i is suspected to contain a frameshift error and is reported in the output file. Consecutive erroneous positions are further merged into a single putative sequencing error.
Figure 6.
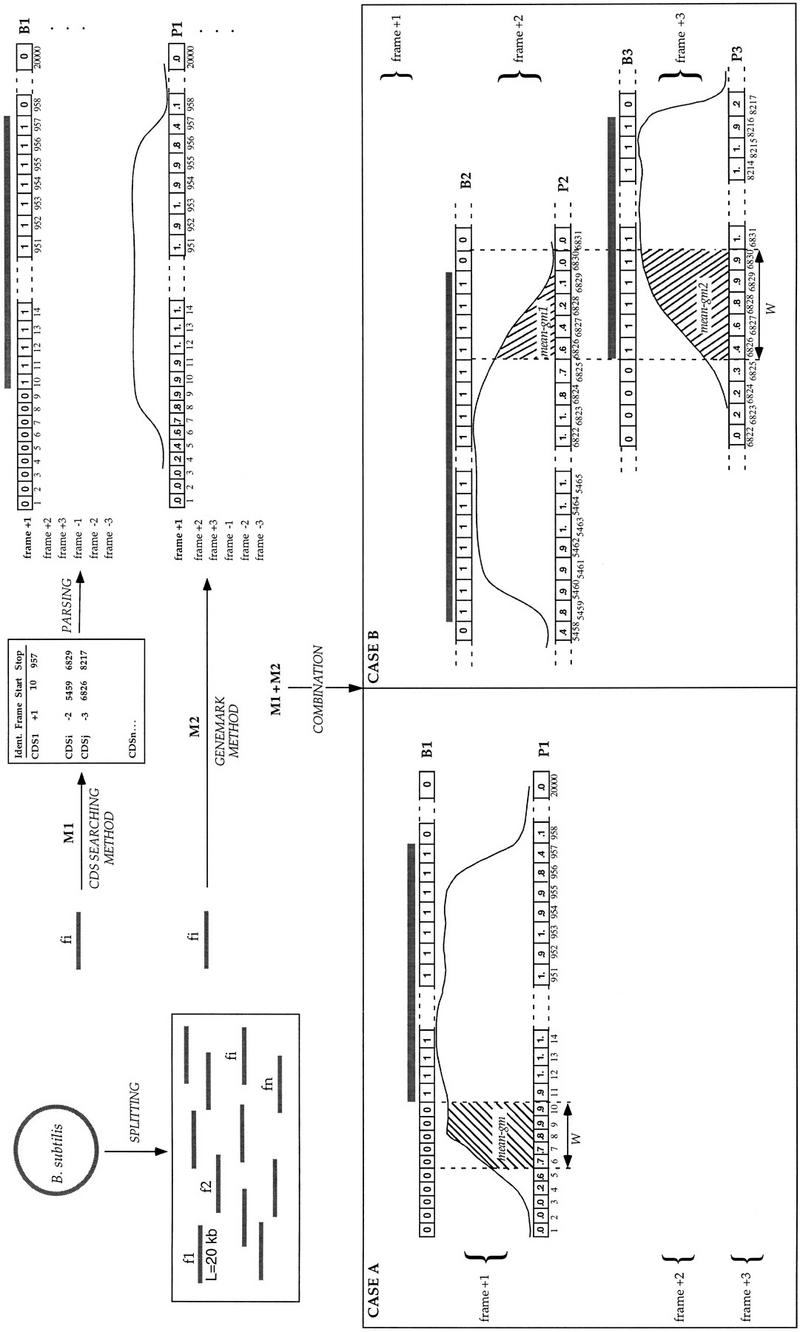
Schema of the ProFED method. The method makes use of intrinsic coding properties of the sequence (Methods section).
Overall Strategy of the Sequencing Errors Analysis
The two independent methods (FSBlastX and proFED) were used to screen the complete B. subtilis genome sequence (Kunst et al. 1997). For each putative sequencing error, a 500-bp fragment centered around the error was kept as an original sequence. One-hundred basepairs upstream and downstream of this fragment were extracted (indicated as pm1 and pm2 in Fig. 7a) for the design of suitable PCR primers for the amplification of the respective genomic B. subtilis DNA sequences. The size of the amplified fragments ranges from 500 to 700 basepairs. Amplified fragments were purified to remove excess primers (Qiaquick PCR Purification kit, Qiagen, Hilden, Germany) and directly applied as templates for the sequencing reaction. Both PCR primers were applied in separate cycle-sequencing reactions. Sequencing reactions were performed with Prism Dye Terminator Ready Reaction sequencing kits from Perkin Elmer (Weiterstadt, Germany). All sequence determination was performed on automated DNA sequencers (Perkin Elmer Biosystems Modells 373A and 377XL). In case of poor quality of sequencing, which was the case in up to 5% of the first round sequencing, we repeated the sequencing reaction to overcome problems resulting from pipetting mistakes during the sequencing reaction, the purification, the gel loading, or poor lane tacking. This worked in most of the cases, but if not, we designed a new primer and did the sequencing with the new primer again. The sequences of both strands were determined and compared.
Figure 7.
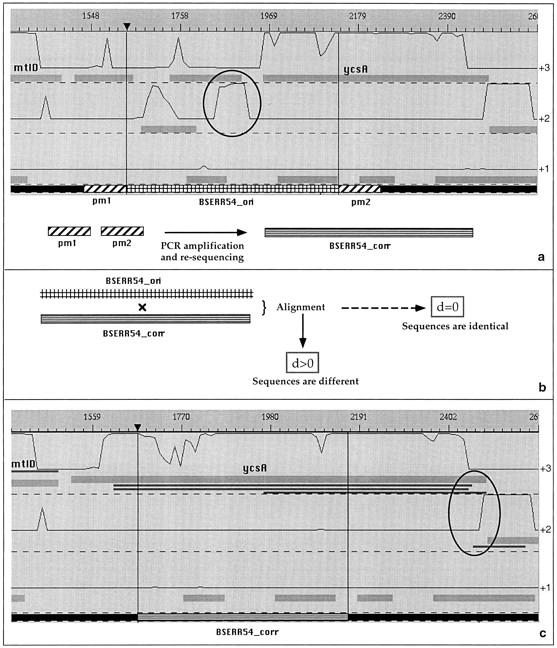
Overall strategy of sequencing error analysis. (a) Detection of a DNA region containing a putative sequencing error (BSERR54_ori), extraction of the two flanking regions (pm1, pm2 primers) and PCR resequencing of the fragment (BSERR54_corr). (b) alignment of the BSERR54_ori and BSERR54_corr fragments, and (c) replacement of the erroneous fragment in the B. subtilis chromosome. Here, the correction shows that the ycsA gene is actually longer than thought previously. Another frameshift error, circled in black, was additionally found by FSBlastX (BlastX hits are indicated by black rectangles).
In a second step, we made use of a dynamic programming algorithm (Smith and Waterman 1981) to perform a global alignment between the original and the resequenced fragment (Fig. 7b). The result of this alignment is a distance, which is either equal to zero when the two sequences are identical, or positive when the two sequences are different. To validate the correction, the DNA sequences were replaced by their corrected counterpart in a new version of the B. subtilis genome. The corrected chromosomal sequences were reanalyzed with the Imagene CDSs searching method and the coding prediction method. Comparison of the initial map (Fig. 7a) to the new one (Fig. 7c), allowed us to categorize the type of correction into the five categories described previously (1 to 1, n to 1, 1 to n, 0 to 1 and no change; see Results). For example, Figure 7 shows a correction in which an existing gene, ycsA, has become longer (hence called a 1-to-1 correction). The validated corrections will be made available in the next update of the SubtiList database (http://www.pasteur.fr/Bio/SubtiList.html).
Acknowledgments
This work was supported by the European Commission (contract BIO4-CT96-0655), the French Ministère de l'Enseignement et de la Recherche, the Centre National de la Recherche Scientifique (GDR 1029), the Groupement de Recherche et d'Étude sur les Génomes (GIP - 2 93 G404 00 71201 21) and the Pasteur Institute. We thank I. Moszer and E. Rocha for their critical comments and suggestions.
The publication costs of this article were defrayed in part by payment of page charges. This article must therefore be hereby marked “advertisement” in accordance with 18 USC section 1734 solely to indicate this fact.
Footnotes
E-MAIL claudine.medigue@snv.jussieu.fr; FAX 33 160 87 8301.
REFERENCES
- Altschul SF, Gish W, Miller W, Myers EW, Lipman DJ. Basic local alignment search tool. J Mol Biol. 1990;215:403–410. doi: 10.1016/S0022-2836(05)80360-2. [DOI] [PubMed] [Google Scholar]
- Altschul SF, Madden TL, Schäffer AA, Zhang J, Zhang Z, Miller W, Lipman DJ. Gapped BLAST and PSI-BLAST : A new generation of protein database search programs. Nucleic Acids Res. 1997;25:3389–3402. doi: 10.1093/nar/25.17.3389. [DOI] [PMC free article] [PubMed] [Google Scholar]
- Atkins JF, Weiss RB, Thompson S, Gesteland RF. Towards a genetic dissection of the basis of triplet decoding, and its natural subversion: Programmed reading frame shift and hops. Annu Rev Genet. 1991;25:201–228. doi: 10.1146/annurev.ge.25.120191.001221. [DOI] [PubMed] [Google Scholar]
- Atkins JF, Böck A, Matsufuji S, Gesteland RF. Dynamics of the genetic code. In: Gesteland RF, Cech TR, Atkins JF, editors. The RNA world. 2nd edition. Cold Spring Harbor, NY: Cold Spring Harbor Laboratory Press; 1999. pp. 637–673. [Google Scholar]
- Blinkowa AL, Walker JR. Programmed ribosomal frameshifting generates the Escherichia coli DNA polymerase III γ subunit from within the θ subunit reading frame. Nucleic Acids Res. 1990;18:1725–1729. doi: 10.1093/nar/18.7.1725. [DOI] [PMC free article] [PubMed] [Google Scholar]
- Borodovsky M, McIninch JD. GeneMark: Parallel gene recognition for both DNA strands. Comp Chem. 1993;17:123–133. [Google Scholar]
- Borodovsky M, McIninch J, Koonin E, Rudd K, Médigue C, Danchin A. Detection of new genes in the bacterial genome using Markov models for three gene classes. Nucleic Acids Res. 1995;23:3554–3562. doi: 10.1093/nar/23.17.3554. [DOI] [PMC free article] [PubMed] [Google Scholar]
- Brown NP, Sander C, Bork P. Frame: Detection of genomic sequencing errors. Bioinformatics. 1998;14:367–371. doi: 10.1093/bioinformatics/14.4.367. [DOI] [PubMed] [Google Scholar]
- Burkholder PR, Gilles NH. Induced biochemical mutations in Bacillus subtilis. Am J Bot. 1947;33:345–348. [PubMed] [Google Scholar]
- Chandler M, Fayet O. Translational frameshifting in the control of transposition in bacteria. Mol Microbiol. 1993;7:497–503. doi: 10.1111/j.1365-2958.1993.tb01140.x. [DOI] [PubMed] [Google Scholar]
- Claverie J-M. Detecting frame shifts by amino acid sequence comparison. J Mol Biol. 1993;234:1140–1157. doi: 10.1006/jmbi.1993.1666. [DOI] [PubMed] [Google Scholar]
- Craigen WJ, Cook RG, Tate WP, Caskey CT. Bacterial peptide chain release factors: Conserved primary structure and possible frameshift regulation of release factor 2. Proc Natl Acad Sci. 1985;82:3616–3620. doi: 10.1073/pnas.82.11.3616. [DOI] [PMC free article] [PubMed] [Google Scholar]
- Farabaugh PJ. Programmed translational frameshifting. Microbiol Rev. 1996;60:103–134. doi: 10.1128/mr.60.1.103-134.1996. [DOI] [PMC free article] [PubMed] [Google Scholar]
- Fichant GA, Quentin Y. A frameshift error detection algorithm for DNA sequencing projects. Nucleic Acids Res. 1995;23:2900–2908. doi: 10.1093/nar/23.15.2900. [DOI] [PMC free article] [PubMed] [Google Scholar]
- Fickett JW, Tung CS. Assessment of protein coding measures. Nucleic Acids Res. 1992;20:6441–6450. doi: 10.1093/nar/20.24.6441. [DOI] [PMC free article] [PubMed] [Google Scholar]
- Flower AM, McHenry CS. The gamma subunit of DNA polymerase III holoenzyme of Escherichia coli is produced by ribosomal frameshifting. Proc Natl Acad Sci. 1990;87:3713–3717. doi: 10.1073/pnas.87.10.3713. [DOI] [PMC free article] [PubMed] [Google Scholar]
- Fu C, Parker J. A ribosomal frameshifting error during translation of the argI mRNA of Escherichia coli. Mol Gen Genet. 1994;243:434–441. doi: 10.1007/BF00280474. [DOI] [PMC free article] [PubMed] [Google Scholar]
- Guan X, Uberbacher EC. Alignments of DNA and protein sequences containing frameshifts errors. Comput Appl Biosci. 1996;12:31–40. doi: 10.1093/bioinformatics/12.1.31. [DOI] [PubMed] [Google Scholar]
- Gribskov M, Devereux J, Burgess RR. The codon preference plot : Graphic analysis of protein coding sequences and prediction of gene expression. Nucleic Acids Res. 1984;12:539–549. doi: 10.1093/nar/12.1part2.539. [DOI] [PMC free article] [PubMed] [Google Scholar]
- Hayes SH, Borodovsky M. How to interpret an anonymous bacterial genome : Machine learning approach to gene identification. Genome Res. 1998;8:1154–1171. doi: 10.1101/gr.8.11.1154. [DOI] [PubMed] [Google Scholar]
- Henikoff S, Henikoff HG. Amino Acid substitution matrices from protein blocks. Proc Natl Acad Sci. 1992;89:10915–10919. doi: 10.1073/pnas.89.22.10915. [DOI] [PMC free article] [PubMed] [Google Scholar]
- Kunst F, Ogasawara N, Moszer I, Albertini AM, Alloni G, Azevedo V, Bertero MG, Bessières P, Bolotin A, Borchert S, et al. The complete genome sequence of the Gram-positive bacterium Bacillus subtilis. Nature. 1997;390:249–256. doi: 10.1038/36786. [DOI] [PubMed] [Google Scholar]
- Lawrence JG, Ochman H. Amelioration of bacterial genomes : Rates of change and exchange. J Mol Evol. 1997;44:383–397. doi: 10.1007/pl00006158. [DOI] [PubMed] [Google Scholar]
- Lukaskin AV, Borodovsky M. GeneMark.hmm: New solutions for gene finding. Nucleic Acids Res. 1998;26:1107–1115. doi: 10.1093/nar/26.4.1107. [DOI] [PMC free article] [PubMed] [Google Scholar]
- Lee CA, Saier MH., Jr Mannitol-specific enzyme II of the bacterial phosphotransferase system. J Biol Chem. 1983;258:10761–10767. [PubMed] [Google Scholar]
- Médigue C, Rouxel T, Vigier P, Hénaut A, Danchin A. Evidence for horizontal gene transfer in Escherichia coli speciation. J Mol Biol. 1991;222:851–856. doi: 10.1016/0022-2836(91)90575-q. [DOI] [PubMed] [Google Scholar]
- Médigue C, Rechenmann F, Danchin A, Viari A. Imagene: An integrated computer environment for sequence annotation and analysis. Bioinformatics. 1999;15:2–15. doi: 10.1093/bioinformatics/15.1.2. [DOI] [PubMed] [Google Scholar]
- Moszer I. The complete genome of Bacillus subtilis: From sequence annotation to data management and analysis. FEBS Lett. 1998;430:28–36. doi: 10.1016/s0014-5793(98)00620-6. [DOI] [PubMed] [Google Scholar]
- Nakano MM, Corbell N, Besson J, Zuber P. Isolation and characterization of sfp: A gene that functions in the production of the lipopeptide biosurfactant, surfactin, in Bacillus subtilis. Mol Gen Genet. 1992;232:313–321. doi: 10.1007/BF00280011. [DOI] [PubMed] [Google Scholar]
- Posfai J, Roberts RJ. Finding errors in DNA sequences. Proc Natl Acad Sci. 1992;89:4698–4702. doi: 10.1073/pnas.89.10.4698. [DOI] [PMC free article] [PubMed] [Google Scholar]
- Postma PW, Lengeler JW, Jacobson GR. Phosphoenolpyruvate : Carbohydrate phosphotransferase systems of bacteria. Microbiol Rev. 1993;57:543–594. doi: 10.1128/mr.57.3.543-594.1993. [DOI] [PMC free article] [PubMed] [Google Scholar]
- Richterich P. Estimation of errors in “raw” DNA sequences: A validation study. Genome Res. 1998;8:251–259. doi: 10.1101/gr.8.3.251. [DOI] [PMC free article] [PubMed] [Google Scholar]
- Salzberg SL, Delcher AL, Kasif S, White O. Microbial gene identification using interpolated Markov models. Nucleic Acids Res. 1998;26:544–548. doi: 10.1093/nar/26.2.544. [DOI] [PMC free article] [PubMed] [Google Scholar]
- Schwartz R, Curran JF. Analyses of frameshifting at UUU-pyrimidine sites. Nucleic Acids Res. 1997;25:2005–2011. doi: 10.1093/nar/25.10.2005. [DOI] [PMC free article] [PubMed] [Google Scholar]
- Smith TF, Waterman MS. Identification of common molecular subsequences. J Mol Biol. 1981;147:195–197. doi: 10.1016/0022-2836(81)90087-5. [DOI] [PubMed] [Google Scholar]
- Staden R. Finding protein coding regions in genomic sequences. Meth Enzymol. 1990;183:163–180. doi: 10.1016/0076-6879(90)83012-x. [DOI] [PubMed] [Google Scholar]
- ten Dam E, Pleij C, Bosch L. RNA pseudoknots: Translational frameshifting and readthrough of viral RNAs. Virus Genes. 1990;4:121–136. doi: 10.1007/BF00678404. [DOI] [PMC free article] [PubMed] [Google Scholar]
- Tsuchihashi Z, Kornberg A. Translational frameshifting generates the γ subunit of DNA polymerase III holoenzyme. Proc Natl Acad Sci. 1990;87:2516–2520. doi: 10.1073/pnas.87.7.2516. [DOI] [PMC free article] [PubMed] [Google Scholar]
- White O, Dunning T, Sutton G, Adams M, Venter JC, Fields C. A quality control algorithm for DNA sequencing projects. Nucleic Acids Res. 1993;21:3829–3838. doi: 10.1093/nar/21.16.3829. [DOI] [PMC free article] [PubMed] [Google Scholar]
- Wooton JC, Federhen S. Statistics of local complexity in amino acid sequences databases. Computers Chem. 1993;17:149–163. [Google Scholar]