

Abstract
At most synapses, presynaptic Ca2+ channels are positioned near vesicle release sites, and increasing this distance reduces synaptic strength. We examined the lateral membrane mobility of presynaptic L-type Ca2+ channels at photoreceptor ribbon synapses of the tiger salamander (Ambystoma tigrinum) retina. Movements of individual Ca2+ channels were tracked by coupling quantum dots to an antibody against the extracellular α2δ4 Ca2+ channel subunit. α2δ4 antibodies labeled photoreceptor terminals and colocalized with antibodies to synaptic vesicle glycoprotein 2 and voltage-gated Ca2+ channel 1.4 (CaV1.4) α1 subunits. The results show that Ca2+ channels are dynamic and move within a confined region beneath the synaptic ribbon. The size of this confinement area is regulated by actin and membrane cholesterol. Fusion of nearby synaptic vesicles caused jumps in Ca2+ channel position, propelling them toward the outer edge of the confinement domain. Channels rebounded rapidly toward the center. Thus, although CaV channels are mobile, molecular scaffolds confine them beneath the ribbon to maintain neurotransmission even at high release rates.
Introduction
Synaptic transmission requires Ca2+ entry through voltage-gated Ca2+ (CaV) channels positioned close to synaptic release sites (Neher, 1998; Zenisek et al., 2003; Beaumont et al., 2005; Bucurenciu et al., 2008; Jarsky et al., 2010; Mercer et al., 2011). The speed and efficacy of vesicle release diminishes with increasing distance from CaV channels (Augustine et al., 1991; Meinrenken et al., 2003; Schneggenburger and Neher, 2005). It is known that lateral movements of postsynaptic receptors can contribute to rapid regulation of synaptic strength (Adesnik et al., 2005; Groc et al., 2008), but the mobility of presynaptic CaV channels has not been explored.
Release of synaptic glutamate from retinal photoreceptor cells is regulated by the activity of L-type CaV channels (Thoreson and Witkovsky, 1999; Morgans et al., 2001; McRory et al., 2004; Wu et al., 2007). The synaptic ribbon is the major site of vesicle release in both rod and cone photoreceptors (Heidelberger et al., 2005), and CaV channels are clustered at the base of the ribbon (Morgans, 2001; tom Dieck et al., 2005), <100 nm from vesicle release sites (Mercer et al., 2011). L-type CaV channels are composed of a pore-forming α subunit, with accessory β, α2δ and γ subunits (Catterall, 2000). Mutations in the α2δ4 subunit disrupt photoreceptor ribbon synapses, implicating this subtype as the principal α2δ isoform in photoreceptors (Wycisk et al., 2006a,b). Each α2δ subunit possesses a large extracellular domain accessible to binding reagents for mobility studies; we therefore chose the α2δ4 subunit as a target for labeling CaV channels in living tissue.
Quantum dots (QDs) have proven a useful reagent for tracking the mobility of synaptic proteins. QDs are nanometer-scale particles that provide a bright point source of light that is resistant to photobleaching. By fitting QD fluorescence with a Gaussian function, QD position can be specified to a resolution of ≤30 nm, far exceeding the diffraction limit of light. In the present study, we analyzed presynaptic CaV channel mobility at photoreceptor synapses by tracking the movements of individual CaV channels in living retina labeled with QDs conjugated to an α2δ4 antibody (Qin et al., 2002; Bannai et al., 2006).
Our results show that CaV channels at rod and cone synapses are not fixed, but move within a membrane domain equal to or slightly larger than the area beneath the synaptic ridge at the base of the ribbon. Pharmacological disruption of the cytoskeleton or membrane cholesterol significantly increased the dimensions of the confinement domain of CaV channels, suggesting that macromolecular scaffolds are important for organizing the synapse. Consistent with the proposal that synaptic vesicle fusion may cause a disorganization of presynaptic release proteins (Neher and Sakaba, 2008), we found that fusion of adjacent synaptic vesicles caused brief jumps in CaV channel position, propelling channels toward the edge of the confinement domain. We conclude that CaV channels are mobile, but molecular scaffolds maintain channels within a confinement area beneath the ribbon to support synaptic release even at high rates.
Materials and Methods
Animal care and use.
Use of both male and female aquatic tiger salamanders (Ambystoma tigrinum, 18–25 cm in length; Kons Scientific and Charles D Sullivan Co.) for experiments was approved by the University of Nebraska Medical Center Institutional Animal Care and Use Committee. Animals were maintained on a 12 h light/dark cycle and were killed 1–2 h after the beginning of subjective night. Salamanders were decapitated with heavy shears and immediately pithed.
Immunohistochemistry.
Whole eyes were surgically removed from the animal and placed in 4% paraformaldehyde for 4 h. Eyes were then transferred to 30% sucrose overnight. Fixed eyes were set in OCT compound (Sakura Finetek USA) and sliced into 20 μm sections using a Leica CM 1800 Cryostat. Tissue sections were blocked in 0.1 m PBS containing 10% normal serum and 0.2% Triton X-100, and then incubated overnight with primary antibodies. The following day slices were washed with PBS and incubated with a fluorescent secondary antibody for 3 h. After washing with PBS, slices were mounted using Vectashield (Vector Laboratories). Sections were visualized using a laser confocal scanhead (UltraVIEW Live Cell Imaging System; PerkinElmer) equipped with a cooled CCD camera (Orca ER; Hamamatsu) mounted to a fixed-stage upright microscope (E600FN; Nikon) with a water-immersion objective [60×, 1.0 numerical aperture (NA), Nikon]. Z-stack image series were captured at 1 μm intervals for image analysis using an exposure of 2.5 s per image. FITC- or Alexa Fluor 488-conjugated antibodies were imaged in fixed tissue using an excitation wavelength of 488 and 525 nm bandpass emission filter. Living tissue was imaged using a 525 nm long-pass emission filter. Alexa Fluor 568-conjugated antibodies were imaged using an excitation wavelength of 568 nm and a 620 nm bandpass emission filter.
We examined QD binding to fixed tissue by coupling a biotinylated goat-anti-rabbit IgG (1 h, 1:2000 dilution; Jackson ImmunoResearch) to the primary rabbit anti-α2δ4 antibody (1:1000 dilution; courtesy Dr. Ning Qin, Johnson & Johnson Pharmaceutical Research and Development, Spring House, PA), followed by application of streptavidin-coated QDs (10 nm; Invitrogen) for 15 min. QD binding was imaged on the confocal microscope using a 488 nm excitation/long-pass emission filter. Grayscale images were adjusted for brightness and contrast, and colors were added using Adobe Photoshop.
Antibodies and peptides.
A rabbit polyclonal anti-α2δ4 antibody was used at a dilution of 1:1000 to recognize the extracellular epitope of CaV channels. To confirm synaptic labeling by the anti-α2δ4 antibody, we colabeled samples using a mouse monoclonal antibody to synaptic vesicle glycoprotein 2 (SV2) (1:1000 dilution; Developmental Studies Hybridoma Bank, University of Iowa) or a sheep antibody to the CaV1.4 (α1F) subunit (1:2500 dilution; courtesy of Dr. Catherine Morgans, Oregon Health Sciences University, Portland, OR). As a control, we used an antigenic peptide (sequence Ac-KVSDRKFLTPEDEASVC-amide) (Qin et al., 2002) to the anti-α2δ4 antibody (Peptide 2.0) to block antibody binding. Sections were visualized using goat FITC anti-rabbit (1:2000) (Sigma-Aldrich), goat Alexa Fluor 568 anti-mouse (1:2000), goat Alexa Fluor 568 anti-rabbit (1:2000), and donkey Alexa Fluor 488 anti-sheep (1:10,000) secondary antibodies (Invitrogen).
Retinal tissue preparation.
Enucleated eyes from killed animals were prepared by surgically removing the cornea, iris, and lens. The resultant eyecup was quartered and placed vitreous side down onto a 2 × 5 mm piece of filter paper (type AAWP, 0.8 μm pores; Millipore) to isolate the retina. Retinal tissue was sliced into 125 μm sections using a razor blade tissue chopper (Stoelting) fitted with a #121–6 razor blade (Ted Pella). Slices were rotated 90° to view the vertical stratification of the retina under a water-immersion objective (60×, 1.0 NA) on an upright microscope (E600FN). Throughout the procedure, tissue was maintained in an amphibian extracellular saline solution consisting of the following (in mm): 111 NaCl, 2.5 KCl, 1.8 CaCl2, 0.5 MgCl2, 10 HEPES, and 5 glucose, pH 7.8. For experiments requiring dissociated photoreceptors, a whole salamander retina was isolated and incubated in 0.5 mm Ca2+ amphibian extracellular saline solution containing 0.2 mg/ml cysteine and 10 U/ml papain (Sigma-Aldrich) for 25 min at 20°C. Tissue was washed once in low Ca2+ saline solution containing 1% bovine serum albumin (BSA) and 1 mg/ml DNase (Worthington Biochemicals) followed by two additional washes in low Ca2+ saline. To isolate individual neurons, retinal tissue was carefully triturated using a fire-polished glass pipette and plated onto 18 mm coverslips (Deckgläser) coated with 1 mg/ml concanavalin-A.
QD binding and pharmacology.
Retinal slices were prepared as described above in amphibian saline solution supplemented with 1% BSA. Slices were then washed three times in BSA-free amphibian saline. Primary rabbit anti-α2δ4 subunit antibody was applied in BSA-free saline at a dilution of 1:1000 for 3 h at 4°C. Secondary biotinylated goat-anti-rabbit IgG (1:2000) was incubated on retinal slices for 1 h at 4°C and then conjugated to streptavidin-coated 525 nm emission QDs (20 nm; Invitrogen) for 15 min. In some experiments, tissue was incubated with the actin disruptor cytochalasin-D (cytD; 20 μm) or with the cholesterol depleting agents cholesterol oxidase (COase; 2 U/ml) or methyl-β-cyclodextrin (MβCD; 10 mm). The activities of these drugs were evaluated by examining retinas stained for actin filaments using 0.2 μm FITC-phalloidin or labeled for lipid raft ganglioside GM1 glycoproteins using 1 μg/ml FITC-cholera toxin B. Unless otherwise stated, pharmacological reagents were purchased from Sigma-Aldrich.
QD tracking and motion analysis.
To track QD-tagged CaV channels at photoreceptor synapses in retinal slices, cells were visualized on an upright microscope (E600FN) through a water-immersion objective (60×, 1.0 NA) and FITC filter cube (Chroma Technology) using an EMCCD camera (DS-Qi1; Photometrics). CaV channels in dissociated photoreceptors were visualized on an IX71 inverted microscope (Olympus) with a 60×, 1.45 NA objective and a cooled EMCCD (ImageM-1K, Hamamatsu). Fluorescence was provided by an Hg/Xe arc lamp (OptiQuip) operating at 150 W, controlled by a Lambda 10–2 shutter (Sutter Instruments) and connected to the microscope by a liquid light guide. QDs were selected for tracking analysis only if they were localized to photoreceptor terminals, exhibited a small size (four or fewer pixels) and showed intermittent blinking; these criteria are consistent with labeling by a single quantum dot (Alcor et al., 2009). The location of a QD can be determined with precision exceeding the diffraction limit by fitting the fluorescence profile with a Gaussian point spread function (Courty et al., 2006). To estimate pointing accuracy, we measured the SD of displacements exhibited by QDs immobilized in vacuum grease and found that they averaged 96 nm on the upright microscope (11 QDs, 100 measurements/QD) and 15 nm on the inverted microscope (10 QDs). Videos were captured at 16–50 ms per frame for 20 s using NIS-Elements (Nikon). Images were adjusted to optimize QD contrast and smoothed by convolving with a 5 × 5 pixel Gaussian. QD position was then tracked using NIS-Elements software. From the x and y coordinates, we calculated the mean squared displacement (MSD; in square micrometers per second) (Saxton, 1997) using the following equation:
 |
The diffusion coefficient (D) was calculated from the initial slope of MSD versus time (t) during the first four data points. Because the plateau in the MSD versus time plot was obtained very quickly, it was necessary to use data acquired at a rate of 16 ms per frame measured in dissociated photoreceptors. The value for D was determined using the following equation:
We calculated the confinement area that a given CaV channel traverses about the presynaptic plasma membrane using Equation 3:
 |
In this equation, L2 provides the surface area that a given channel traverses, in square micrometers.
For a particle moving freely in solution, one can treat all three planes of movement as independent. However, movements in a lipid bilayer are limited to two dimensions. Because movements along any membrane that projects in the z-axis cannot be visualized by conventional microscopy, z-axis movements are neglected in calculations of the MSD. Calculated confinement areas and diffusion coefficients therefore represent lower bounds of the true values (Hall, 2008).
Electrophysiology.
Voltage-clamped photoreceptors were stimulated by applying depolarizing test pulses (−70 to −10 mV, 100 ms) to evoke synaptic release and determine whether synaptic vesicle fusion changed the mobile properties of CaV channels. Whole-cell recording electrodes were pulled using a PP-830 vertical puller (Narishige International USA) from borosilicate glass pipettes (1.2 mm outer diameter, 0.9 mm inner diameter, with an internal filament; World Precision Instruments) with tips 2 μm in diameter and resistance values between 12 and 18 MΩ. Recording electrodes were positioned using Huxley–Wall micromanipulators (Sutter Instruments). Photoreceptors with a QD bound to the synaptic terminal were voltage-clamped using a Multiclamp amplifier, Digidata 1322 interface, and pClamp 9.2 (MDS Analytical Devices). We selected cells that exhibited healthy calcium currents (>50 pA as determined by a ramp voltage protocol, −90 to +60 mV, 0.5 mV/ms) and required modest holding currents (<200 pA) to voltage-clamp the cell at the steady holding potential of −70 mV. The patch pipette solution contained the following (in mm): 40 cesium glutamate, 50 cesium glutamate, 9.4 TEACl, 3.5 NaCl, 1 CaCl2, 1 MgCl2, 9.4 MgATP, 0.5 GTP, 5 EGTA, and 10 HEPES, pH 7.2. The presence of glutamate in the patch pipette maintains vesicle release and postsynaptic responses for up to 20 min after the initial whole-cell rupture into a photoreceptor (Bartoletti et al., 2010). For RIBEYE imaging experiments, we introduced a fluorescent peptide into the patch pipette solution (80 μm HyLite-488-EQTVPIDLSERDR) (Zenisek et al., 2004; Zenisek, 2008) that selectively labels the ribbon by binding to the CtBP domain of RIBEYE.
To examine the effects of vesicle release on CaV channel position, we applied the test step 5 s into a 10 s image series. Test pulses were separated by 1 min to allow for replenishment of the synaptic vesicle pool (Rabl et al., 2005). From these experiments, we measured the distance of QD-bound CaV channels from the center of the confinement domain. To find the center point along the x-axis (xcenter), we binned the distribution of x positions throughout the entire 10 s trial and fit the resulting histogram with a Gaussian function. We repeated this procedure to find the center point along the y-axis (ycenter). The radial distance from the center point (r) was then calculated using the following function:
Statistical analysis.
Results are presented as the mean ± SEM, and p values <0.05 were considered significant. Data were analyzed using Prism 4 (GraphPad Software), and statistical significance between experimental conditions was determined using Student's t test.
Results
α2δ4 antibody localization and QD conjugation
The disruption of photoreceptor synapses by α2δ4 subunit mutations suggests its role as the principal α2δ isoform in photoreceptors (Wycisk et al., 2006a,b). We tested this by using an anti-α2δ4 antibody in salamander retina slices. By indirect immunofluorescence using an FITC-conjugated secondary antibody, we found that antibodies against an extracellular epitope of α2δ4 labeled photoreceptor synapses in the outer plexiform layer (OPL) and bipolar cell synapses in the inner plexiform layer (IPL) (Fig. 1A). Aside from autofluorescence due to flavoproteins in the mitochondrial-rich ellipsoid (Kunz and Kunz, 1985), the fluorescence signal was absent when the primary antibody was applied in the presence of the peptide used to generate the α2δ4 antibody (Fig. 1B) or when the primary antibody was omitted altogether (data not shown). Although labeling was less robust, the α2δ4 antibody also labeled the inner and outer plexiform layers of living retinal slices (Fig. 1C). These observations are consistent with the suggestion that α2δ4 is the principal α2δ subunit in retina (Wycisk et al., 2006a,b) and that L-type CaV channels are localized to photoreceptor synapses in the OPL, and to bipolar cell synapses in the IPL (Heidelberger et al., 2005).
Figure 1.

α2δ4 Antibodies label photoreceptor synapses in the OPL. A, The α2δ4 antibody localized to photoreceptor synapses in the OPL and bipolar cell synapses in the IPL in fixed retina tissue where CaV channels are located. B, α2δ4 antibody staining was eliminated by introducing an antigenic peptide during incubation with the primary antibody. C, α2δ4 antibody also labeled the OPL and IPL in living retinal tissue. D–F, α2δ4 (D, green) colocalized with SV2 (E, red), in the OPL and IPL (merge shown in F). G–I, The α2δ4 antibody (G, red) colocalized with antibodies to the pore-forming subunit of CaV1.4/α1F (H, green) in the OPL and IPL (merge shown in I). Scale bar, 45 μm. OS, Outer segment; ONL, outer nuclear layer; INL, inner nuclear layer.
We confirmed the synaptic localization of the α2δ4 antibody by colabeling retinal slices with an antibody to SV2 (Wang et al., 2003). α2δ4 labeling in the OPL and IPL (Fig. 1D) exhibited extensive colocalization with immunofluorescent labeling for SV2 (Fig. 1E,F), consistent with localization of the α2δ4 antibody to photoreceptor synaptic terminals, where CaV channels are concentrated. Antibodies to the α2δ4 subunit (Fig. 1G) also showed extensive colabeling with antibodies to the pore-forming α1 subunit of CaV1.4 (Fig. 1H,I), showing a close association between the two Ca2+ channel subunits. Western blots using whole salamander retinal lysate and the α2δ4 antibody produced a band at 150 kDa, as expected for the α2δ4 subunit, and another band at ∼130 kDa consistent with α2 subunits dissociated from δ subunits under reducing conditions (Qin et al., 2002; Andrade et al., 2007) (data not shown).
Streptavidin-coated QDs were conjugated to the anti-α2δ4 antibody by attaching a biotinylated goat anti-rabbit secondary IgG to the anti-α2δ4 antibody followed by a brief incubation with 525 nm streptavidin-coated QDs. IgG binding and streptavidin–biotin linking are two of the strongest known organic bonds (Diamandis and Christopoulos, 1991) providing an adequate QD–CaV channel anchor for biophysical studies. Figure 2A shows QD labeling in the OPL and IPL of a fixed retina section with punctate QD signals throughout the layers. QD labeling in the OPL and IPL was eliminated in living and fixed tissue by omission of the primary antibody (Fig. 2B) or coincubation of the α2δ4 antibody with an antigenic peptide. Figure 2C shows QD labeling in living tissue overlaid with a bright-field image of the retinal slice. The prominent autofluorescence of mitochondrial flavoproteins in the inner segments is due to the long exposure time (5 s) of the fluorescence image. Figure 2D shows a magnified view of the OPL (Fig. 2C, bounded by the box) with punctate CaV channel-bound QDs denoted by arrows. These findings reiterate the specificity of the anti-α2δ4 antibody and show that nanometer-scale QDs can be targeted to the photoreceptor synaptic layer.
Figure 2.

QDs conjugated to the α2δ4 antibody label the OPL. A, QDs attached to the α2δ4 antibody labeled the OPL and IPL of fixed retina tissue. B, Incubating retinal tissue without the primary α2δ4 antibody, but with biotinylated goat IgG antibodies, and QDs does not result in nonspecific binding. C, QDs attached to the α2δ4 antibody also labeled the OPL in living retina slices. Autofluorescence of mitochondrial flavoproteins in the inner segments was heightened by the long exposure times used to acquire these images. D, Inset from C to show individual QDs (arrows) in the OPL. Scale bar, 45 μm.
As an additional test that labeled CaV channels localize near the ribbon, we obtained whole-cell recordings from dissociated QD-labeled photoreceptors and used a patch pipette to introduce a peptide tagged with the fluorophore Hylite488 to selectively label the ribbon by binding to RIBEYE (Zenisek et al., 2004; Zenisek, 2008). Consistent with localization of CaV channels at the ribbon, the binding of Hylite488 to the ribbon following patch rupture caused a rapid increase in fluorescence levels around the QD (Fig. 3). Similar results were observed in rods and cones from both isolated cell preparations (N = 6 rods, N = 4 cones) and retinal slice preparations (N = 8 rods, N = 4 cones).
Figure 3.

Colocalization of synaptic ribbons and QD-tagged CaV channels. CaV channels in dissociated cells were labeled with QDs as described in Materials and Methods. Ribbons were then labeled by using a patch pipette to introduce a fluorescently labeled peptide (Hylite-488-EQTVPIDLSERDR) (Zenisek et al., 2004; Zenisek, 2008) that selectively labels the ribbon by binding to the CtBP domain of RIBEYE. A, Fluorescence image of a cone before patch rupture showing a single QD in the terminal (arrow). B, Fluorescence image obtained ∼2 min later showed an increase in fluorescence surrounding the QD after binding of peptide to the ribbon. Scale bar, 10 μm.
Biophysical characterization of CaV channel movements
The mobility of CaV channels at the photoreceptor synapse was analyzed from the movements of single QD-conjugated CaV channels over time. QDs were imaged at a rate of 16–50 ms per frame for 10–20 s. Trajectory plots for QD-conjugated CaV channels in a rod and cone are illustrated in Figure 4, A and B. To evaluate contributions of camera noise and possible wobble of the tethered QD, we also examined the apparent movements of QDs tagged to CaV channels in fixed tissue or embedded in vacuum grease (Fig. 4C). The tissue itself produced negligible movements, as determined by tracking single bright spots on photoreceptors under bright-field illumination.
Figure 4.

Trajectory maps of CaV channel movements at rod and cone synapses versus immobilized QDs. Individual trajectory points (3A, 3B, 3C) showing the coordinates of a single QD every 50 ms during a 20 s acquisition. A–C, CaV channels at the synapses of rods (A) and cones (B) exhibited larger fields of displacement compared with an immobile dot (C).
MSD in the x and y dimensions was calculated using Equation 1. We subtracted the MSD measurements of immobilized QDs (Fig. 5A, circles) from the MSD measurements made in living rods (Fig. 5A, squares) and cones (Fig. 5A, triangles). The presence of a plateau in the MSD plot indicates that CaV channel movement is confined within a limited spatial domain (Saxton and Jacobson, 1997). The asymptote of the relationship between MSD and time approaches L2/3 (Bannai et al., 2006). We measured the asymptote by fitting the data with Equation 3. The asymptote measured from baseline-corrected MSD data in rods indicated a confinement area of 0.29 μm2 (N = 21). Consistent with smaller ribbons in cones, they exhibited a smaller confinement area of 0.19 μm2 (N = 21, p < 0.05) (Fig. 5B).
Figure 5.
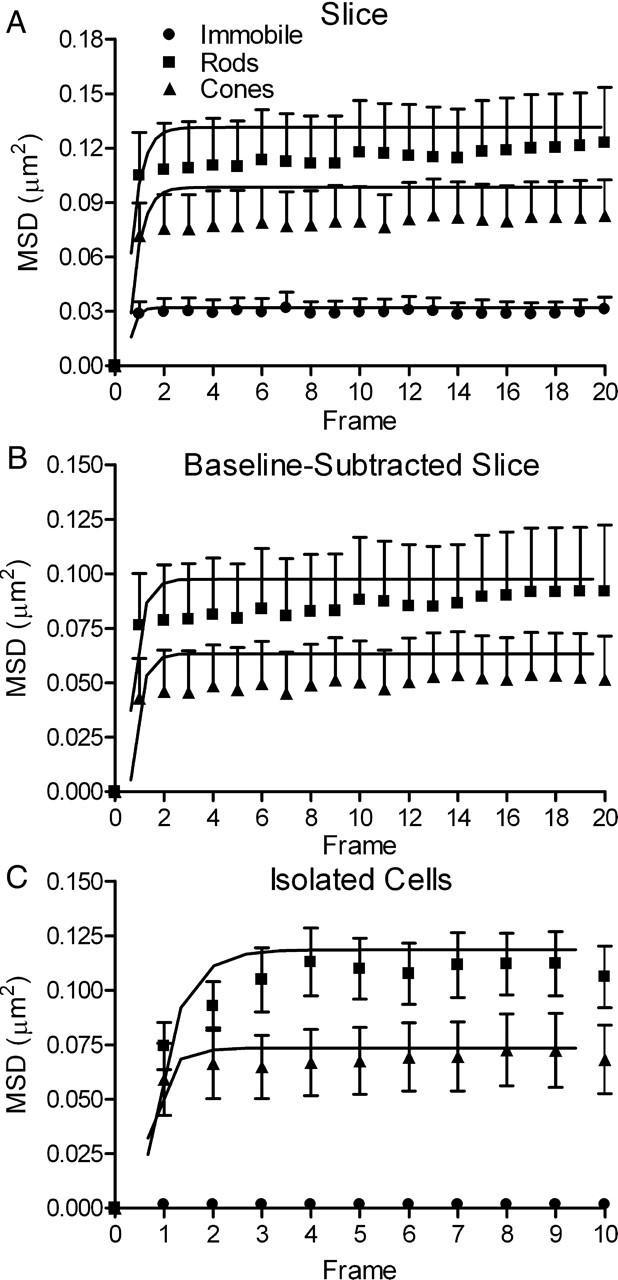
CaV channel movements at photoreceptor synapses are confined to limited domains. A, Measurements of QDs in slice preparations imaged with an upright microscope and 60×, 1.0 NA objective (rods, filled squares, N = 21; cones, filled triangles, N = 21; immobile QDs, filled circles, N = 9). Baseline noise was measured by observing QDs immobilized in vacuum grease. The MSD profiles rapidly reached a plateau, suggesting that CaV channels move within a confined domain (Saxton and Jacobson, 1997). B, C, MSD measurements after baseline subtraction of the noise measured with immobilized dots (B) yielded confinements areas similar to those measured using a higher NA objective to study dissociated photoreceptors (C). Confinement areas were calculated by fitting the data with Equation 3. Rods, L2 = 0.29 μm2; cones, L2 = 0.19 μm2. C, Measurements of CaV channel motion made in dissociated photoreceptors using an inverted microscope with a 60×, 1.45 NA objective (rods, N = 8, L2 = 0.34 μm2; cones, N = 10, L2 = 0.22 μm2). Immobilized QDs, N = 10).
We compared measurements in photoreceptors from retinal slices with the mobility of individual CaV channels measured in dissociated photoreceptors using an inverted microscope with a higher NA objective (1.45) and different EMCCD camera. Baseline noise from immobile QDs (N = 10) on the inverted microscope setup was negligible (Fig. 5C). CaV channels in dissociated rods (N = 8) and cones (N = 10) showed confinement areas of 0.36 and 0.22 μm2, similar to baseline-subtracted confinement areas found in retinal slices (Fig. 5C).
The protein bassoon is thought to tether CaV channels to the synaptic ribbon (Dick et al., 2003), so we examined the mobility of individual ribbons. To do so, we obtained whole-cell recordings from dissociated rods and cones, and introduced the fluorescent ribeye-binding peptide through the patch pipette. The Hylite488-conjugated peptide selectively binds to the ribbon and provides a bright point source for tracking analysis. Individual ribbons yielded a plateau in the MSD plot of 3.9 × 10⁻² μm2 (N = 6), much less than CaV channel displacement. This suggests that the ribbon is far less dynamic than CaV channels in the plasma membrane below.
Some of the channel movements likely reflect small movements of the overlying ribbon. Subtracting the confinement area for ribbon movement yields confinement areas for channel movements of 0.25 μm2 in rods and 0.15 μm2 in cones. Assuming that CaV channels are confined within the 200–300-nm-wide region between vesicles flanking the ribbon (Raviola and Gilula, 1975), this suggests long axes for channel movements of 0.8–1.3 μm in rods and 500–800 nm in cones. These are similar to ribbon lengths of ∼1 μm in rods and ∼400 nm in cones from salamander retina (Lasansky, 1973; Townes-Anderson et al., 1985; Pang et al., 2008).
Plots of particle trajectories sometimes showed elongated profiles (Fig. 4), consistent with the possibility that Ca2+ channels are confined in a rectangular or elliptical region beneath the ribbon. Linear correlation coefficients (r) determined for each trajectory plot ranged from 0.012–0.52 in rods and 0.018–0.6 in cones. If channels diffuse freely within a rectangular domain of 250 × 1000 nm in rods, then 80% of the movement vectors should be in the direction of the long axis and 20% of the movement vectors should occur along the short axis. Movements along the long axis should therefore show a maximal r value approaching 0.8 in rods. Similarly, movement within a 250 × 500 nm domain in cones would imply a maximum linear correlation of 0.67. Given that ribbons in living retinal tissue are oriented randomly in three dimensions, the finding that correlation coefficients for movement trajectories ranged from 0.012 to 0.52 in rods and 0.018 to 0.6 in cones is consistent with the predicted ranges of correlation coefficients from 0 to 0.8 in rods and 0 to 0.67 in cones. Thus, the size of the confinement domains and correlated movements of individual channels are both consistent with the hypothesis that Ca2+ channels are mobile, but confined within a region along the synaptic ridge beneath the ribbon (Mansergh et al., 2005; Jackman et al., 2009).
From the linear slope of the relationship between MSD and time measured in dissociated cells over the first four data points (0–64 ms) (Fig. 6), we calculated that the diffusion coefficient for CaV channels averaged 0.22 ± 0.15 μm2/s in rods (N = 12) and 0.13 ± 0.12 μm2/s in cones (N = 12). Since these values did not differ significantly (p = 0.56), we averaged data from rods and cones together to obtain an overall diffusion coefficient for photoreceptor CaV channels of 0.17 ± 0.10 μm2/s. This is within the range of diffusion coefficients found for other ion channels (D = 8 × 10⁻⁴ to 2.5 μm2/s) (Dahan et al., 2003; Bates et al., 2006; Jin et al., 2007; Groc et al., 2008; Mikasova et al., 2008; Bannai et al., 2009; Gómez-Varela et al., 2010).
Figure 6.

Rate of CaV channel mobility. The diffusion coefficient was determined from the slope of the MSD versus time relationship during the first four time points in measurements of QD displacement in dissociated photoreceptors. Images were captured at a rate of 16 ms per frame. Rod CaV channels (N = 12) moved at a rate of 0.22 ± 0.15 μm2/s, and cone CaV channels (N = 12) moved at a rate of 0.13 ± 0.12 μm2/s. These two values did not differ significantly (p = 0.56).
Synaptic scaffold disruption
We hypothesized that intracellular scaffolds help to localize CaV channels within the confinement domain at the ribbon synapse, and that pharmacological disruption of these architectural components would increase channel mobility. We targeted two important organizing components: the actin cytoskeleton and membrane cholesterol (Cooper and McLaughlin, 1984; Davies et al., 2006; Cristofanilli et al., 2007; Renner et al., 2009). Applying the actin-disrupting drug cytD (4 h, 20 μm) reduced actin levels in the OPL detected by FITC-phalloidin (0.2 μm) (Fig. 7A, control, B, cytD). We also tested latrunculin-B (4 h, 5 μm) but found that it produced substantial cell damage. We tested two cholesterol-depleting drugs, MβCD (1 h, 10 mm) and COase (1 h, 2 U/ml), and found that both depleted lipid raft components from the OPL, as detected by FITC-cholera toxin B staining (Fig. 7C, control, D, COase, E, MβCD). Disrupting actin with cytD (N = 16) or depleting membrane cholesterol with MβCD (N = 17) or cholesterol oxidase (N = 16) significantly increased the size of the confinement domain (p < 0.0001) (Fig. 8) from a mean of 0.24 μm2 (solid back circles) in untreated photoreceptors (rods and cones pooled together) to 0.77 μm2 (cytD; black triangles), 0.91 μm2 (COase; open diamonds), and 1.5 μm2 (MβCD; open circles). Effects of these drugs were similar in both photoreceptor subtypes. Voltage-clamp recordings from rods and cones showed no significant change in whole-cell Ca2+ currents (ICa) measured using a ramp voltage protocol after treatment with these compounds (data not shown).
Figure 7.

Effects of synaptic scaffold disrupting agents visualized using fluorescent microscopy. A, In control conditions, FITC-phalloidin produced strong actin labeling in the OPL and IPL. B, 4 h treatment with 20 μm cytD diminished staining in the OPL and IPL. There was also a noticeable increase in fluorescence within the somas of rods and cones after application of cytD, suggesting that synaptic actin had been depolymerized and dispersed throughout the cells. C, In control conditions, lipid rafts visualized with 1 μg/ml FITC-cholera toxin B show that the OPL is enriched with cholesterol. Strong staining surrounding rod somas was also apparent in more distal regions of the ONL. D, E, Staining was reduced after depletion of cholesterol by 1 h treatment with COase (D, 2 U/ml) or MβCD (E, 10 mm). Both treatments also diminished strong staining at the periciliary border at the base of the inner segment. Scale bar, 45 μm.
Figure 8.

Actin and cholesterol disruption decreases CaV channel confinement. Actin disruption and cholesterol depletion increased CaV channel mobility and confinement domains. A–D, QD trajectories spanned a much larger domain than control (A) and after treatment with cytD (B), MβCD (C), or COase (D). E, Confinement areas increased from 0.24 μm2 (solid back circles) in untreated photoreceptors (rods and cones pooled together) to 0.77 μm2 (cytD; black triangles), 0.91 μm2 (COase; open diamonds), and 1.5 μm2 (MβCD; open circles).
Photoreceptor stimulation
It has been hypothesized that membrane expansion following the fusion of synaptic vesicles might disrupt the presynaptic active zone and thereby contribute to changes in synaptic strength (Neher and Sakaba, 2008; Hosoi et al., 2009). We tested whether fusion of nearby synaptic vesicles alters the lateral movements of presynaptic CaV channels by obtaining voltage-clamp recordings from cones whose terminals were tagged with the α2δ4 antibody–QD complex. We applied strong depolarizing test pulses from −70 to −10 mV (100 ms) that are sufficient to stimulate release of the entire readily releasable pool (RRP) (Rabl et al., 2005; Bartoletti et al., 2010). Vesicles at the photoreceptor synapse have an average diameter of 45 nm (Lasansky, 1973; Thoreson et al., 2004). Exocytosis of the RRP releases ∼20 vesicles per ribbon at cone synapses (Bartoletti et al., 2010), and should therefore add ∼0.51 μm2 of vesicle membrane to the plasma membrane, more than the size of CaV channel confinement domains in cones.
To measure CaV channel displacements, we calculated the displacement of vector movements in both dimensions, as follows:
Depolarizing stimulation evoked detectable increases in displacement in 8 of 10 cones; an example of CaV channel displacement is shown in Figure 9A. A trajectory map of this trial is shown in Figure 9B. Detectable displacement jumps could be evoked by repeated stimulation of the same cell (N = 5 cells). The absence of detectable changes in displacement in two cones is likely due to the failure of those particular photoreceptors to release glutamate, but could also be due to inherently small channel movements or stimulation-evoked movements perpendicular to the plane of visualization. The depolarizing test pulse did not produce detectable movement of the patch electrode or surrounding retinal tissue. In addition, there was no change in displacement (N = 16 trials in 5 cells) after blocking CaV channels with 100 μm cadmium, indicating that the movements required Ca2+ influx as expected for vesicle fusion. As shown by examples in Figure 9, displacement increased within the first 50 ms frame during the test pulse, consistent with the finding that fusion of the RRP is complete in <50 ms (Cadetti et al., 2005; Bartoletti et al., 2010). The average displacement from 15 trials in eight cones is shown in Figure 9C. Although the rate of synaptic release declined after the first 50 ms (Cadetti et al., 2005; Bartoletti et al., 2010), CaV channel displacement continued to increase for another 100 ms, indicating that changes in active zone mobility persist for a short time after vesicle fusion. Before the test step, displacement averaged 0.28 ± 0.06 μm per 50 ms. By 50 ms after the step, the average displacement more than doubled to 0.74 ± 0.08 μm per 50 ms frame (15 trials in 8 cells, p < 0.001 vs baseline) (Fig. 9E).
Figure 9.

Vesicle fusion caused brief changes in CaV channel mobility and position. Cone photoreceptors with attached QDs were voltage-clamped and stimulated by application of a test step from −70 to −10 mV for 100 ms. A, Example illustrates that depolarizing stimulation evoked a noticeable increase in QD displacement. The corresponding trajectory map is shown in B. Point 1 shows the position just before stimulation. By 50 ms after the end of the test step (point 4), the CaV channel had moved to the edge of the confinement domain. C, Average displacement from 15 trials in 8 cones. Channel displacement increased ∼450 nm from baseline movements by 150 ms after the beginning of the voltage step (***p < 0.001 vs baseline). D, Distance of channels from the center point of the domain increased after stimulation. As described in Materials and Methods, the center point for each channel was calculated from Gaussian fits to the frequency histograms of positions occupied by the channel along the x- and y-axes. CaV channels moved significantly farther from the center of the trajectory plot by 150 ms after the beginning of stimulation (**p < 0.01).
Fusion typically caused CaV channels to move outward to more peripheral locations. For example, compare CaV channel positions before the step (point 1) to the position attained 50 ms after the end of the step (point 4) in the trajectory map of Figure 9B. To quantify these excursions, we measured the position of each channel relative to the center point of the domain before and after stimulation (see Materials and Methods). Channels had moved significantly further from the center by the end of the test pulse and moved still further away 50 ms later (p < 0.01) (Fig. 9D). They returned to more central positions by 100 ms after the end of the test pulse. Thus, vesicle fusion caused CaV channels to move toward the edge of the confinement domain, but they quickly returned toward the center.
Similar results were observed in rods (4 trials in 3 cells; data not shown), with a large poststimulation excursion observed 50 ms after the test pulse. However, it is difficult to compare QD movements of rods and cones directly for three reasons. First, the kinetics of exocytosis in rods appears to be slower than cones (Cadetti et al., 2005; Rabl et al., 2005), thus frame-by-frame changes in QD position may differ between the two cell types. Although the peak excursion was obtained 50 ms after stimulation in rods, displacement levels remained elevated for a longer period, consistent with the possibility that subsequent vesicle release may contribute to extended CaV channel excursions. Second, rods are electrically coupled by gap junctions (Attwell et al., 1985), which can influence the slow components of exocytosis (Armstrong-Gold and Rieke, 2003; Cadetti et al., 2005). Finally, previous work has shown that a 100 ms test pulse from −70 to −10 mV releases the entire RRP of ∼20 vesicles in cones (Bartoletti et al., 2010), but the RRP size has not been empirically quantified at rod synapses. Despite differences in the kinetics of rod and cone exocytosis, our findings suggest that CaV channels also exhibit a large change in position after vesicle release at rod synapses.
In tissue that was treated with scaffold-disrupting agents, we almost never observed detectable changes in CaV channel position following stimulation (2 of 49 trials in 10 photoreceptors treated with cytD or MβCD). Prior expansion of the confinement domain by actin disruption or cholesterol depletion may limit the impact of vesicle fusion on CaV channel mobility.
Discussion
Chemical synapses require Ca2+ influx through CaV channels to elicit synaptic release. The efficacy of release is influenced by the proximity between Ca2+ channels and synaptic vesicles, and changes in this spatial relationship can impact exocytosis (Augustine et al., 1991; Meinrenken et al., 2003; Schneggenburger and Neher, 2005). Accordingly, Ca2+ channels are clustered beneath the synaptic ribbons of photoreceptors very close to vesicle release sites along the ribbon flanks (Morgans, 2001; tom Dieck et al., 2005; Mercer et al., 2011). Our results show that, although they may be confined beneath the ribbon, CaV channels at the photoreceptor synapse remain mobile. Lateral movements of postsynaptic receptors have been identified as a mechanism for adjusting synaptic strength (Adesnik et al., 2005; Bannai et al., 2009). Consistent with the possibility that fusion of synaptic vesicles can disorganize the presynaptic release apparatus, we found that vesicle fusion produced detectable changes in the mobility of presynaptic CaV channels. However, the displacement jumps appear too small and brief to substantially impair subsequent synaptic release.
Mutations in the CaV subunit α2δ4 reduce electroretinogram B waves, produce disordered ribbons, and lead to rod–cone dystrophy, indicating its association with CaV channels in photoreceptors (Wycisk et al., 2006a,b). Consistent with these results, our immunohistochemical and RIBEYE imaging experiments show that the α2δ4 subunit of photoreceptor CaV channels colocalizes near the ribbon, synaptic vesicles, and CaV channel α1F subunits at rod and cone synapses (Morgans, 2001; Morgans et al., 2005; Steele et al., 2005; Specht et al., 2009). Electron micrographs show a random array of particles along the flanks of the synaptic ridge in primate photoreceptors that have been proposed to be CaV channels (Raviola and Gilula, 1975). We found that the size of the confinement area for CaV channel movements was similar to the area along the synaptic ridge beneath ribbons of rods and cones. The presence of a random arrangement of particles after fixation is consistent with freely mobile channels in living tissue. By contrast, CaV channels at the neuromuscular junction and calyceal synapses show a more orderly arrangement (Haydon et al., 1994; Harlow et al., 2001), suggesting that presynaptic CaV channels may not be equally mobile at every synapse.
Mobility measurements of CaV channels at the photoreceptor synapse indicate a diffusion coefficient of 0.17 μm2/s for the combined sample of rods and cones. Mobility of the QD conjugate is typically dominated by lateral membrane mobility of the channel since the viscosity of the membrane is 100–1000× higher than that of the surrounding fluid (Groc et al., 2007). It is possible that channel movements may be more restricted within the confines of the synaptic cleft (Groc et al., 2007). However, the kinetics of CaV channel movements was similar in retinal slices and dissociated photoreceptors, suggesting that the presence of postsynaptic contacts did not greatly alter mobility. Additionally, the diffusion coefficients found for CaV channels in the present study are within the range for diffusion coefficients of other synaptically located ion channels including presynaptic ether-à-go-go (EAG) channels (0.1–0.3 μm2/s) (Gómez-Varela et al., 2010), presynaptic CB1 cannabinoid receptors (0.1–0.2 μm2/s) (Mikasova et al., 2008), AMPA receptors (0.01–0.25 μm2/s) (Groc et al., 2008), GABAA receptors (1.2 μm2/s) (Bannai et al., 2009), and glycine receptors (0.001 μm2/s) (Dahan et al., 2003). The similarity to diffusion characteristics of EAG K+ channels may reflect similar macromolecular channel structures (Clapham, 1999; Catterall, 2000) and suggest that structural constraints may shape the properties of ion channel mobility.
In other systems, the cytoskeleton interacts with cholesterol-rich lipid rafts. Together, these structures can serve as discrete signaling platforms in a heterogeneous distribution throughout the plasma membrane (Churchward and Coorssen, 2009). Our results suggest that a similar organization of proteins and lipids at photoreceptor synapses may help to maintain CaV channel position. Cristofanilli et al. (2007) showed CaV channel turnover at retinal synapses as a consequence of actin disruption, and Renner et al. (2009) reported that cholesterol-enriched regions create obstacles in the plasma membrane that corral integral membrane proteins. Recently, it has also been shown that α7-nicotonic acetylcholine receptors are tethered in the postsynaptic membrane by cholesterol and actin filaments (Fernandes et al., 2010). Consistent with these observations, we found that disrupting actin with cytD or depleting membrane cholesterol with MβCD or COase significantly expanded confinement domains. MβCD has also been reported to disrupt actin in cultured fibroblast cells (Kwik et al., 2003). Perturbation of both actin and cholesterol may explain the larger effect of MβCD compared with COase or cytD.
Actin disruption can stimulate endocytosis of CaV1.3 channels (Cristofanilli et al., 2007) and diminish postsynaptic currents (PSCs) in second-order neurons by altering vesicle trafficking in the presynaptic terminal (Sakaba and Neher, 2003; Owe et al., 2009). Cholesterol depletion has also been shown to reduce ICa (Taverna et al., 2004) and blunt PSCs (Churchward et al., 2005; Zamir and Charlton, 2006; Linetti et al., 2010). We observed no significant changes in photoreceptor ICa following actin disruption or cholesterol depletion, but increased CaV channel mobility and a greater distance from exocytotic release sites might contribute to a reduction in PSCs.
The RRP of vesicles contacting the plasma membrane at the base of the synaptic ribbon flanks the domain occupied by CaV channels (Lasansky, 1973; Raviola and Gilula, 1975; tom Dieck et al., 2005). Capacitance measurements suggest that most or all of the vesicles released at the photoreceptor synapse exhibit full collapse fusion (Kreft et al., 2003; Thoreson et al., 2004; Li et al., 2009; Bartoletti et al., 2010). It is unlikely that addition of synaptic vesicle membrane significantly alters synaptic membrane fluidity since the lipid constituents of vesicles do not appear to differ appreciably from the plasma membrane lipid bilayer (Takamori et al., 2006). However, fusion of ∼20 vesicles in the RRP of cones (Bartoletti et al., 2010) would be predicted to increase membrane surface area by ∼0.5 μm2, and brief expansion of the local synaptic membrane might increase CaV channel movement. Consistent with this, we observed a detectable jump in CaV channel position following application of a depolarizing stimulus that releases the entire RRP.
Channel movements will smear out the nanodomain of high Ca2+ immediately beneath an open CaV channel. Photoreceptor CaV channels open for an average of 1.1 ms (Thoreson et al., 2000), and during this time a channel will move ∼11 nm (∼16 nm immediately after fusion of the RRP). Exocytosis involves CaV channel openings <100 nm from release sites (Bartoletti et al., 2010; Mercer et al., 2011). Thus, small channel movements may slightly alter the probability that Ca2+ reaches levels at a release site that are sufficiently high to stimulate fusion.
The present results are consistent with the idea that vesicle fusion can briefly alter the organization of presynaptic proteins involved in release. Following stimulation, CaV channels moved toward the edge of the confinement domain and then returned quickly to more central locations. Capacitance measurements at cone synapses indicate that ∼50% of the exocytosed membrane is endocytosed within 350 ms (Rabl et al., 2005). Thus, recovery toward more central locations within 200 ms may be at least partly due to endocytotic retrieval of membrane. Brief outward excursions during stimulation would tend to push channels closer to vesicle docking sites located on the flanks of the synaptic ridge and could thus potentially enhance subsequent release. However, ribbon release sites require ∼250 ms to be primed for release of another vesicle (Zenisek et al., 2000), and channels returned to more central positions within ∼200 ms. This suggests that the impact of fusion-induced CaV channel movements on subsequent exocytosis may be small, although it does not rule out the possibility that disorganization of other proteins might contribute to postsynaptic depression (Neher and Sakaba, 2008; Hosoi et al., 2009). A more sustained expansion of the confinement area is likely to have a greater impact by lengthening the time that CaV channels spend away from release sites. Our results indicate that a sustained expansion of the confinement area can occur after disruption of scaffold molecules. A more modest expansion might also accompany the continuous release of vesicles that occurs when cones are maintained in a depolarized state in darkness, suggesting possible plasticity in the spatial relationships among proteins during changing levels of illumination. Mutations in CaV1.4 subunits cause retinopathies such as congenital stationary night blindness (Morgans et al., 2005; Gu et al., 2008) and rod-cone dystrophy (Wycisk et al., 2006a,b). Many of these mutations alter Ca2+ channel gating properties, but the present results raise the possibility that mutations that alter channel mobility might also cause disturbances in retinal neurotransmission.
Footnotes
This research was supported by Research to Prevent Blindness, National Institutes of Health Grants EY10542 (W.B.T.), EY10542-14S1 (W.B.T.), and a University of Nebraska Medical Center (UNMC) Graduate Student Fellowship (A.J.M.). We thank Dr. Ning Qin (Johnson & Johnson) for the anti-α2δ4 antibody, Dr. Catherine Morgans (Oregon Health & Science University, Portland, OR) for the anti-α1F antibody, and Dr. David Zenisek (Yale University, New Haven, CT) for providing the HyLite-488 ribeye-binding peptide. Yang Yuan, Fariha Ahmed, Brenda Morsey, and Benjamin Lamberty (UNMC) assisted with immunohistochemistry and Western blots. Dr. Jessica Mercer (UNMC) provided excellent editorial assistance. Dr. John Hanrahan (McGill University, Montreal, Quebec, Canada) and Dr. David Levitt (University of Minnesota, St. Paul, MN) provided critical feedback.
References
- Adesnik H, Nicoll RA, England PM. Photoinactivation of native AMPA receptors reveals their real-time trafficking. Neuron. 2005;48:977–985. doi: 10.1016/j.neuron.2005.11.030. [DOI] [PubMed] [Google Scholar]
- Alcor D, Gouzer G, Triller A. Single-particle tracking methods for the study of membrane receptors dynamics. Eur J Neurosci. 2009;30:987–997. doi: 10.1111/j.1460-9568.2009.06927.x. [DOI] [PubMed] [Google Scholar]
- Andrade A, Sandoval A, Oviedo N, De Waard M, Elias D, Felix R. Proteolytic cleavage of the voltage-gated Ca2+ channel alpha2delta subunit: structural and functional features. Eur J Neurosci. 2007;25:1705–1710. doi: 10.1111/j.1460-9568.2007.05454.x. [DOI] [PMC free article] [PubMed] [Google Scholar]
- Armstrong-Gold CE, Rieke F. Bandpass filtering at the rod to second-order cell synapse in salamander (Ambystoma tigrinum) retina. J Neurosci. 2003;23:3796–3806. doi: 10.1523/JNEUROSCI.23-09-03796.2003. [DOI] [PMC free article] [PubMed] [Google Scholar]
- Attwell D, Wilson M, Wu SM. The effect of light on the spread of signals through the rod network of the salamander retina. Brain Res. 1985;343:79–88. doi: 10.1016/0006-8993(85)91160-6. [DOI] [PubMed] [Google Scholar]
- Augustine GJ, Adler EM, Charlton MP. The calcium signal for transmitter secretion from presynaptic nerve terminals. Ann NY Acad Sci. 1991;635:365–381. doi: 10.1111/j.1749-6632.1991.tb36505.x. [DOI] [PubMed] [Google Scholar]
- Bannai H, Lévi S, Schweizer C, Dahan M, Triller A. Imaging the lateral diffusion of membrane molecules with quantum dots. Nat Protoc. 2006;1:2628–2634. doi: 10.1038/nprot.2006.429. [DOI] [PubMed] [Google Scholar]
- Bannai H, Lévi S, Schweizer C, Inoue T, Launey T, Racine V, Sibarita JB, Mikoshiba K, Triller A. Activity-dependent tuning of inhibitory neurotransmission based on GABAAR diffusion dynamics. Neuron. 2009;62:670–682. doi: 10.1016/j.neuron.2009.04.023. [DOI] [PubMed] [Google Scholar]
- Bartoletti TM, Babai N, Thoreson WB. Vesicle pool size at the salamander cone ribbon synapse. J Neurophysiol. 2010;103:419–423. doi: 10.1152/jn.00718.2009. [DOI] [PMC free article] [PubMed] [Google Scholar]
- Bates IR, Hébert B, Luo Y, Liao J, Bachir AI, Kolin DL, Wiseman PW, Hanrahan JW. Membrane lateral diffusion and capture of CFTR within transient confinement zones. Biophys J. 2006;91:1046–1058. doi: 10.1529/biophysj.106.084830. [DOI] [PMC free article] [PubMed] [Google Scholar]
- Beaumont V, Llobet A, Lagnado L. Expansion of calcium microdomains regulates fast exocytosis at a ribbon synapse. Proc Natl Acad Sci U S A. 2005;102:10700–10705. doi: 10.1073/pnas.0501961102. [DOI] [PMC free article] [PubMed] [Google Scholar]
- Bucurenciu I, Kulik A, Schwaller B, Frotscher M, Jonas P. Nanodomain coupling between Ca2+ channels and Ca2+ sensors promotes fast and efficient transmitter release at a cortical GABAergic synapse. Neuron. 2008;57:536–545. doi: 10.1016/j.neuron.2007.12.026. [DOI] [PubMed] [Google Scholar]
- Cadetti L, Tranchina D, Thoreson WB. A comparison of release kinetics and glutamate receptor properties in shaping rod-cone differences in EPSC kinetics in the salamander retina. J Physiol. 2005;569:773–788. doi: 10.1113/jphysiol.2005.096545. [DOI] [PMC free article] [PubMed] [Google Scholar]
- Catterall WA. Structure and regulation of voltage-gated Ca2+ channels. Annu Rev Cell Dev Biol. 2000;16:521–555. doi: 10.1146/annurev.cellbio.16.1.521. [DOI] [PubMed] [Google Scholar]
- Churchward MA, Coorssen JR. Cholesterol, regulated exocytosis and the physiological fusion machine. Biochem J. 2009;423:1–14. doi: 10.1042/BJ20090969. [DOI] [PubMed] [Google Scholar]
- Churchward MA, Rogasevskaia T, Höfgen J, Bau J, Coorssen JR. Cholesterol facilitates the native mechanism of Ca2+-triggered membrane fusion. J Cell Sci. 2005;118:4833–4848. doi: 10.1242/jcs.02601. [DOI] [PubMed] [Google Scholar]
- Clapham DE. Unlocking family secrets: K+ channel transmembrane domains. Cell. 1999;97:547–550. doi: 10.1016/s0092-8674(00)80765-5. [DOI] [PubMed] [Google Scholar]
- Cooper NG, McLaughlin BJ. The distribution of filipin-sterol complexes in photoreceptor synaptic membranes. J Comp Neurol. 1984;230:437–443. doi: 10.1002/cne.902300311. [DOI] [PubMed] [Google Scholar]
- Courty S, Bouzigues C, Luccardini C, Ehrensperger MV, Bonneau S, Dahan M. Tracking individual proteins in living cells using single quantum dot imaging. Methods Enzymol. 2006;414:211–228. doi: 10.1016/S0076-6879(06)14012-4. [DOI] [PubMed] [Google Scholar]
- Cristofanilli M, Mizuno F, Akopian A. Disruption of actin cytoskeleton causes internalization of Ca(v)1.3 (alpha 1D) L-type calcium channels in salamander retinal neurons. Mol Vis. 2007;13:1496–1507. [PubMed] [Google Scholar]
- Dahan M, Lévi S, Luccardini C, Rostaing P, Riveau B, Triller A. Diffusion dynamics of glycine receptors revealed by single-quantum dot tracking. Science. 2003;302:442–445. doi: 10.1126/science.1088525. [DOI] [PubMed] [Google Scholar]
- Davies A, Douglas L, Hendrich J, Wratten J, Tran Van Minh A, Foucault I, Koch D, Pratt WS, Saibil HR, Dolphin AC. The calcium channel α2δ2 subunit partitions with CaV2.1 into lipid rafts in cerebellum: implications for localization and function. J Neurosci. 2006;26:8748–8757. doi: 10.1523/JNEUROSCI.2764-06.2006. [DOI] [PMC free article] [PubMed] [Google Scholar]
- Diamandis EP, Christopoulos TK. The biotin-(strept)avidin system: principles and applications in biotechnology. Clin Chem. 1991;37:625–636. [PubMed] [Google Scholar]
- Dick O, tom Dieck S, Altrock WD, Ammermüller J, Weiler R, Garner CC, Gundelfinger ED, Brandstätter JH. The presynaptic active zone protein bassoon is essential for photoreceptor ribbon synapse formation in the retina. Neuron. 2003;37:775–786. doi: 10.1016/s0896-6273(03)00086-2. [DOI] [PubMed] [Google Scholar]
- Fernandes CC, Berg DK, Gómez-Varela D. Lateral mobility of nicotinic acetylcholine receptors on neurons is determined by receptor composition, local domain, and cell type. J Neurosci. 2010;30:8841–8851. doi: 10.1523/JNEUROSCI.6236-09.2010. [DOI] [PMC free article] [PubMed] [Google Scholar]
- Gómez-Varela D, Kohl T, Schmidt M, Rubio ME, Kawabe H, Nehring RB, Schäfer S, Stühmer W, Pardo LA. Characterization of Eag1 channel lateral mobility in rat hippocampal cultures by single-particle-tracking with quantum dots. PLoS One. 2010;5:e8858. doi: 10.1371/journal.pone.0008858. [DOI] [PMC free article] [PubMed] [Google Scholar]
- Groc L, Lafourcade M, Heine M, Renner M, Racine V, Sibarita JB, Lounis B, Choquet D, Cognet L. Surface trafficking of neurotransmitter receptor: comparison between single-molecule/quantum dot strategies. J Neurosci. 2007;27:12433–12437. doi: 10.1523/JNEUROSCI.3349-07.2007. [DOI] [PMC free article] [PubMed] [Google Scholar]
- Groc L, Choquet D, Chaouloff F. The stress hormone corticosterone conditions AMPAR surface trafficking and synaptic potentiation. Nat Neurosci. 2008;11:868–870. doi: 10.1038/nn.2150. [DOI] [PubMed] [Google Scholar]
- Gu Y, Wang L, Zhou J, Guo Q, Liu N, Ding Z, Li L, Liu X, An J, Yan G, Yao L, Zhang Z. A naturally-occurring mutation in Cacna1f in a rat model of congenital stationary night blindness. Mol Vis. 2008;14:20–28. [PMC free article] [PubMed] [Google Scholar]
- Hall D. Analysis and interpretation of two-dimensional single-particle tracking microscopy measurements: effect of local surface roughness. Anal Biochem. 2008;377:24–32. doi: 10.1016/j.ab.2008.02.019. [DOI] [PubMed] [Google Scholar]
- Harlow ML, Ress D, Stoschek A, Marshall RM, McMahan UJ. The architecture of active zone material at the frog's neuromuscular junction. Nature. 2001;409:479–484. doi: 10.1038/35054000. [DOI] [PubMed] [Google Scholar]
- Haydon PG, Henderson E, Stanley EF. Localization of individual calcium channels at the release face of a presynaptic nerve terminal. Neuron. 1994;13:1275–1280. doi: 10.1016/0896-6273(94)90414-6. [DOI] [PubMed] [Google Scholar]
- Heidelberger R, Thoreson WB, Witkovsky P. Synaptic transmission at retinal ribbon synapses. Prog Retin Eye Res. 2005;24:682–720. doi: 10.1016/j.preteyeres.2005.04.002. [DOI] [PMC free article] [PubMed] [Google Scholar]
- Hosoi N, Holt M, Sakaba T. Calcium dependence of exo- and endocytotic coupling at a glutamatergic synapse. Neuron. 2009;63:216–229. doi: 10.1016/j.neuron.2009.06.010. [DOI] [PubMed] [Google Scholar]
- Jackman SL, Choi SY, Thoreson WB, Rabl K, Bartoletti TM, Kramer RH. Role of the synaptic ribbon in transmitting the cone light response. Nat Neurosci. 2009;12:303–310. doi: 10.1038/nn.2267. [DOI] [PMC free article] [PubMed] [Google Scholar]
- Jarsky T, Tian M, Singer JH. Nanodomain control of exocytosis is responsible for the signaling capability of a retinal ribbon synapse. J Neurosci. 2010;30:11885–11895. doi: 10.1523/JNEUROSCI.1415-10.2010. [DOI] [PMC free article] [PubMed] [Google Scholar]
- Jin S, Haggie PM, Verkman AS. Single-particle tracking of membrane protein diffusion in a potential: simulation, detection, and application to confined diffusion of CFTR Cl- channels. Biophys J. 2007;93:1079–1088. doi: 10.1529/biophysj.106.102244. [DOI] [PMC free article] [PubMed] [Google Scholar]
- Kreft M, Krizaj D, Grilc S, Zorec R. Properties of exocytotic response in vertebrate photoreceptors. J Neurophysiol. 2003;90:218–225. doi: 10.1152/jn.01025.2002. [DOI] [PMC free article] [PubMed] [Google Scholar]
- Kunz WS, Kunz W. Contribution of different enzymes to flavoprotein fluorescence of isolated rat liver mitochondria. Biochim Biophys Acta. 1985;841:237–246. doi: 10.1016/0304-4165(85)90064-9. [DOI] [PubMed] [Google Scholar]
- Kwik J, Boyle S, Fooksman D, Margolis L, Sheetz MP, Edidin M. Membrane cholesterol, lateral mobility, and the phosphatidylinositol 4,5-bisphosphate-dependent organization of cell actin. Proc Natl Acad Sci U S A. 2003;100:13964–13969. doi: 10.1073/pnas.2336102100. [DOI] [PMC free article] [PubMed] [Google Scholar]
- Lasansky A. Organization of the outer synaptic layer in the retina of the larval tiger salamander. Philos Trans R Soc Lond B Biol Sci. 1973;265:471–489. doi: 10.1098/rstb.1973.0033. [DOI] [PubMed] [Google Scholar]
- Li GL, Keen E, Andor-Ardó D, Hudspeth AJ, von Gersdorff H. The unitary event underlying multiquantal EPSCs at a hair cell's ribbon synapse. J Neurosci. 2009;29:7558–7568. doi: 10.1523/JNEUROSCI.0514-09.2009. [DOI] [PMC free article] [PubMed] [Google Scholar]
- Linetti A, Fratangeli A, Taverna E, Valnegri P, Francolini M, Cappello V, Matteoli M, Passafaro M, Rosa P. Cholesterol reduction impairs exocytosis of synaptic vesicles. J Cell Sci. 2010;123:595–605. doi: 10.1242/jcs.060681. [DOI] [PubMed] [Google Scholar]
- Mansergh F, Orton NC, Vessey JP, Lalonde MR, Stell WK, Tremblay F, Barnes S, Rancourt DE, Bech-Hansen NT. Mutation of the calcium channel gene Cacna1f disrupts calcium signaling, synaptic transmission and cellular organization in mouse retina. Hum Mol Genet. 2005;14:3035–3046. doi: 10.1093/hmg/ddi336. [DOI] [PubMed] [Google Scholar]
- McRory JE, Hamid J, Doering CJ, Garcia E, Parker R, Hamming K, Chen L, Hildebrand M, Beedle AM, Feldcamp L, Zamponi GW, Snutch TP. The CACNA1F gene encodes an L-type calcium channel with unique biophysical properties and tissue distribution. J Neurosci. 2004;24:1707–1718. doi: 10.1523/JNEUROSCI.4846-03.2004. [DOI] [PMC free article] [PubMed] [Google Scholar]
- Meinrenken CJ, Borst JG, Sakmann B. Local routes revisited: the space and time dependence of the Ca2+ signal for phasic transmitter release at the rat calyx of Held. J Physiol. 2003;547:665–689. doi: 10.1113/jphysiol.2002.032714. [DOI] [PMC free article] [PubMed] [Google Scholar]
- Mercer AJ, Rabl K, Riccardi GE, Brecha NC, Stella SL, Jr, Thoreson WB. Location of release sites and calcium-activated chloride channels relative to calcium channels at the photoreceptor ribbon synapse. J Neurophysiol. 2011;105:321–335. doi: 10.1152/jn.00332.2010. [DOI] [PMC free article] [PubMed] [Google Scholar]
- Mikasova L, Groc L, Choquet D, Manzoni OJ. Altered surface trafficking of presynaptic cannabinoid type 1 receptor in and out synaptic terminals parallels receptor desensitization. Proc Natl Acad Sci U S A. 2008;105:18596–18601. doi: 10.1073/pnas.0805959105. [DOI] [PMC free article] [PubMed] [Google Scholar]
- Morgans CW. Localization of the alpha(1F) calcium channel subunit in the rat retina. Invest Ophthalmol Vis Sci. 2001;42:2414–2418. [PubMed] [Google Scholar]
- Morgans CW, Gaughwin P, Maleszka R. Expression of the alpha1F calcium channel subunit by photoreceptors in the rat retina. Mol Vis. 2001;7:202–209. [PubMed] [Google Scholar]
- Morgans CW, Bayley PR, Oesch NW, Ren G, Akileswaran L, Taylor WR. Photoreceptor calcium channels: insight from night blindness. Vis Neurosci. 2005;22:561–568. doi: 10.1017/S0952523805225038. [DOI] [PubMed] [Google Scholar]
- Neher E. Vesicle pools and Ca2+ microdomains: new tools for understanding their roles in neurotransmitter release. Neuron. 1998;20:389–399. doi: 10.1016/s0896-6273(00)80983-6. [DOI] [PubMed] [Google Scholar]
- Neher E, Sakaba T. Multiple roles of calcium ions in the regulation of neurotransmitter release. Neuron. 2008;59:861–872. doi: 10.1016/j.neuron.2008.08.019. [DOI] [PubMed] [Google Scholar]
- Owe SG, Jensen V, Evergren E, Ruiz A, Shupliakov O, Kullmann DM, Storm-Mathisen J, Walaas SI, Hvalby Ø, Bergersen LH. Synapsin- and actin-dependent frequency enhancement in mouse hippocampal mossy fiber synapses. Cereb Cortex. 2009;19:511–523. doi: 10.1093/cercor/bhn101. [DOI] [PMC free article] [PubMed] [Google Scholar]
- Pang JJ, Gao F, Barrow A, Jacoby RA, Wu SM. How do tonic glutamatergic synapses evade receptor desensitization? J Physiol. 2008;586:2889–2902. doi: 10.1113/jphysiol.2008.151050. [DOI] [PMC free article] [PubMed] [Google Scholar]
- Qin N, Yagel S, Momplaisir ML, Codd EE, D'Andrea MR. Molecular cloning and characterization of the human voltage-gated calcium channel alpha(2)delta-4 subunit. Mol Pharmacol. 2002;62:485–496. doi: 10.1124/mol.62.3.485. [DOI] [PubMed] [Google Scholar]
- Rabl K, Cadetti L, Thoreson WB. Kinetics of exocytosis is faster in cones than in rods. J Neurosci. 2005;25:4633–4640. doi: 10.1523/JNEUROSCI.4298-04.2005. [DOI] [PMC free article] [PubMed] [Google Scholar]
- Raviola E, Gilula NB. Intramembrane organization of specialized contacts in the outer plexiform layer of the retina. A freeze-fracture study in monkeys and rabbits. J Cell Biol. 1975;65:192–222. doi: 10.1083/jcb.65.1.192. [DOI] [PMC free article] [PubMed] [Google Scholar]
- Renner M, Choquet D, Triller A. Control of the postsynaptic membrane viscosity. J Neurosci. 2009;29:2926–2937. doi: 10.1523/JNEUROSCI.4445-08.2009. [DOI] [PMC free article] [PubMed] [Google Scholar]
- Sakaba T, Neher E. Involvement of actin polymerization in vesicle recruitment at the calyx of Held synapse. J Neurosci. 2003;23:837–846. doi: 10.1523/JNEUROSCI.23-03-00837.2003. [DOI] [PMC free article] [PubMed] [Google Scholar]
- Saxton MJ. Single-particle tracking: the distribution of diffusion coefficients. Biophys J. 1997;72:1744–1753. doi: 10.1016/S0006-3495(97)78820-9. [DOI] [PMC free article] [PubMed] [Google Scholar]
- Saxton MJ, Jacobson K. Single-particle tracking: applications to membrane dynamics. Annu Rev Biophys Biomol Struct. 1997;26:373–399. doi: 10.1146/annurev.biophys.26.1.373. [DOI] [PubMed] [Google Scholar]
- Schneggenburger R, Neher E. Presynaptic calcium and control of vesicle fusion. Curr Opin Neurobiol. 2005;15:266–274. doi: 10.1016/j.conb.2005.05.006. [DOI] [PubMed] [Google Scholar]
- Specht D, Wu SB, Turner P, Dearden P, Koentgen F, Wolfrum U, Maw M, Brandstätter JH, tom Dieck S. Effects of presynaptic mutations on a postsynaptic Cacna1s calcium channel colocalized with mGluR6 at mouse photoreceptor ribbon synapses. Invest Ophthalmol Vis Sci. 2009;50:505–515. doi: 10.1167/iovs.08-2758. [DOI] [PubMed] [Google Scholar]
- Steele EC, Jr, Chen X, Iuvone PM, MacLeish PR. Imaging of Ca2+ dynamics within the presynaptic terminals of salamander rod photoreceptors. J Neurophysiol. 2005;94:4544–4553. doi: 10.1152/jn.01193.2004. [DOI] [PubMed] [Google Scholar]
- Takamori S, Holt M, Stenius K, Lemke EA, Grønborg M, Riedel D, Urlaub H, Schenck S, Brügger B, Ringler P, Müller SA, Rammner B, Gräter F, Hub JS, De Groot BL, Mieskes G, Moriyama Y, Klingauf J, Grubmüller H, Heuser J, Wieland F, Jahn R. Molecular anatomy of a trafficking organelle. Cell. 2006;127:831–846. doi: 10.1016/j.cell.2006.10.030. [DOI] [PubMed] [Google Scholar]
- Taverna E, Saba E, Rowe J, Francolini M, Clementi F, Rosa P. Role of lipid microdomains in P/Q-type calcium channel (Cav2.1) clustering and function in presynaptic membranes. J Biol Chem. 2004;279:5127–5134. doi: 10.1074/jbc.M308798200. [DOI] [PubMed] [Google Scholar]
- Thoreson WB, Witkovsky P. Glutamate receptors and circuits in the vertebrate retina. Prog Retin Eye Res. 1999;18:765–810. doi: 10.1016/s1350-9462(98)00031-7. [DOI] [PubMed] [Google Scholar]
- Thoreson WB, Nitzan R, Miller RF. Chloride efflux inhibits single calcium channel open probability in vertebrate photoreceptors: chloride imaging and cell-attached patch-clamp recordings. Vis Neurosci. 2000;17:197–206. doi: 10.1017/s0952523800172025. [DOI] [PubMed] [Google Scholar]
- Thoreson WB, Rabl K, Townes-Anderson E, Heidelberger R. A highly Ca2+-sensitive pool of vesicles contributes to linearity at the rod photoreceptor ribbon synapse. Neuron. 2004;42:595–605. doi: 10.1016/s0896-6273(04)00254-5. [DOI] [PMC free article] [PubMed] [Google Scholar]
- tom Dieck S, Altrock WD, Kessels MM, Qualmann B, Regus H, Brauner D, Fejtová A, Bracko O, Gundelfinger ED, Brandstätter JH. Molecular dissection of the photoreceptor ribbon synapse: physical interaction of Bassoon and RIBEYE is essential for the assembly of the ribbon complex. J Cell Biol. 2005;168:825–836. doi: 10.1083/jcb.200408157. [DOI] [PMC free article] [PubMed] [Google Scholar]
- Townes-Anderson E, MacLeish PR, Raviola E. Rod cells dissociated from mature salamander retina: ultrastructure and uptake of horseradish peroxidase. J Cell Biol. 1985;100:175–188. doi: 10.1083/jcb.100.1.175. [DOI] [PMC free article] [PubMed] [Google Scholar]
- Wang MM, Janz R, Belizaire R, Frishman LJ, Sherry DM. Differential distribution and developmental expression of synaptic vesicle protein 2 isoforms in the mouse retina. J Comp Neurol. 2003;460:106–122. doi: 10.1002/cne.10636. [DOI] [PubMed] [Google Scholar]
- Wu J, Marmorstein AD, Striessnig J, Peachey NS. Voltage-dependent calcium channel CaV1.3 subunits regulate the light peak of the electroretinogram. J Neurophysiol. 2007;97:3731–3735. doi: 10.1152/jn.00146.2007. [DOI] [PMC free article] [PubMed] [Google Scholar]
- Wycisk KA, Budde B, Feil S, Skosyrski S, Buzzi F, Neidhardt J, Glaus E, Nürnberg P, Ruether K, Berger W. Structural and functional abnormalities of retinal ribbon synapses due to Cacna2d4 mutation. Invest Ophthalmol Vis Sci. 2006a;47:3523–3530. doi: 10.1167/iovs.06-0271. [DOI] [PubMed] [Google Scholar]
- Wycisk KA, Zeitz C, Feil S, Wittmer M, Forster U, Neidhardt J, Wissinger B, Zrenner E, Wilke R, Kohl S, Berger W. Mutation in the auxiliary calcium-channel subunit CACNA2D4 causes autosomal recessive cone dystrophy. Am J Hum Genet. 2006b;79:973–977. doi: 10.1086/508944. [DOI] [PMC free article] [PubMed] [Google Scholar]
- Zamir O, Charlton MP. Cholesterol and synaptic transmitter release at crayfish neuromuscular junctions. J Physiol. 2006;571:83–99. doi: 10.1113/jphysiol.2005.098319. [DOI] [PMC free article] [PubMed] [Google Scholar]
- Zenisek D. Vesicle association and exocytosis at ribbon and extraribbon sites in retinal bipolar cell presynaptic terminals. Proc Natl Acad Sci U S A. 2008;105:4922–4927. doi: 10.1073/pnas.0709067105. [DOI] [PMC free article] [PubMed] [Google Scholar]
- Zenisek D, Steyer JA, Almers W. Transport, capture and exocytosis of single synaptic vesicles at active zones. Nature. 2000;406:849–854. doi: 10.1038/35022500. [DOI] [PubMed] [Google Scholar]
- Zenisek D, Davila V, Wan L, Almers W. Imaging calcium entry sites and ribbon structures in two presynaptic cells. J Neurosci. 2003;23:2538–2548. doi: 10.1523/JNEUROSCI.23-07-02538.2003. [DOI] [PMC free article] [PubMed] [Google Scholar]
- Zenisek D, Horst NK, Merrifield C, Sterling P, Matthews G. Visualizing synaptic ribbons in the living cell. J Neurosci. 2004;24:9752–9759. doi: 10.1523/JNEUROSCI.2886-04.2004. [DOI] [PMC free article] [PubMed] [Google Scholar]