

SUMMARY
Understanding the genetic contributions to complex diseases will require consideration of interaction across multiple genes and environmental factors. At the same time, capturing information on allelic phase, that is, whether alleles within a gene are in cis (on the same chromosome) or in trans (on different chromosomes), is critical when using haplotypic approaches in disease association studies. This paper proposes a combination of mixed modeling and multiple imputation for assessing high-order genotype–phenotype associations while accounting for the uncertainty in phase inherent in population-based association studies. This method provides a flexible statistical framework for controlling for potential confounders and assessing gene–environment and gene–gene interactions in studies of unrelated individuals where the haplotypic phase is generally unobservable. The proposed method is applied to a cohort of 626 subjects with human immunodeficiency virus (HIV) to assess the potential contribution of four genes, apolipoprotein-C-III, apolipoprotein-E, endothelial lipase and hepatic lipase in predicting lipid abnormalities. A simulation study is also presented to describe the method performance.
Keywords: haplotype, mixed models, multiple imputation, human immunodeficiency virus-1 (HIV-1), antiretroviral therapy (ART), dyslipidemia
1. INTRODUCTION
The explosion of molecular-level information, including the recent release of data from the HapMap project [1], coupled with large epidemiological studies, presents an exciting opportunity to uncover the genetic underpinnings of complex diseases; however, several analytical challenges remain to be addressed in order to take advantage of these rich repositories of information. Understanding the genetic contributions to complex diseases will inevitably require consideration of synergistic effects across multiple genetic loci and environmental and demographic factors. In addition, it will be critical to capture information on allelic phase, that is, whether alleles within a gene are in cis (on the same chromosome) or in trans (on different chromosomes) [2]. Haplotype-based analysis is particularly relevant for two reasons. First, combinations of genotypic variation on the same chromosomal copy (in cis) may act together to affect transcription or translation, and thus disease traits, in a manner different from that when the same genotypic variations are on opposite chromosomal copies (in trans). Second, if the alleles under investigation are putative markers for the disease-causing variant, that is, they are in linkage disequilibrium (LD) with the disease variant but are not causal, then knowledge of phase permits the use of allelic variants to identify disease associations indirectly. This phenomenon of LD is commonly observed in haplotype blocks with limited recombination over time.
In association studies of unrelated individuals, the allelic phase is generally unobservable, but a corresponding probability distribution can be estimated. An emerging body of literature describes such estimation procedures, including expectation maximization (EM)-type methods [3–7], Markov chain Monte Carlo (MCMC) approaches [8], and hidden Markov modeling [9]. One common approach to analyzing the relationships between haplotypes and a phenotype is to assume an individual’s haplotype to be the one with the highest estimated posterior probability. While this approach can be informative, disregarding uncertainty in phase can potentially bias results towards those with complete information and may lead to underestimation of variance parameters [10–12]. More sophisticated methods that iterate between haplotype estimation and inference on phenotypes have also been described [5, 7, 13], although these are limited to consideration of single genes.
In addition to the challenges inherent in the unobservable nature of haplotype data, the high-dimensional component of genetic information creates a further analytical obstacle. Combining single nucleotide polymorphism (SNP) data across a large number of loci within and across genes to characterize genotype–phenotype associations is especially challenging due to the complex, uncharacterized relationships among them. Several groups have proposed methods for considering multi-locus effects on complex traits in studies of unrelated individuals [14–22]. For example, the approach of Schaid et al. [21] invokes a single-degree-of-freedom test based on a non-parametric U-statistic. This method was developed for case–control data and has not, to our knowledge, been extended to the analysis of unobservable phase haplotype data. Each method offers insight into the underlying mechanisms that relate high-dimensional SNP data to measures of disease. Such approaches may also require assumptions about the nature of associations at both the allelic level (e.g. dominant or recessive effects within an SNP) and across loci (e.g. additive or multiplicative effects across SNPs). We return to the types of models and underlying assumptions in Section 2.
Finally, methods that simultaneously address uncertainty in haplotype and multiplicity have also been described. These include the method of Becker et al. [23] that uses an EM algorithm coupled with the minP procedure to test a global null of no haplotype associations with a disease trait. The uncertainty introduced by the estimation of haplotype prevalences is accounted for using a Monte Carlo simulation. Notably, this approach is both powerful and computationally efficient and can be applied to multiple markers within and across genes. The approach we propose in this article similarly tests a global null, specifically whether there is variability across haplotype effects within or across genes. Our approach differs, however, as it is applicable to continuous traits (phenotypes), whereas the approach of Becker et al. was developed for the analysis of case–control data. In addition, our approach allows for covariate adjustment, thus providing a natural framework for handling potential confounders.
Among the methods for identifying high-order associations is a mixed modeling approach that allows for characterizing high-order gene–gene interactions, while providing a flexible statistical framework to account for the confounding and mediating role of person-specific covariates [22]. In this paper, we extend the mixed modeling approach to incorporate the potential ambiguity in allelic phase that is relevant in the context of studying multiple SNPs that are in LD, as is usually the case, although to varying degrees, for SNPs within the same gene. Specifically, we propose a combination of multiple imputation [24, p. 85] and mixed modeling [25] that provides a natural framework for assessment of haplotype effects across multiple genes. Multiple imputation is a technique that is commonly used in the context of non-response in sample surveys [11, 24]. Its generalizability and flexibility render it applicable to a broad range of statistical and substantive problems ranging from measurement error [12] to confidentiality and national health surveys. Specifically, this approach is appropriate for contemporary haplotype-based and genome-wide approaches to disease association.
We apply our approach to a cohort of N = 626 individuals infected with human immunodefi-ciency virus-1 (HIV-1) and consider whether combinations of genetic polymorphisms contribute to antiretroviral therapy (ART)-associated dyslipidemia in this population. Dyslipidemia has been associated with specific agents within each class of antiretrovirals, although protease inhibitors (PIs) are the class most consistently associated with the greatest lipid abnormalities [26–30]. The most common lipid abnormality associated with ART is an increase in triglyceride-and apoB-containing lipoproteins, but reduction in HDL cholesterol (HDL-C) levels, a major risk for cardiovascular disease (CVD), is also quite marked. Preliminary studies suggest that lipoprotein abnormalities are likely to result in substantially increased-risk CVD events, particularly as it is likely that life-long ART may be required to maintain control of viral replication [26, 31, 32]. Therefore, it is of considerable importance to develop strategies for identification of HIV-1-infected subjects who are at increased risk of ART-related dyslipidemia in order to facilitate rational decision making when selecting ART regimens and early use of appropriate preventive CV therapies in those at greatest risk. As a hypothesis-driven example, the current investigation aims at characterizing the genetic contribution of four candidate genes, apolipoprotein-C-III (ApoCIII), apolipoprotein-E (ApoE), endothelial lipase (EL) and hepatic lipase (HL), to variability in HDL-C in this sample.
We begin in Section 2 by describing the mixed-effects model for haplotype association data, with particular consideration of how alternative formulations of the mixed model can accommodate varying underlying genetic models and models of association. Since haplotype data are not observed consistently, we then describe a multiple imputation approach to filling in these ‘missing data.’ The testing procedure we propose is similar to the approach in [22], with additional consideration to combining test statistics across multiply imputed data sets. An illustration of the mixed modeling approach for both genotype and haplotype data is provided in Section 3.1. Finally, simulation results are presented in Section 3.2 in order to illustrate the features of this approach for detecting true, underlying associations.
2. METHODS
In the analysis of genetic associations with disease in the general population, consideration needs to be given to specification of several models. We distinguish among three types of models: (1) the genetic model for locus (haplotype or single SNP) effects, (2) the model for multi-locus association and (3) the population genetic model (often called the coalescence process). The genetic model refers to how two genotype or haplotype copies (one on each chromosome) act in concert. Commonly described genetic models include additive, recessive, or dominant. For the simple case of a single SNP, suppose the possible genotypes are AA, Aa, and aa. If the effects on phenotype of carrying A or a are denoted e(A) and e(a), respectively, then the additive model assumes that the effect of AA is e(AA) = 2 * e(A), while the effect of the Aa genotype is e(Aa) = e(A) + e(a). A dominant model, on the other hand, assumes that the effect of Aa is the same as that of AA, while a recessive model assumes that an effect is observed only in the presence of two a alleles.
Additionally, what we term the model for multi-locus association relates to how multiple SNPs or genes interact with one another in explaining the variability in phenotype, regardless of the placement of alleles on chromosomes. Models for association are typically additive or multiplicative, although alternative formulations have also been described. For example, now suppose we observe AA, Aa, or aa at one position and BB, Bb, or bb at another position. An additive model for association assumes that the phenotypic effect of presenting the AA and BB genotypes is the sum of e(AA) and e(BB), while a multiplicative model for association would assume that this is given by the product of e(AA) and e(BB).
Finally, the population genetic model refers to the process by which SNPs are inherited in combination over generations. Measures of LD between two SNPs are highly dependent on the coalescence model assumption [33–40]. While there remains considerable uncertainty as to which population genetic models are most appropriate, a neutral coalescent infinite-many-site model with recombination has been used commonly [34, 35] because of its ability to capture efficiently the complicated genealogic dependence structure. Relevant software can be found at http://home.uchicago.edu/rhudson1/source/mksamples.html. Notably, this model assumes constant population size and does not account for variation in regional rates of recombination and mutation as well as the occurrence of gene conversions and multiple mutations as has been observed in actual human genetic data [41–47]. The population genetic model is particularly relevant in the context of estimating posterior haplotype probabilities, which our approach requires to impute unobserved haplotype information. While we do not focus additional attention on the selection of these models, we acknowledge the importance of considering the genetic assumptions regarding the population in identifying a method for estimating posterior haplotype probabilities.
In the original formulation of mixed modeling for genotype–phenotype association data [22], a subject who is heterozygous at two positions, so that the observed genotype is Aa for SNP 1 and Bb for SNP 2, would be assigned to the genotype group defined by (Aa, Bb). However, the true haplotype pair (diplotype) for this individual could be (1) (AB, ab): A and B are on the same chromosome, and a and b are on the same chromosome, or (2) (Ab, aB): A and b are on the same chromosome and a and B are on the same chromosome. While this additional layer of information is usually unobserved, the probabilities that each haplotype pair is the true haplotype pair can be estimated, as described in [3].
Haplotype pairs (in this simple example, a set of two of AB, Ab, aB, or ab) can be regarded as clusters, rendering the mixed-effects model a natural framework for analysis. While a small number of clusters can render instability in model fitting, in general, the number of potential haplotypes under consideration within a gene (or combinations of haplotypes across genes as discussed below) is large. In some instances this cluster membership is fully observable. For example, if a subject is homozygous for all SNPs within a gene, then the haplotypes for that individual are known deterministically. However, if an individual is heterozygous for two or more SNPs within a gene, then the true haplotypes are not observable. In the following sections we present a multiple imputation approach to incorporating this uncertainty in phase. Notably, this approach is applicable to the analysis of haplotype–phenotype associations in settings in which we observe multiple SNPs within a single gene, as well as multiple SNPs across many genes.
2.1. Mixed modeling for haplotype data
Consider the general mixed-effects model given in [25, 48, 49] and equation (1). Here, yi j is the response for the jth individual in cluster i, xi j and zi j are the corresponding covariate values and β is the vector of parameters corresponding to xi j. For simplicity of notation, we assume that is a scalar, is measurement error and bi is independent of εi j.
| (1) |
In our setting, we define clusters based on the ‘observed’ haplotype pairs across one or more genes. ‘Observed’ is in quotation marks here since, in general, haplotypes are unobservable with genotype data from unrelated individuals. We begin by describing the model assuming complete (i.e. phase-known) data and then address the unobservable nature of haplotypes as a missing-data problem. Consider first the simple case in which clusters are defined based on single genes. Further, let Hr = (hk, hl ) and Hs = (hk′, hl′ ) denote the diplotypes (pair of haplotypes) at genes r and s, respectively, for a given individual. The cluster for gene r then consists of the set of all individuals for whom . Similarly, the cluster for gene s equals the set of all individuals for whom . More generally, and depending on the scientific questions under consideration, clusters can be defined on the basis of haplotype pairs across multiple genes. For example, in the case just described, we could define as the set of all subjects for whom and .
As described in Foulkes et al. [22], an omnibus test of is a test of overall genetic variability. Further investigation of empirical Bayes estimates of the random effects (bi in Equation (1)) and corresponding prediction intervals can lend insight into the specific genotypes that contribute to this variability. Note also that bi could be a vector with components equal to the random cluster i effect and the interaction effect between cluster i and a specific covariate represented in zi j. For example, we may have zi j = [1 ti j ], where ti j is an indicator for drug exposure for the jth person in cluster i. Recall that each individual will have a pair of haplotypes, one on each chromosome, making this model distinct from the genotype setting in which each individual has a single genotype [22].
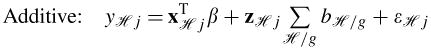
Assuming an additive model of association, equation (1) reduces to equation (2). Here we change the notation slightly since cluster assignments based on one gene may differ from assignments based on another gene, as described above. Let ℋ denote the combination of haplotypes across all observed genes so that yℋj is the response for the jth person with multi-gene haplotype combination ℋ and xℋj and zℋj are corresponding covariates. In this equation, the summation is over ℋ/g, which refers to the component of ℋ (i.e. the cluster assignment) corresponding to gene g. Note that an additive model assumes that the effect of carrying the diplotypes Hr and Hs is simply the sum of the individual diplotype effects. A multiplicative model of association, on the other hand, is described by equation (3), where the effect of having a combination of diplotypes is the product of the individual effects. Finally, a third and less structured formulation assumes that each combination of haplotypes across multiple genes has its own random effect, resulting in the model given by equation (4).
Models of association in a mixed framework.
 |
(2) |
| (3) |
| (4) |
Since each individual carries up to two haplotypes, particular consideration needs to be given to how haplotypes act in concert, which is generally referred to as the genetic model. One such model is an additive model, which assumes that the effect of each haplotype is the sum of the individual haplotype effects. An example of an additive genetic model (that additionally assumes the general model of association given in equation (4)) is given in equation (5), where again ℋ represents the multi-gene haplotype combination and ℋ(1) and ℋ (2) represent the respective combinations on the two chromosomal copies. In contrast, a dominant haplotype model (given by equation (6)) assumes that one haplotype combination over-rides the effect of the others. More complex models in which a haplotype is dominant only for a subset of the other haplotypes are also feasible. Finally, a general genetic model, assumes that each pair of haplotypes has its own random effect, as described in equation (7). For the purpose of the present study, we focus on this most general genetic model, since in many data settings a clear model of haplotypic effects has not been described.
Genetic models in a mixed framework.
| (5) |
| (6) |
| (7) |
2.2. Incorporating uncertainty in phase and testing
In order to fit the models described above and test relevant hypotheses, haplotypes need to be inferred. A natural approach is to treat unobservable haplotype information as missing and to adopt a multiple imputation framework for this missing data setting. This requires specification of (1) the mechanism generating the missing data and (2) the probability model used to simulate the missing values. Since the haplotypes of individuals who are heterozygous for at least two SNPs within a gene cannot be specified deterministically, we consider these missing. For these individuals the probability of missingness is 1, regardless of the observed data, while for individuals who are heterozygous at exactly 0 or 1 SNP within a gene the probability of missingness is 0. Note that the missingness does not depend on the specific values of the haplotypes, and therefore it is reasonable to assume that the data are missing completely at random [24, 50].
We further assume that haplotypes are realizations from a multinomial probability distribution, that is, an individual has a haplotype combination h with an unknown probability, ph, h = 1,…, Nh. We propose using an EM-type method as described in [3] to estimate this probability distribution within each gene and imputing haplotypes from this individual posterior probability distribution. A haplotype pair is thus selected for each gene for each individual and this process is repeated for all individuals to arrive at a single completed data set. By repeating this procedure multiple times, we arrive at a total of M completed data sets.
For example, suppose the estimated haplotype probabilities for an individual with genotypes (Aa, Bb) for gene r and (Cc, Dd) for gene s are: p̂r,1 = 0.40 for Hr,1 = (AB, ab), p̂r,2 = 0.60 for Hr,2 = (Ab, aB), p̂s,1 = 0.20 for Hs,1 = (C D, cd) and 3 p̂s,2 = 0.80 for Hs,2 = (Cd, cD). Webegin by sampling one haplotype from Hr,1 and Hr,2 with probabilities 0.40 and 0.60, respectively. We then select one haplotype from Hs,1 and Hs,2 with probabilities 0.20 and 0.80, respectively. Combined, these two selected haplotypes represent the completed data for this individual. This is repeated for each individual to arrive at a single completed data set and then repeated multiple times to generate multiply imputed data sets.
A mixed model with random haplotype effects can be fitted for each of the M imputed data sets and an omnibus test statistic for the null hypothesis that the variability in the haplotype effects equals zero is calculated. This corresponds to the null hypothesis , where defined in equation (1). These test statistics are denoted and are combined using the method described by Li et al. [51]. In general, investigators may be interested in testing a genetic contribution to the disease phenotype that is mediated by an environmental or demographic factor and a corresponding composite null could be considered. In our example, we consider two genes; however, more generally, if K genes are observed, subsets of 1, 2, …, K genes can be used in the modeling. In that setting, findings need to be interpreted with caution due to the large number of tests performed and the corresponding inflation of the type 1 error rate. Further discussion of this is provided in Section 4.
3. NUMERICAL EXAMPLES
3.1. Genetics of ART-associated dyslipidemia in HIV
In this section we present an analysis of data generated as part of the AIDS Clinical Trials Group (ACTG) New Works Concept Sheet (NWCS) 224, a study to identify genetic factors that predict lipid abnormalities in HAART-treated HIV-1-infected individuals. First-stage analysis results, including complete demographic and clinical characteristics of this study population, can be found in Foulkes et al. [52]. The cohort under investigation includes N = 626 subjects (N = 378, 60.4 per cent White/non-Hispanic, N = 121, 19.3 per cent Black/non-Hispanic, N = 112, 17.9 per cent Hispanic and N = 15, 2.4 per cent other) enrolled in selected ACTG studies (A5005s, ACTG372, A5068, A5116 and A5087) who consented to collection and storage of their blood for genetic studies (A5128). The population is predominantly male (N = 557, 89 per cent), with a median age of 41 (IQR = (36, 48)), median body mass index of 25 (IQR = (22, 28)) and median CD4 count of 442 (IQR = (294, 643)).
In this paper, we consider the effects of each of the four genes, ApoCIII, ApoE, EL and HL on the lipid outcome, HDL-C. In addition, the three gene combinations ApoCIII/ApoE, EL/ApoE and HL/ApoE, are evaluated. Potential confounding by clinical and demographic variables, including age, gender, use of lipid-lowering therapy, CD4 count and ART drug exposures, is controlled through multivariable modeling. In order to account for potential effect modification by race/ethnicity, as described in Foulkes et al. [52], all analyses are presented overall and then stratified by race/ethnicity. Individuals with unknown drug exposures, short durations of exposure (<21 days) to a specific class, or a short washout period (<14 days) are excluded from analysis. In addition, subjects with missing genotype are excluded from analysis involving the corresponding gene.
SNPs in ApoE [Arg112Cys T/C (rs429358), Arg158Cys T/C (rs7412)] used to define the common E2 (Cys-Cys; C-C), E3 (Cys-Arg; C-T) and E4 (Arg-Arg; T-T) alleles are analyzed. In addition, SNPs in ApoCIII [−482C/T (rs2854117), −455T/C (rs2854116), intron 1 (466) G/C (rs2070669), Gly34Gly C/T (rs4520), exon 4 SstI 4348(5) C/G (rs5128)], [HL [rs2070895, rs12595191, rs690, rs6084] and EL [rs12970066, Asn396Ser, rs3829632 (−1309A/G)] were chosen for analysis based on prior knowledge of functionality and association with plasma lipoproteins [53–59]. As described previously [52], genotyping was performed at the University of Pennsylvania Genotyping Core employing Taqman (Applied Biosystems, Inc., Foster City, CA) ABI SNP genotyping assays using the ABI 7900HT on DNA samples that were isolated from blood (PURE-GENE blood kits; Gentra Systems Inc., Minneapolis, MN) at the ACTG DNA Core Laboratory at Vanderbilt University.
All data analyses were performed in R (ver 2.2.1). The observed genotypes and corresponding frequencies are reported by race/ethnicity in Table I. Estimated posterior haplotype probabilities were calculated within racial/ethnic strata using the haplo.em() function in the R haplo. stats package and are presented in Table II. Fully adjusted multivariable models were fitted assuming general models of association (as defined in equation (4)) and genetic models (equation (7)). Separate models were fitted with random effects of genotypes and haplotypes for each gene and then for the two gene combinations. M = 500 imputations were performed for each haplotype analysis. Likelihood ratio test statistics for variability in the random genotype and random haplotype effects are presented in Table III. This corresponds to the test , where is defined in equation (1). Note that these tests have a 50:50 mixture of a and distribution since a variance parameter is being tested at the boundary.
Table I.
Summary of genotype data by race/ethnicity.
| EL
|
Count
|
Total | |||||
|---|---|---|---|---|---|---|---|
| rs12970066 | Asn396Ser | rs3829632 (−1309A/G) | White | Black | Hispanic | ||
| 1 | AA | CC | AA | 92 | 64 | 23 | 179 |
| 2 | AA | CC | AG | 5 | 1 | 0 | 6 |
| 3 | AA | CG | AA | 90 | 42 | 24 | 156 |
| 4 | AA | CG | AG | 4 | 1 | 0 | 5* |
| 5 | AA | GG | AA | 35 | 5 | 4 | 44 |
| 6 | AA | GG | AG | 1 | 0 | 0 | 1 |
| 7 | AG | CC | AA | 85 | 6 | 31 | 122 |
| 8 | AG | CC | AG | 2 | 0 | 0 | 2* |
| 9 | AG | CG | AA | 51 | 1 | 13 | 65* |
| 10 | GG | CC | AA | 6 | 0 | 14 | 20 |
| Total | 371 | 120 | 109 | 600 | |||
| ApoE
|
Count
|
Total | ||||
|---|---|---|---|---|---|---|
| Arg112Cys (rs429358) | Arg158Cys (rs7412) | White | Black | Hispanic | ||
| 1 | CC | CC | 6 | 4 | 0 | 10 |
| 2 | CT | CC | 85 | 40 | 31 | 156 |
| 3 | CT | CT | 11 | 2 | 0 | 13* |
| 4 | TT | CC | 221 | 56 | 70 | 347 |
| 5 | TT | CT | 45 | 15 | 8 | 68 |
| Total | 368 | 117 | 109 | 594 | ||
Haplotypic phase is unobservable for individuals with the corresponding genotype. A total of 56 genotypes are observed within HL across the three racial/ethnic groups (38 observed genotypes in Whites, 33 in Black/non-Hispanics and 34 in Hispanics), and 52 genotypes are observed for ApoCIII (43 observed genotypes in Whites, 24 in Black/non-Hispanics and 25 in Hispanics). 595 individuals have complete genotype data for HL, and 595 individuals have complete genotype data for ApoCIII. Haplotypic phase is unobservable in 43.4 and 60.8 per cent of our cohort for HL and ApoCIII, respectively.
Table II.
Estimated haplotype frequencies by race/ethnicity.
| ApoCIII
|
Estimated frequency
|
|||||||
|---|---|---|---|---|---|---|---|---|
| − (rs2854117) | −455 T/C (rs2854116) | Intron 1 (466) G/C (rs2070669) | Gly34Gly C/T (rs4520) | Exon 4 SstI 4348(5) C/G (rs5128) | White | Black | Hispanic | |
| 4 | C | C | G | C | C | 0.12 | 0.15 | 0.045 |
| 5 | C | T | C | C | C | 0.016 | 0.049 | — |
| 6 | C | T | C | T | C | 0.030 | 0.033 | — |
| 6 | C | T | C | T | G | — | 0.057 | — |
| 7 | C | T | G | C | C | 0.46 | 0.11 | 0.35 |
| 8 | C | T | G | T | C | 0.10 | 0.063 | 0.18 |
| 9 | T | C | C | C | C | 0.12 | 0.57 | 0.21 |
| 10 | T | C | C | T | C | 0.034 | 0.013 | — |
| 11 | T | C | C | T | G | 0.082 | 0.071 | 0.17 |
| 12 | T | C | G | C | C | 0.017 | — | 0.019 |
| ApoE
|
Estimated frequency
|
||||
|---|---|---|---|---|---|
| Arg112Cys (rs429358) | Arg158Cys (rs7412) | White | Black | Hispanic | |
| 1 | C | C | 0.15 | 0.21 | 0.14 |
| 2 | T | C | 0.78 | 0.71 | 0.83 |
| 3 | T | T | 0.075 | 0.073 | 0.032 |
| EL
|
Estimated frequency
|
|||||
|---|---|---|---|---|---|---|
| rs12970066 | Asn396Ser | rs3829632 (−1309A/G) | White | Black | Hispanic | |
| 1 | A | C | A | 0.49 | 0.74 | 0.46 |
| 2 | A | C | G | 0.013 | — | — |
| 3 | A | G | A | 0.29 | 0.22 | 0.21 |
| 4 | G | C | A | 0.20 | — | 0.33 |
| HL
|
Estimated frequency
|
||||||
|---|---|---|---|---|---|---|---|
| rs2070895 | rs12595191 | rs690 | rs6084 | White | Black | Hispanic | |
| 1 | A | A | T | G | — | — | 0.014 |
| 2 | A | A | T | T | — | 0.012 | 0.022 |
| 3 | A | G | C | G | 0.091 | 0.16 | 0.27 |
| 4 | A | G | C | T | 0.12 | 0.18 | 0.11 |
| 5 | A | G | T | G | 0.017 | 0.045 | 0.049 |
| 6 | A | G | T | T | — | 0.16 | 0.016 |
| 7 | G | A | C | G | 0.057 | 0.012 | 0.035 |
| 8 | G | A | C | T | 0.075 | — | 0.053 |
| 9 | G | A | T | G | — | 0.022 | — |
| 10 | G | G | C | G | 0.17 | 0.085 | 0.13 |
| 11 | G | G | C | T | 0.33 | 0.14 | 0.21 |
| 12 | G | G | T | G | 0.066 | 0.13 | 0.037 |
| 13 | G | G | T | T | 0.060 | 0.058 | 0.049 |
Note: — Indicates estimated frequency < 0.01. Haplotypes with estimated frequencies of less than 0.01 in all three racial/ethnic groups are not presented in this table but are included in the analysis.
Table III.
Omnibus test statistics for genotype and haplotype effects.
| Gene(s) | Genotype analysis
|
Haplotype analysis
|
||||||
|---|---|---|---|---|---|---|---|---|
| White | Black | Hispanic | Overall* | White | Black | Hispanic | Overall* | |
| Single genes | ||||||||
| ApoCIII | 0 | 0 | 0 | 0 | 0 | 0 | 0 | 0 |
| ApoE | 0 | 0 | 1.70 | 0.61 | 0 | 0 | 1.7 | 0.62 |
| EL | 1.59 | 0.13 | 7.38 | 5.19 | 1.59 | 0.13 | 7.38 | 5.14 |
| HL | 0 | 0 | 3.86 | 0 | 0 | 0.095 | 3.87 | 0.009 |
| Multiple genes | ||||||||
| ApoE/ApoCIII | 0.34 | 0 | 0 | 0 | 0.39 | 0 | 0 | 0 |
| ApoE/EL | 0.89 | 0.11 | 11.69 | 3.99 | 0.89 | 0.11 | 11.69 | 3.91 |
| ApoE/HL | 1.37 | 0.19 | 2.51 | 0.61 | 0.35 | 0.19 | 2.33 | 0.13 |
Overall models include Whites, Blacks and Hispanics and are adjusted for race/ethnicity as a potential confounder. All results are based on models adjusted for age, gender, use of lipid-lowering therapy, CD4 count, study and current drug (NRTI, NNRTI and/or PI) exposure. Separate models were fitted for each gene and two gene combinations within race/ethnicity. Haplotype-based analysis included 500 multiply imputed data sets.
Significant variability is observed across EL/ApoE genotypes on HDL-C within Hispanics but not in the other racial/ethnic groups. For Hispanics, the findings of the haplotype-based analysis are almost identical. This is explained by the fact that, for this data example and within this racial/ethnic group, haplotypes were almost all fully determined. In fact, closer examination of Table I reveals only 13 Hispanic subjects with heterozygosity at more than one SNP within EL and no Hispanics with heterozygosity at both SNPs within ApoE. Furthermore, given the very low estimated haplotype probability of GGA in EL (given in Table II), and the correspondingly low posterior probabilities for these 13 individuals, the multiple imputation procedure is highly likely to select the same haplotype at each iteration. In other words, the high degree of concordance in the genotype and haplotype findings is likely due to the fact that, in our simple example, the two variables are capturing similar information within Hispanics.
In general, if the SNPs under investigation are markers for disease-causing variants (i.e. are in LD with such variants) or have functional effects on transcription, translation or function only when found in combination in cis (as a haplotype on the same chromosome), then the genotype- and haplotype-based findings may deviate. The majority of individuals in our cohort (60.8 per cent) have unobservable haplotypic phase for ApoCIII, in which five SNPs are considered to constitute a haplotype block. In this case, a lack of deviation between the genotype- and haplotype-based analyses suggests that any association of ApoCIII variation with HDL is related entirely to the studied SNPs, i.e. they have direct functional effects, or that the underlying ApoCIII haplotype structure is incompletely defined by the genotyped SNPs. In fact, both of these possibilities are supported by the literature [59].
While significant variability in HDL-C is observed for the EL/ApoE combination within Hispanics ( ), the empirical Bayes estimates and corresponding prediction intervals provided in Figure 1 do not provide conclusive evidence to suggest a particular genotype pattern with a non-zero effect. In fact, the three most extreme genotype patterns (based on empirical Bayes estimates) have only n = 3, 6 and 3 observations each within Hispanics. We present 99 per cent prediction as an ad hoc approach to adjust for inflation of type 1 error due to multiple testing. Further consideration to multiple testing may be warranted for settings in which more than two genes are under investigation, as discussed in Section 4.
Figure 1.

Empirical Bayes estimates and prediction intervals for random genotype effects within Hispanics.
In order to characterize the first-stage estimation of posterior haplotype probabilities, we took 1000 bootstrapped samples of the observed genotypes, re-estimated haplotype probabilities for each of these sample and calculated variances of the posterior haplotype probabilities. As noted above, the haplotypes within Hispanics were almost fully determined, with a small number of subjects having two possible haplotypes at EL, with estimated posterior probabilities in the original sample of >0.99 and <0.01. For these subjects, the variance of the posterior haplotype probabilities for EL over the bootstrapped samples was equal to 5.07e–14. The greatest haplotype uncertainty was observed for two Caucasian subjects with estimated posterior probabilities in the original sample of 0.26 and 0.74 for their two possible haplotypes. In this case, the variance of these probability estimates was 0.044. We do not expect this additional uncertainty to affect our findings within Hispanics, given the magnitude; however, consideration of this additional layer of uncertainty may be relevant in some settings.
3.2. A simulation study
A simulation study was performed to assess the performance of the methods presented in the previous sections. A particular motivation for the simulation study was to investigate the statistical power of the mixed modeling approach for identifying the overall genotype effects and the combination of multiple imputation inference and mixed modeling for characterizing hap-lotype effects. Samples of sizes N = 200, 400 and 800 were generated. For the purpose of our simulation study, the within-Caucasian estimated genotype and haplotype frequencies for EL and ApoE (based on the data observed for our cohort) are assumed to be the true frequencies. Caucasian genotype data had the greatest frequency of phase-unknown data in our sample and therefore were most appropriate for these simulations. Phenotypes are simulated according to the general model of association (equation (4)) and genetic model (equation (7)). Power to detect variability in the two-gene combination is reported for ratios of the standard deviation of the random effects to the error standard deviation (σb/σε), where σ ε is set equal to 1 and σb ranges from 0.1 to 0.8.
Power curves are provided in Figure 2. For the genotype analysis, genotypes were sampled with probabilities equal to the assumed frequencies (estimated from the observed data) and 100 simulations were performed under each condition (i.e. for each sample size and for each ratio of standard deviations). This was repeated 10 times to characterize the variability in sampling from the assumed frequencies. The median power across the 10 samples is plotted for each condition and bars represent 25th and 75th quartiles. For the haplotype analysis, haplotype pairs were sampled with probabilities equal to the corresponding products of estimated haplotype frequencies. In each of the 100 simulations the true underlying phase was treated as unobserved and 10 multiply imputed data sets were generated as described in Section 2.2. Again, this was repeated 10 times to account for variability in sampling from the assumed frequencies.
Figure 2.

Power for detecting overall genotype and haplotype effects. Power calculations for haplotype effects assume that haplotypic phase is not observed.
The simulation analysis suggests that, for this two-gene example, a sample of size 400 provides approximately 90 per cent power to detect genotype-related variability when the ratio of standard deviations (σb/σε) is 0.3 or higher. A sample size of 800 would be required to achieve the same power for a haplotype analysis in which phase is unobservable. Notably, in general, the number of clusters based on genotype will be smaller than those based on haplotype. In our example for EL/ApoE, there are 33 genotype clusters (out of a possible (32)(33) = 243) with an estimated prevalence of greater than 0 (i.e. 33 genotypes are observed in our data set for the EL/ApoE combination). On the other hand, there are possible haplotype clusters with estimated prevalences of greater than 0.
Additional simulations were performed under the assumption of no genetic contribution to the variability in phenotype. For each simulated data set, a test of the null hypothesis is performed at the α = 0.05 level. An estimate of the type 1 error rate is given by the proportion of times this null is rejected. The estimated type 1 error rates for samples of sizes 200, 400 and 800 are 0.05, 0.06 and 0.055, respectively, for the genotype analysis and 0.065, 0.065 and 0.06 for the haplotype analysis. Again, 100 simulations were performed under each condition and this was repeated 10 times to account for sampling variability. The numbers reported are the medians across these 10 repeats.
4. DISCUSSION
The pathophysiology of dyslipidemia in ART-treated HIV patients is likely to be multifactorial and involves synergy among several genetic and gene–drug pathways, including (1) HIV-related inflammation, (2) disease–drug interactions, (3) direct and indirect effects of therapy on lipoprotein metabolism, and (4) drug metabolism-related gene effects. This paper presents a novel analysis, that accounts for potential ambiguity in allelic phase, to explore potential multi-locus effects on HDL-C across candidate genes.
As discussed in Section 1, consideration of haplotypic phase in the analysis of gene associations is informative when genetic variation on the same chromosome affects transcription or translation differently than when the variation occurs on different chromosomal copies and/or the SNPs under investigation are in LD with functional alleles but are not causal. Contemporary genetic associations are identified using a staged approach that typically proceeds by first characterizing association among tag SNPs (that mark haplotypes) and a disease trait. Using this knowledge, further investigation of variation within specific regions is generally obtained through dense SNP mapping and resequencing efforts. Finally, additional analysis and lab-based experiments allow for the identification of functional SNPs that are causal for the disease trait. If interest lies in testing associations of putative functional SNPs, then a haplotype-based analysis is not necessary and may result in a loss of power; however, if the SNPs under investigation are haplotype tagging SNPs but not in necessarily disease causing, then a haplotype-based analysis provides unique and key information on the regional significance.
ApoE, an apolipoprotein on circulating lipoproteins, facilitates hepatic clearance of atherogenic apoB-rich particles (e.g. low-density (LDL) lipoproteins) through its binding to specific receptors in the liver [60]. Genetic variation in apoE, particularly the common E2/3/4 alleles that we have studied here, has been associated with the variation in apoB lipoproteins due to direct effects of these alleles on apoE hepatic clearance functions [53, 55]. ApoCIII, similar to ApoE, circulates on lipoproteins and also regulates the metabolism and clearance of apoB lipoproteins. Genetic variation in both ApoE and ApoCIII can have indirect effects on HDL-C levels through their direct modulation of circulating apoB-rich lipoproteins [59]. EL and HL belong to a family of lipases that catabolize and remodel circulating lipoproteins, specifically lowering HDL-C because of their preferential activity for HDL substrates [61]. Our group and others have shown that SNPs in EL are associated with the variation in HDL-C levels [54, 56, 58]. In the current work, we hypothesized that, because of distinct but complementary effects on HDL particles, genetic variation in apoE would interact with EL, HL or APOCIII to have additive or synergistic effects on HDL-C, particularly in this HIV-1 sample that is exposed to HAART drugs that also tend to lower HDL-C. Interestingly, we found this to be the case for apoE and EL in Hispanics but not in Whites and Blacks, which may be suggestive of additional genetic or environmental (e.g. diet) factors influencing the association.
Similar formulations of the proposed method using applications of non-linear mixed models for categorical outcomes and frailty models for survival data are straightforward. In the example provided, the most general genetic model and model of association were assumed, rendering model fitting straightforward using the lme() function of the nlme package in R. Fitting the more structured models described in Section 2 is less straightforward and may require development of novel software tools. In this paper we focused on an omnibus test of an overall genotype or haplotype effect. In the presence of such an effect, interest may lie in identifying specific multi-locus haplotype effects that are significantly different from 0. Posterior means of random haplotype effects and corresponding prediction intervals inform us about this likelihood; however, appropriate consideration needs to be given to how to combine information across imputed data sets in calculating these prediction intervals.
A fully likelihood-based approach to address missing cluster membership in a mixed modeling framework using expectation conditional maximization is also tenable. The multiple imputation approach described in this paper is likely to have reduced power compared with a full likelihood approach due to the increased standard errors resulting from the multiple imputation procedure. Multiple imputation, however, leads to valid inference [10] and has the primary advantage of ease of implementation with existing software tools, including the nlme and haplo.stats libraries of R as described in Section 3.1. In addition, the approach presented here provides flexibility to incorporate alternative haplotype estimation procedures. For example, posterior haplotype probabilities could be estimated using the MCMC approach described in [8] or the hidden Markov modeling approach more recently presented in [9]. Again, existing software tools (PHASE or fast-PHASE [9]) can be utilized. Finally, using a staged approach has the advantage that it allows for stratifying by race/ethnicity to obtain each individual’s posterior haplotype probability estimates under the assumption of HWE and then combining racial/ethnic groups in assessing phenotype associations. This, however, requires the assumption of no effect modification by race/ethnicity.
Inflation of type 1 error resulting from multiple testing is always a concern in studies investigating multiple predictor variables (in our setting SNPs or genes). One of the key advantages of the mixed modeling approach is the formation of a single cluster variable within a gene and/or across multiple genes. Traditional genotype analysis involves testing the association between single SNPs and an outcome, often resulting in a large number of tests. More sophisticated haplotype-based methods generally test for haplotype effects within each gene, although multiple testing continues to be a concern if a large number of genes are under investigation. In the mixed modeling setting, on the other hand, a single omnibus test of variability across the cluster effects (where again clusters are defined based on multiple SNPs within a single gene or across multiple genes) is performed, obviating the need for a multiple comparison adjustment. Multiple testing remains a concern, however, in the construction of prediction intervals for the resulting empirical Bayes estimates and requires further consideration.
In addition, due to sample size limitations or based on the biological hypothesis at hand, testing of multiple small groups of genes may be of interest. For example, in this paper we investigated the interaction between apoE and EL due to the potential complementary mechanistic pathways each gene product has on HDL-C. A similar approach could be used to look at interactions between several lipoprotein pathway genes (e.g. apoE, ApoC-III, EL, lipoprotein lipase, and HL) or groups of pathways (lipoprotein, adipocyte, and inflammatory pathways) on plasma lipoproteins. Since clusters based on all of these genes would be untenable, a series of models could be fitted, one for each combination of two genes at a time, and corresponding omnibus tests performed. In this case, an adjustment for multiple testing is crucial and, given the correlated nature of the tests, a resampling-based method may be most appropriate [62].
Principled methods for analyzing clustered data with missing cluster memberships will enhance our ability to assess underlying associations in many settings. For example, administrative data systems (e.g. those maintained by hospitals or cancer registry systems) are often missing information on natural groupings, such as country of origin, postal zip-codes, race/ethnicity or income category. Incorporating confidential information can improve the accuracy of both the imputation procedure and the statistical inference; however, obtaining such information is not always feasible. The method described in this paper provides a natural framework for obtaining statistically valid results in these additional settings. Furthermore, extension to settings in which there is incomplete information on more than one nested cluster (e.g. hospital identifier and race/ethnicity distribution within each hospital) is straightforward. Additionally, alternative distributional assumptions (e.g. the general location model) for the missing information that additionally adjust for covariates can be employed. Ultimately, the approach described in this paper provides investigators with a viable analytical strategy to discover complex clinical and biological associations in the context of unobservable information.
Acknowledgments
Contract/grant sponsor: NIAID; contract/grant numbers: AI056983, AI38858, AI45008
Contract/grant sponsor: NIDDK; contract/grant number: DK071224
Contract/grant sponsor: NHLBI; contract/grant numbers: HL073278, HL083799
Special thanks to the AIDS Clinical Trials Group (ACTG) New Works Concept Sheet 224 (NWCS224) study team who played a valuable role in collecting the data presented in this paper. Support for this research was provided by a National Institute of Allergy and Infectious Diseases (NIAID) Independent Research Award to A. S. F. (R01 AI056983), a Center for AIDS Research Development Award (A. S. F. and M. P. R.) from the University of Pennsylvania (5-P30 AI45008), a NWCS224 award from the ACTG (A. S. F. and M. P. R.). M. P. R. is additionally supported by R01 HL073278, R01 DK071224, P50 HL083799 and RFA RM-06-002. This research was supported in part by the Adult ACTG funded by the NIAID (AI38858).
References
- 1.The International HapMap Consortium. A haplotype map of the human genome. Nature. 2005;437:1299–1320. doi: 10.1038/nature04226. [DOI] [PMC free article] [PubMed] [Google Scholar]
- 2.Schaid DJ. Evaluating associations of haplotypes with traits. Genetic Epidemiology. 2004;27(4):248–264. doi: 10.1002/gepi.20037. [DOI] [PubMed] [Google Scholar]
- 3.Excoffier L, Slatkin M. Maximum-likelihood estimation of molecular haplotype frequencies in a diploid population. Molecular Biology and Evolution. 1995;12:921–927. doi: 10.1093/oxfordjournals.molbev.a040269. [DOI] [PubMed] [Google Scholar]
- 4.Zaykin DV, Westfall PH, Young SS, Karnoub MA, Wagner MJ, Ehm MG. Testing association of statistically inferred haplotypes with discrete and continuous traits in samples of unrelated individuals. Human Heredity. 2002;53:79–91. doi: 10.1159/000057986. [DOI] [PubMed] [Google Scholar]
- 5.Schaid D, Rowland C, Tines D, Jacobson R, Poland G. Score tests for association between traits and haplotypes when linkage phase in ambiguous. American Journal of Human Genetics. 2002;70:425–434. doi: 10.1086/338688. [DOI] [PMC free article] [PubMed] [Google Scholar]
- 6.Zhao LP, Li SS, Khalid N. A method for the assessment of disease associations with single nucleotide polymorphism haplotypes and environmental variables in case–control studies. American Journal of Human Genetics. 2003;72:1231–1250. doi: 10.1086/375140. [DOI] [PMC free article] [PubMed] [Google Scholar]
- 7.Lake SL, Lyon H, Tantisira K, Silverman EK, Weiss ST, Laird NM, Schaid DJ. Estimation and testing of haplotype–environment interaction when linkage phase is ambiguous. Human Heredity. 2003;55:56–65. doi: 10.1159/000071811. [DOI] [PubMed] [Google Scholar]
- 8.Stephens M, Smith N, Donnelly P. A new statistical method for haplotype reconstruction from population data. American Journal of Human Genetics. 2001;68:978–989. doi: 10.1086/319501. [DOI] [PMC free article] [PubMed] [Google Scholar]
- 9.Scheet P, Stephens M. A fast and flexible statistical model for large-scale population genotype data: applications to inferring missing genotypes and haplotypic phase. American Journal of Human Genetics. 2006;78(4):629–644. doi: 10.1086/502802. [DOI] [PMC free article] [PubMed] [Google Scholar]
- 10.Little RJA, Rubin DB. Statistical Analysis with Missing Data. Wiley; New York: 1987. [Google Scholar]
- 11.Schafer JL. Multiple imputation: a primer. Statistical Methods in Medical Research. 1999;8:3–15. doi: 10.1177/096228029900800102. [DOI] [PubMed] [Google Scholar]
- 12.Yucel R, Zaslavsky A. Imputation of binary treatment variables with measurement error in administrative data. Journal of the American Statistical Association. 2005;100(472):1123–1132. [Google Scholar]
- 13.Lin DY, Zeng D. Likelihood-based inference on haplotype effects in genetic association studies. Journal of the American Statistical Association. 2006;101(473):89–104. [Google Scholar]
- 14.Zhang H, Bonney G. Use of classification trees for association studies. Genetic Epidemiology. 2000;19:323–332. doi: 10.1002/1098-2272(200012)19:4<323::AID-GEPI4>3.0.CO;2-5. [DOI] [PubMed] [Google Scholar]
- 15.Hoh J, Wille A, Zee R, Cheng S, Reynolds R, Lindpaintner K, Ott J. Selecting SNPs in two-stage analysis of disease association data: a model-free approach. Annals of Human Genetics. 2000;64:413–417. doi: 10.1046/j.1469-1809.2000.6450413.x. [DOI] [PubMed] [Google Scholar]
- 16.Segal MR, Cummings MP, Hubbard AE. Relating amino acid sequence to phenotype: analysis of peptide-binding data. Biometrics. 2001;57:632–643. doi: 10.1111/j.0006-341x.2001.00632.x. [DOI] [PubMed] [Google Scholar]
- 17.Ritchie M, Hahn L, Roodi N, Bailey R, Dupont W, Parl F, Moore J. Multifactor-dimensionality reduction reveals high-order interactions among estrogen-metabolism genes in sporadic breast cancer. American Journal of Human Genetics. 2001;69:138–147. doi: 10.1086/321276. [DOI] [PMC free article] [PubMed] [Google Scholar]
- 18.Nelson M, Kardia S, Ferrell R, Sing C. A combinatorial partitioning method to identify multilocus genotypic partitions that predict quantitative trait variation. Genome Research. 2001;11:458–470. doi: 10.1101/gr.172901. [DOI] [PMC free article] [PubMed] [Google Scholar]
- 19.DiRienzo G, DeGruttola V. Nonparametric methods to predict HIV drug susceptibility phenotype from genotype. Statistics in Medicine. 2003;22(17):2785–2798. doi: 10.1002/sim.1516. [DOI] [PubMed] [Google Scholar]
- 20.Foulkes AS, DeGruttola V, Hertogs K. Combining genotype groups and recursive partitioning: an application to HIV-1 genetics data. Journal of the Royal Statistical Society, Series C. 2004;53(Part 2):311–323. [Google Scholar]
- 21.Schaid DJ, McDonnell K, Hebbring SJ, Cunningham JM, Thibodeau ST. Nonparametric tests of association of multiple genes with human disease. American Journal of Human Genetics. 2005;76:780–793. doi: 10.1086/429838. [DOI] [PMC free article] [PubMed] [Google Scholar]
- 22.Foulkes AS, Reilly M, Zhou L, Wolfe M, Rader DJ. Mixed modeling to characterize genotype–phenotype associations. Statistics in Medicine. 2005;24:775–789. doi: 10.1002/sim.1965. [DOI] [PubMed] [Google Scholar]
- 23.Becker T, Schumacher J, Cichon S, Baur M, Knapp M. Haplotype interaction analysis of unlinked regions. Genetic Epidemiology. 2005;29:313–322. doi: 10.1002/gepi.20096. [DOI] [PubMed] [Google Scholar]
- 24.Little RJA, Rubin DB. Statistical Analysis with Missing Data. Wiley; New York: 2002. [Google Scholar]
- 25.Laird NM, Ware JH. Random-effects models for longitudinal data. Biometrics. 1982;38:963–974. [PubMed] [Google Scholar]
- 26.Friis-Moller N, Weber R, Reiss P, Thiebaut R, Kirk O, d’Arminio Monforte A, Pradier C, Morfeldt L, Mateu S, Law M, El-Sadr W, De Wit S, Sabin CA, Phillips AN, Lundgren JD. Cardiovascular disease risk factors in HIV patients—association with antiretroviral therapy. AIDS. 2003;17:1179–1193. doi: 10.1097/01.aids.0000060358.78202.c1. [DOI] [PubMed] [Google Scholar]
- 27.Fontas E, van Leth F, Sabin CA, Friis-Moller N, Rickenbach M, d’Arminio Monforte A, Kirk O, Dupon M, Morfeldt L, Mateu S, Petoumenos K, El-Sadr W, de Wit S, Lundgren JD, Pradier C, Reiss P. Lipid profiles in HIV-infected patients receiving combination antiretroviral therapy: are different antiretroviral drugs associated with different lipid profiles? Journal of Infectious Diseases. 2004;189:1056–1074. doi: 10.1086/381783. [DOI] [PubMed] [Google Scholar]
- 28.Periard D, Telenti A, Sudre P, Cheseaux JJ, Halfon P, Reymond MJ, Marcovina SM, Glauser MP, Nicod P, Darioli R, Mooser V. Atherogenic dyslipidemia in HIV-infected individuals treated with protease inhibitors. The Swiss HIV cohort study. Circulation. 1999;100:700–705. doi: 10.1161/01.cir.100.7.700. [DOI] [PubMed] [Google Scholar]
- 29.Hui DY. Effects of HIV protease inhibitor therapy on lipid metabolism. Progress in Lipid Research. 2003;42:81–92. doi: 10.1016/s0163-7827(02)00046-2. [DOI] [PubMed] [Google Scholar]
- 30.Grinspoon S, Carr A. Cardiovascular risk and body-fat abnormalities in HIV-infected adults. New England Journal of Medicine. 2005;352:48–62. doi: 10.1056/NEJMra041811. [DOI] [PubMed] [Google Scholar]
- 31.d’Arminio A, Sabin CA, Phillips AN, Reiss P, Weber R, Kirk O, El-Sadr W, De Wit S, Mateu S, Petoumenos K, Dabis F, Pradier C, Morfeldt L, Lundgren JD, Friis-Moller N. Cardio- and cerebrovascular events in HIV-infected persons. AIDS. 2004;18:1811–1187. doi: 10.1097/00002030-200409030-00010. [DOI] [PubMed] [Google Scholar]
- 32.Mary-Krause M, Cotte L, Simon A, Partisani M, Costagliola D. Increased risk of myocardial infarction with duration of protease inhibitor therapy in HIV-infected men. AIDS. 2004;17:2479–2486. doi: 10.1097/00002030-200311210-00010. [DOI] [PubMed] [Google Scholar]
- 33.Hudson RR, Kaplan NL. The coalescent process and background selection. Philosophical Transactions of the Royal Society of London, Series B Biological Sciences. 1995;349:19–23. doi: 10.1098/rstb.1995.0086. [DOI] [PubMed] [Google Scholar]
- 34.Hudson RR. Linkage disequilibrium and recombination. In: Balding D, Bishop M, Cannings C, editors. Handbook of Statistical Genetics. Wiley; New York: 2001. pp. 309–324. [Google Scholar]
- 35.Hudson RR. Generating samples under a Wright–Fisher neutral model. Bioinformatics. 2002;18:337–338. doi: 10.1093/bioinformatics/18.2.337. [DOI] [PubMed] [Google Scholar]
- 36.Nordbord M, Tavare S. Linkage disequilibrium: what history has to tell us. Trends in Genetics. 2002;18:83–90. doi: 10.1016/s0168-9525(02)02557-x. [DOI] [PubMed] [Google Scholar]
- 37.Donnelly P, Nordbord M, Joyce P. Likelihoods and simulation methods for a class of nonneutral population genetics models. Genetics. 2001;159:853–867. doi: 10.1093/genetics/159.2.853. [DOI] [PMC free article] [PubMed] [Google Scholar]
- 38.Devlin B, Risch N. A comparison of linkage disequilibrium measures for fine-scale mapping. Genomics. 1995;29:311–322. doi: 10.1006/geno.1995.9003. [DOI] [PubMed] [Google Scholar]
- 39.Stephens M, Donnelly P. Inference in molecular population genetics. Journal of Royal Statistical Society, Series B. 2000;62:605–655. [Google Scholar]
- 40.Stephens M, Donnelly P. A comparison of Bayesian methods for haplotype reconstruction from population genotype data. American Journal of Human Genetics. 2003;73:1162–1169. doi: 10.1086/379378. [DOI] [PMC free article] [PubMed] [Google Scholar]
- 41.Chakravarti A, Buetow KH, Antonarakis SE, Waber PG, Boehm CD, Kazazian HH. Nonuniform recombination within the human beta-globin gene cluster. American Journal of Human Genetics. 1984;36:1239–1258. [PMC free article] [PubMed] [Google Scholar]
- 42.Nickerson DA, Taylor SL, Weiss KM, Clark AG, Hutchinson RG, Stengard J, Salomaa V, Vartiainen E, Boerwinkle E, Sing CF. DNA sequence diversity in a 9.7-kb region of the human lipoprotein lipase gene. Nature Genetics. 1998;19:223–240. doi: 10.1038/907. [DOI] [PubMed] [Google Scholar]
- 43.McPeek MS, Strahs A. Assessment of linkage disequilibrium by the decay of haplotype sharing, with application to fine-scale genetic mapping. American Journal of Human Genetics. 1999;65:858–875. doi: 10.1086/302537. [DOI] [PMC free article] [PubMed] [Google Scholar]
- 44.Lien S, Szyda J, Schechinger B, Rappold G, Arnheim N. Evidence for heterogeneity in recombination in the human pseudoautosomal region: high resolution analysis by sperm typing and radiation-hybrid mapping. American Journal of Human Genetics. 2000;66:557–566. doi: 10.1086/302754. [DOI] [PMC free article] [PubMed] [Google Scholar]
- 45.Reich DE, Cargill M, Bolk S, Ireland J, Sabeti PC, Richter DJ, Lavery T, Kouyoumjian R, Farhadian SF, Ward R, Lander ES. Linkage disequilibrium in the human genome. Nature. 2001;411:199–204. doi: 10.1038/35075590. [DOI] [PubMed] [Google Scholar]
- 46.Gabriel SB, Schaffner SF, Nguyen H, Moore JM, Roy J, Blumenstiel B, Higgins J, DeFelice M, Lochner A, Faggart M, Liu-Cordero SN, Rotimi C, Adeyemo A, Cooper R, Ward R, Lander ES, Daly MJ, Altshuler D. The structure of haplotype blocks in the human genome. Science. 2002;296:2225–2229. doi: 10.1126/science.1069424. [DOI] [PubMed] [Google Scholar]
- 47.Padhukasahasram B, Marjoram P, Nordborg M. Estimating the rate of gene conversion on human chromosome. American Journal of Human Genetics. 2004;75:386–397. doi: 10.1086/423451. [DOI] [PMC free article] [PubMed] [Google Scholar]
- 48.Demidenko E. Mixed Models: Theory and Applications. Wiley; New York: 2004. [Google Scholar]
- 49.Fitzmaurice GM, Laird NM, Ware JH. Applied Longitudinal Analysis. Wiley; New York: 2004. [Google Scholar]
- 50.Schafer JL, Graham JW. Missing data: our view of the state of the art. Psychological Methods. 2002;7(2):147–177. [PubMed] [Google Scholar]
- 51.Li K-H, Meng X-L, Raghunathan TE, Rubin DB. Significance levels from repeated p-values with multiply-imputed data. Statistica Sinica. 1991;1:65–92. [Google Scholar]
- 52.Foulkes AS, Wohl DA, Frank I, Puleo E, Restine S, Wolfe ML, Dube MP, Tebas P, Reilly MP. Associations among race/ethnicity, APOC-III genotypes and lipids in HIV-1 infected individuals on antiretroviral therapy. PLoS Medicine. 2006;3(3):e52. doi: 10.1371/journal.pmed.0030052. [DOI] [PMC free article] [PubMed] [Google Scholar]
- 53.Boerwinkle E, Utermann G. Simultaneous effects of the apolipoprotein e polymorphism on apolipoprotein e, apolipoprotein b, and cholesterol metabolism. American Journal of Human Genetics. 1988;42(1):104–112. [PMC free article] [PubMed] [Google Scholar]
- 54.Cohen JC, Vega GL, Grundy SM. Hepatic lipase: new insights from genetic and metabolic studies. Current Opinion in Lipidology. 1999;10:259–267. doi: 10.1097/00041433-199906000-00008. [DOI] [PubMed] [Google Scholar]
- 55.Eichner JE, Dunn ST, et al. Apolipoprotein e polymorphism and cardiovascular disease: a huge review. American Journal of Epidemiology. 2002;155(6):487–495. doi: 10.1093/aje/155.6.487. [DOI] [PubMed] [Google Scholar]
- 56.Reilly MP, Foulkes AS, Wolfe M, Rader DJ. Higher-order lipase gene association with plasma triglycerides. Journal of Lipid Research. 2005;46(9):1914–1922. doi: 10.1194/jlr.M500042-JLR200. [DOI] [PubMed] [Google Scholar]
- 57.DeLemos AS, Wolfe ML, et al. Identification of genetic variants in endothelial lipase in persons with elevated high-density lipoprotein cholesterol. Circulation. 2002;106(11):1321–1326. doi: 10.1161/01.cir.0000028423.07623.6a. [DOI] [PubMed] [Google Scholar]
- 58.Ma K, Cilingiroglu M, et al. Endothelial lipase is a major genetic determinant for high-density lipoprotein concentration, structure, and metabolism. Proceedings of the National Academy of Sciences of the United States of America. 2003;100(5):2748–2753. doi: 10.1073/pnas.0438039100. [DOI] [PMC free article] [PubMed] [Google Scholar]
- 59.van Dijk KW, Rensen PC, Voshol PJ, Havekes LM. The role and mode of action of apolipoproteins ciii and av: synergistic actors in triglyceride metabolism? Current Opinion in Lipidology. 2004;15:239–246. doi: 10.1097/00041433-200406000-00002. [DOI] [PubMed] [Google Scholar]
- 60.Mahley RW, Rall SC., Jr Apolipoprotein e: far more than a lipid transport protein. Annual Review of Genomics and Human Genetics. 2000;1:507–537. doi: 10.1146/annurev.genom.1.1.507. [DOI] [PubMed] [Google Scholar]
- 61.Broedl UC, Jin W, et al. Endothelial lipase: a modulator of lipoprotein metabolism upregulated by inflammation. Trends in Cardiovascular Medicine. 2004;14(5):202–206. doi: 10.1016/j.tcm.2004.03.003. [DOI] [PubMed] [Google Scholar]
- 62.Westfall PH, Young SS. Resampling-based Multiple Testing. Wiley; New York: 1993. [Google Scholar]